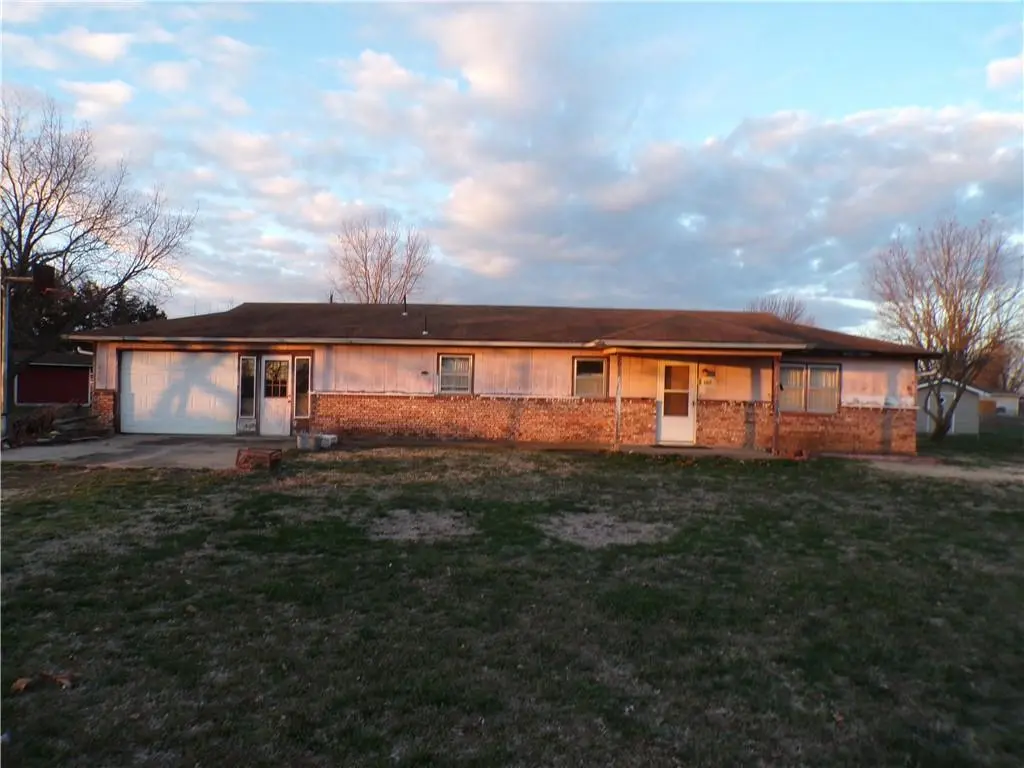
105 S Holiday Ln · Iola, KS
Flood risk 1/10 · Minimal
- FEMA flood zone
- X (unshaded)
- Chance of flooding over 30 yrs
- 0.0%
- Est. flood insurance / yr
- $507 – $1,088
Fire risk 3/10 · Minor
- Est. fire insurance / yr
- $1,154 – $2,142
Heat risk 5/10 · Moderate
- Hot days now (above 107°F)
- 7 days/yr
- Hot days in 30 yrs
- 18 days/yr
Wind risk 2/10 · Minimal
- Chance of severe wind over 30 yrs
- 1.0%
Air-quality risk 2/10 · Minimal
- Unhealthy air days now
- 1 days/yr
- Unhealthy air days in 30 yrs
- 1 days/yr
Risk factors via First Street. Map © Google.
Why this score? — see what drove the B- grade
The composite is a weighted blend of 9 inputs, each scored 0–100. Each bar is that input's sub-score; the figure is the points it added to the 100-point composite (weight × sub-score).
- Cash flow +30.0/30.0
- DSCR +10.0/10.0
- 1% rule +9.7/10.0
- ARV discount +7.5/15.0
- Livability +3.6/5.0
- Rent growth +2.5/5.0
- Condition / age +2.5/5.0
- Schools +2.1/10.0
- Appreciation +0.0/10.0
$59,500
🖨 Deal sheet (PDF) 📄 Offer letter ✓ Due diligence
Key facts
- Nice-sized lot
- Fence in backyard
- 0.48 acre lot
Tags
Property features AI
Finance
- HOA & community: No association fees
Exterior
- Parking: Attached 1-car garage
- Utilities: Private water source; Public sewer
- Home design: Single-family residential; Attached property; One-story
- Construction: Frame construction; Composition roof; Built approximately 41–50 years ago
- Exterior features: Property not in a flood plain; Lot approximately 20,930 square feet
Interior
- Kitchen: Kitchen on main level
- Bedrooms: 3 bedrooms, all on the first floor
- Bathrooms: 1 full bath; 1 half bath
- Heating & cooling: Forced air heating; Electric cooling (has cooling)
- Interior features: Ranch floor plan; Slab basement; Seven total rooms
Neighborhood map
What this means for you Summary
Snapshot
- This is a 3-bed/1.5-bath single-family listed at $60k.
Deal economics
- At list price, monthly cash flow is $280 ($3k/yr) — positive.
- The deal already cash-flows at list — no discount required.
- Meets the 1% rule at list price ($875 rent vs $60k).
- Recommended offer: $58k (3.0% below list) — sets the bar for market timing.
- Cap rate 11.9% vs local median 6.1% in Iola — top-decile yield for the area; either an underpriced asset or a hidden risk that comps aren't pricing in. Stress-test before assuming the spread holds.
Location & tenants
- Location reads 71/100 on livability (#150 in KS) — a middle-class / working-renter tenant base. Strengths: cost of living A+, housing A+, health & safety A+; Watch: schools D, crime F, amenities F.
- Iola (town): math 18% / reading 31% proficiency, ranked #140 of 169 in KS (top 83%) — low school quality limits family demand, transient renter base, plan for 1-2y turnover.
- Market conditions: 62 active listings in the ZIP; 1 comparable units currently listed for rent nearby; 18 units permitted in Allen County in 2024 (0 in 5+ unit buildings).
Forward outlook
- Local home prices are declining (-3.0%/yr); year-one equity from $411 of loan paydown is wiped out by about $2k of value loss. Plan a longer hold.
- Allen County population projected at -21% by 2050 — secular population decline; favor cash flow + early exit over multi-decade hold.
- At projected returns (-3.0% appreciation + 3.0% rent growth), your $17k cash investment doubles in ~7 years — after that, you're playing with house money.
Negotiation context
- It's been on market 36 days — a 3% lower offer ($58k) is reasonable based on typical stale-listing flexibility.
- 2 sale attempts with the ask held roughly flat each time — persistent listings suggest the price (not the market) is what's stuck; bring a comps-based counter.
- Current owner paid $30k; list at $60k implies a 95% gain — meaningful room to come down on a strong offer.
Risks & watch-outs
- Climate carrying-cost: extreme-heat days projected 7→18/yr by 2055 (HVAC capex compounding) — expect insurance premiums to compound above CPI over the hold.
Questions for the listing agent
- It's been on market 36 days. Have you received any prior offers? Is the seller open to a 3% concession, seller financing, or rate buy-down credit?
- Is there a deadline driving the sale (1031 exchange, divorce, estate, relocation)? That informs how much negotiation room exists.
- Schools are D-rated, which usually means shorter tenancies and higher turnover. Who's the typical renter profile here, and what's been the actual vacancy rate?
- Crime grade is F in this area — have there been break-ins, vandalism, or insurance claims at this property in the last 3 years? What carrier currently insures it and at what premium?
- What's the average days-on-market for RENTAL listings here right now (not sales)? A rising rental-DOM trend means longer vacancies and softer asking-rent achievability than the comps imply.
- What's the recent tenant-quality profile in this submarket — average credit score on applications, eviction rate, late-payment / NSF rate, and stable-employment percentage? A property-management company in the area should have these aggregated.
- How much new for-sale + rental construction is in the pipeline within 1–3 miles? Heavy new supply typically softens prices + rents 12–24 months out; constrained supply supports both.
Investment metrics
- 1% rule
- 1.47% ✓
- Cap rate
- 11.94%
- Cash-on-cash
- 20.17%
- DSCR
- 1.90
- GRM
- 5.7
CMA / ARV
- ARV (on-the-fly)
- $145,152
- Comps found
- 2
Show comp detail 2 sales within ~0.75 mi
| Address | Dist | Beds/Ba | Sqft | Sold | Price | $/sf | Match |
|---|---|---|---|---|---|---|---|
| 105 S Holiday Ln | 0.00mi | 3/1.5 | 1,152 (0%) | 0mo | $59,500 | $52 | 100 |
| 1620 N Walnut St | 0.72mi | 3/2.0 | 1,152 (0%) | 13mo | $145,000 | $126 | 53 |
Match score weights: distance 35% · size 25% · config 20% · recency 20%. Top-matched comps best support the ARV.
Projected returns pro-forma
-3.0% appreciation · 3.0% rent growth · sell at horizon
- IRR
- 12.4%
- Equity multiple
- 1.49×
- Total profit
- $8,209
- Equity at exit
- $8,872
- IRR
- 21.3%
- Equity multiple
- 2.81×
- Total profit
- $30,170
- Equity at exit
- $5,144
Cash invested: $16,660 (down + closing). Projections, not guarantees.
Landlord ↔ Tenant lean methodology
- Overall (STATE)
- 83 Strongly Landlord-Friendly
- State Kansas
- 83 Strongly Landlord-Friendly · R+10
- County
- — inherits STATE
- City
- — inherits STATE
ZIP-level market 66749
- Home prices YoY
- -32.6%
- Active inventory
- 62
- Price-to-rent
- 5.7×
Monthly cashflow live
- Estimated rent
- $875 medium interval (Pro) →
- Mortgage (P&I)
- −$312
- Tax est. 1.5%
- −$74 /mo · $892/yr
- Insurance
- −$25
- HOA
- −$0
- Vacancy / Maint / Mgmt
- −$184
- Net cashflow
- $280
Break-even live
Sensitivity live
| Price | -10% $321 | -5% $301 | +0% $280 | +5% $259 | +10% $239 |
|---|---|---|---|---|---|
| Rent | -10% $211 | -5% $245 | +0% $280 | +5% $315 | +10% $349 |
| Rate | -1.0pp $310 | -0.5pp $295 | base $280 | +0.5pp $265 | +1.0pp $249 |
UW: 25.0% down · 7.5% · 30yr · 1.5% tax · 5.0% vac · 8.0% maint · 8.0% mgmt
Financing live
Cash to close
- Down payment
- $14,875
- Closing costs
- $1,785
- Reserves months
- —
- Total cash needed
- —
Loan-product check · same deal, 3 products live
Conventional
25% down · 7.5% · 30yr
- Down + closing
- —
- Monthly P&I
- —
- Monthly cashflow
- —
- DSCR
- —
- Eligible?
- —
Personal DTI + credit; lowest rate.
DSCR
20% down · 8.5% · 30yr
- Down + closing
- —
- Monthly P&I
- —
- Monthly cashflow
- —
- DSCR
- —
- Eligible?
- —
No personal income docs; deal must DSCR.
Hard money
10% down · 12.0% · 12mo
- Down + closing
- —
- Monthly P&I
- —
- Monthly cashflow
- —
- DSCR
- —
- Eligible?
- —
Short-term bridge; refi at stabilization.
Rent comps 1 comps
| Address | Beds | Baths | Sqft | Rent | $/sqft | DOM | Units | Dist |
|---|---|---|---|---|---|---|---|---|
| 820 N Walnut St Iola, KS | 2.0 | 1.0 | 950 | $875 | $0.92 | 44d | 1 | 1.33mi |
Listing history 5 events
-
2026-05-15status Pending
-
2026-04-20status Active
-
2026-03-28status Pending
-
2026-03-17$59,500 Active
-
1987-04-01soldstatus $30,500
ⓘ Source: listings_history table (triggers on properties + properties_extension) + one-shot
backfill from property_details.listing_events for pre-trigger history.
Climate risk First Street
- Flood 1/10 Low FEMA zone X (unshaded) · 0% chance over 30 yrs
- Wildfire 3/10 Moderate
- Heat 5/10 Major 7 d/yr ≥107°F today · 18 d/yr by 30 yrs out
- Wind 2/10 Low 100% chance of damaging wind over 30 yrs
- Air quality 2/10 Low 1 unhealthy d/yr today · 1 by 30 yrs out
Nearby sold comps map
Loading sold comps map…
Walkable amenities ~0.75 mi
Loading nearby amenities…
Taxation est. · year 1
- Rental income
- $10,500
- − Mortgage interest
- −$3,333
- − Property taxes
- −$892
- − Insurance
- −$298
- − Repairs & maintenance
- −$840
- − Management
- −$840
- − Depreciation
- −$1,731
- Taxable income
- $2,566
- Est. tax owed @ 24.0%
- −$616
- After-tax cash flow
- $2,745/yr
For passive investors: Depreciation is non-cash, so a rental often shows a tax loss while cash-flowing — sheltering income. Rental losses are passive: they offset passive income freely, and up to $25,000/yr can offset ordinary (W-2) income if you actively participate and your MAGI is under $100k (phasing out to $0 by $150k); unused losses carry forward. On sale, claimed depreciation is recaptured at up to 25%, and gains may owe capital-gains tax (a 1031 exchange can defer both). Figures are a year-1 estimate at your 24.0% rate — not tax advice; consult a CPA.
Schools (NCES district)
- District
- Iola
- NCES district ID
- 2007740
- Math proficiency
- 18% ▼ -5.00%
- Reading proficiency
- 31% ▼ -3.00%
- Median HH income
- $38,749
- Composite
- 20.52/100
- National rank
- #8567
- State rank
- #140 of 169 in KS
Livability — Iola
- Score
- 71/100
- State rank
- #150
- US rank
- #7275
Category grades
Schools grade is shown separately in the Schools card above.
Census & demographics
- Population (ZIP)
- 7,452
Population outlook (Allen County) Hauer SSP2
- Today (2025)
- 11,885 people
- By 2030
- 11,352 · -4.5%
- By 2040
- 10,285 · -13.5%
- By 2050
- 9,342 · -21.4%
- By 2075
- 7,482 · -37.0%
- By 2100
- 5,871 · -50.6%
Race, ethnicity, and origin ACS 2023
- Neighborhood character
- Predominantly White (87%)
- Race & ethnicity
- White 87% Hispanic / Latino 4% Two or more races 4% Black 3% Native American 1% Pacific Islander 1%
- Common ancestry
- Italian 2% Lithuanian 2% Iranian 1%
- Foreign-born
- 2% · Canada
- Languages at home
- 98% English-only · Spanish 1% Other Asian/Pacific 1%
Political lean MEDSL · Allen
- 2024 margin
- Solid R (+46.1) · D 25.8% · R 72.0% · Other 2.2%
- 2008→2024 swing
- -22.9pp toward R · 2008: -23.3pp · 2024: -46.1pp
- All cycles
- 2024: R+46.1 2020: R+44.4 2016: R+41.0 2012: R+27.2 2008: R+23.3
Not yet ingested
- Civics
- —
Market trends
- HPI YoY
- ▼ -73.20%
- Current HPI
- 151.1778
- Rent YoY
- —
- Metro
- —
- State GDP YoY
- —
- F500 in state
- 0
Price history
+95.1% since first listed5 events — show timeline
- 2026-05-15 Pending — Heartland MLS as Distributed by MLS Grid
- 2026-04-20 Relisted — Heartland MLS as Distributed by MLS Grid
- 2026-03-28 Pending — Heartland MLS as Distributed by MLS Grid
- 2026-03-17 Listed $59,500 Heartland MLS as Distributed by MLS Grid
- 1987-04-01 Sold (Public Records) $30,500 Public Records
Cash-flow waterfall
monthlySold comps — $/sqft
last 12 mo · ≤1 miLoading sold comps…