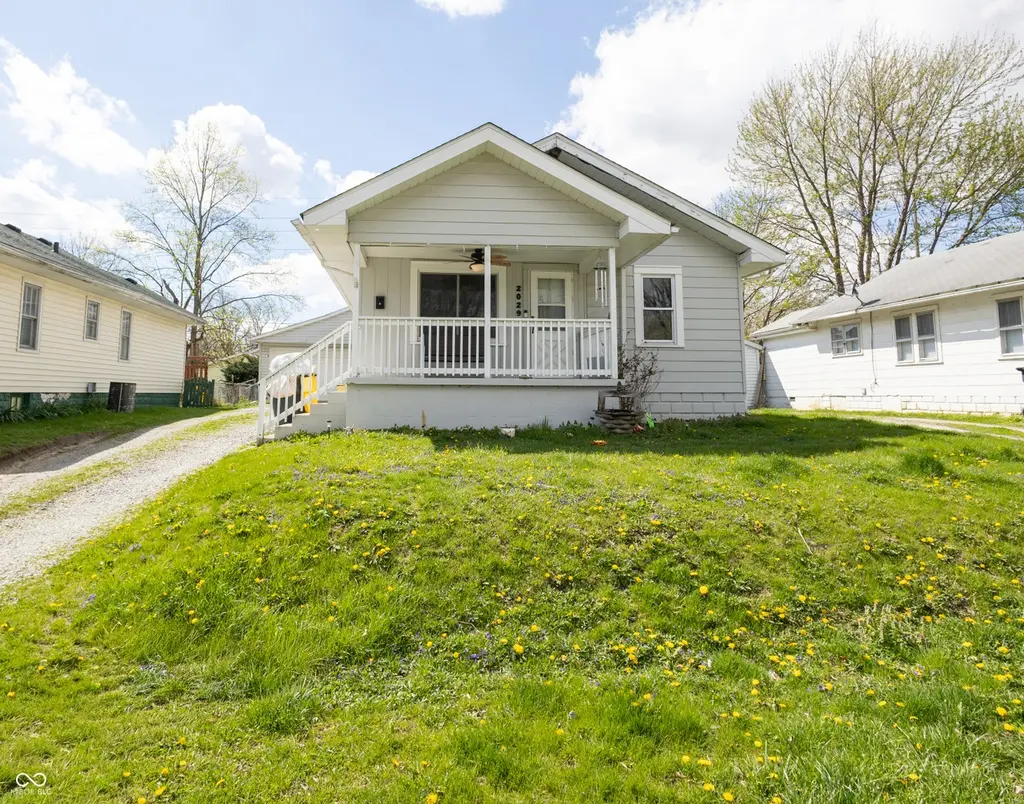
2029 Hill St · Anderson, IN
Flood risk 1/10 · Minimal
- FEMA flood zone
- X (unshaded)
- Chance of flooding over 30 yrs
- 0.0%
- Est. flood insurance / yr
- $473 – $860
Fire risk 1/10 · Minimal
- Est. fire insurance / yr
- $717 – $1,331
Heat risk 3/10 · Minor
- Hot days now (above 100°F)
- 7 days/yr
- Hot days in 30 yrs
- 18 days/yr
Wind risk 2/10 · Minimal
- Chance of severe wind over 30 yrs
- 0.0%
Air-quality risk 3/10 · Minor
- Unhealthy air days now
- 2 days/yr
- Unhealthy air days in 30 yrs
- 3 days/yr
Risk factors via First Street. Map © Google.
Why this score? — see what drove the D grade
The composite is a weighted blend of 9 inputs, each scored 0–100. Each bar is that input's sub-score; the figure is the points it added to the 100-point composite (weight × sub-score).
- Cash flow +15.8/30.0
- ARV discount +7.7/15.0
- DSCR +4.9/10.0
- 1% rule +3.8/10.0
- Rent growth +3.0/5.0
- Livability +3.0/5.0
- Condition / age +2.5/5.0
- Schools +1.6/10.0
- Appreciation +0.0/10.0
$145,000
🖨 Deal sheet (PDF) 📄 Offer letter ✓ Due diligence
Listing remarks MLS
Income-producing property with tenant in place through 9/30/2026 at $1,400/month. This 3-bedroom, 1-bath home offers approximately 2,076 square feet, including a large bonus/family room and 2-car attached garage, adding long-term rental appeal. Sold as-is. No showings without accepted offer. Part of a 3-property investment portfolio available individually or as a package.
Key facts
- 7,000 sq ft lot
- 2 garage spots
- Built 1930
Neighborhood map
What this means for you Summary
Snapshot
- This is a 2-bed/1.0-bath single-family listed at $145k.
Deal economics
- At list price, monthly cash flow is $67 ($805/yr) — positive.
- The deal already cash-flows at list — no discount required.
- To meet the 1% rule (rent ≥ 1% of price), the offer needs to be $128k (11.7% below list).
- Recommended offer: $128k (11.7% below list) — sets the bar for 1% rule.
Location & tenants
- Location reads 60/100 on livability (#521 in IN) — a middle-class / working-renter tenant base. Strengths: cost of living A+, housing A+; Watch: crime D-, amenities F, commute F.
- Anderson Community School Corporation (urban): math 15% / reading 23% proficiency, ranked #280 of 301 in IN (top 93%) — low school quality limits family demand, transient renter base, plan for 1-2y turnover; 70% free/reduced lunch — lower-income household profile, screen leases tightly.
- Zoned schools: Eastside Elementary School (math 34% / reading 36%, grade F, #590 of 994 statewide, top 60%, 511 students, 77% FRL); Highland Middle School (math 9% / reading 22%, grade F, #293 of 330 statewide, top 90%, 914 students, 81% FRL); Anderson High School (math 21% / reading 51%, grade F, #261 of 369 statewide, top 71%, 1,790 students, 76% FRL).
- Market conditions: Rents rising (+1.8%/yr); 162 active listings in the ZIP; 3 comparable units currently listed for rent nearby; rentals at typical pace (median 18d on market — plan ~3-4 weeks tenant-placement turnaround); 184 units permitted in Madison County in 2024 (0 in 5+ unit buildings).
Forward outlook
- Local home prices are declining (-3.0%/yr); year-one equity from $1k of loan paydown is wiped out by about $4k of value loss. Plan a longer hold.
- Madison County population projected at -14% by 2050 — secular population decline; favor cash flow + early exit over multi-decade hold.
Negotiation context
- It's been on market 72 days — a 6% lower offer ($136k) is reasonable based on typical stale-listing flexibility.
- 8 sale attempts since 25y ago with the ask held roughly flat each time — persistent listings suggest the price (not the market) is what's stuck; bring a comps-based counter.
Risks & watch-outs
- Watch-outs: built in 1930 — expect roof / HVAC / electrical / plumbing capex.
Questions for the listing agent
- It's been on market 72 days. Have you received any prior offers? Is the seller open to a 12% concession, seller financing, or rate buy-down credit?
- Built in 1930 — when were the roof, HVAC, electrical panel, plumbing, and water heater last replaced?
- Why hasn't it sold? Are there any deal-killer items the seller is aware of (foundation, flood, title, zoning, code violations)?
- Is there a deadline driving the sale (1031 exchange, divorce, estate, relocation)? That informs how much negotiation room exists.
- Schools are F-rated, which usually means shorter tenancies and higher turnover. Who's the typical renter profile here, and what's been the actual vacancy rate?
- Crime grade is D in this area — have there been break-ins, vandalism, or insurance claims at this property in the last 3 years? What carrier currently insures it and at what premium?
- The area grade is low — what's the realistic commute time and amenity access for the typical tenant pool here? Any planned neighborhood developments (good or bad) we should know about?
- What's the average days-on-market for RENTAL listings here right now (not sales)? A rising rental-DOM trend means longer vacancies and softer asking-rent achievability than the comps imply.
- What's the recent tenant-quality profile in this submarket — average credit score on applications, eviction rate, late-payment / NSF rate, and stable-employment percentage? A property-management company in the area should have these aggregated.
- How much new for-sale + rental construction is in the pipeline within 1–3 miles? Heavy new supply typically softens prices + rents 12–24 months out; constrained supply supports both.
Investment metrics
- 1% rule
- 0.88% ✗
- Cap rate
- 6.85%
- Cash-on-cash
- 1.98%
- DSCR
- 1.09
- GRM
- 9.4
CMA / ARV
- ARV (median comp)
- $145,712
- List price
- $145,000
- Delta
- -0.49%
- Verdict
- FAIR
- Comps
- 20 within 1.0 mi
Show comp detail 10 sales within ~0.75 mi
| Address | Dist | Beds/Ba | Sqft | Sold | Price | $/sf | Match |
|---|---|---|---|---|---|---|---|
| 224 E Cross St | 0.05mi | 2/1.0 | 1,440 (-8%) | 2mo | $50,000 | $35 | 83 |
| 1735 Poplar St | 0.28mi | 2/1.0 | 1,628 (+4%) | 20mo | $120,000 | $74 | 64 |
| 1902 Silver St | 0.28mi | 3/1.0 (+1) | 1,679 (+7%) | 15mo | $159,900 | $95 | 58 |
| 2025 Crystal St | 0.07mi | 2/2.0 | 1,404 (-10%) | 21mo | $128,000 | $91 | 58 |
| 2013 Alexandria Pike | 0.52mi | 2/1.0 | 1,392 (-11%) | 2mo | $175,000 | $126 | 56 |
| 2037 Lafayette St | 0.34mi | 3/1.0 (+1) | 1,406 (-10%) | 22mo | $154,000 | $110 | 44 |
| 1128 Lawson Ct | 0.73mi | 3/1.0 (+1) | 1,728 (+10%) | 2mo | $47,000 | $27 | 43 |
| 222 E Mulberry St | 0.20mi | 3/2.0 (+1) | 1,797 (+15%) | 21mo | $180,000 | $100 | 40 |
| 404 W Vinyard St | 0.68mi | 3/1.5 (+1) | 1,415 (-10%) | 22mo | $155,000 | $110 | 27 |
| 522 Hawthorne Ave | 0.64mi | 3/2.0 (+1) | 1,332 (-15%) | 21mo | $165,000 | $124 | 19 |
Match score weights: distance 35% · size 25% · config 20% · recency 20%. Top-matched comps best support the ARV.
Projected returns pro-forma
-3.0% appreciation · 1.82% rent growth · sell at horizon
- IRR
- -14.4%
- Equity multiple
- 0.49×
- Total profit
- $-20,741
- Equity at exit
- $21,620
- IRR
- -7.7%
- Equity multiple
- 0.54×
- Total profit
- $-18,645
- Equity at exit
- $12,537
Cash invested: $40,600 (down + closing). Projections, not guarantees.
Landlord ↔ Tenant lean methodology
- Overall (STATE)
- 90 Strongly Landlord-Friendly
- State Indiana
- 90 Strongly Landlord-Friendly · R+11
- County
- — inherits STATE
- City
- — inherits STATE
ZIP-level market 46012
- Home prices YoY
- -18.6%
- Rents YoY
- 1.8%
- Active inventory
- 162
- Price-to-rent
- 9.4×
Monthly cashflow live
- Estimated rent
- $1,281 medium interval (Pro) →
- Mortgage (P&I)
- −$760
- Tax from tax record
- −$124 /mo · $1,485/yr
- Insurance
- −$60
- HOA
- −$0
- Vacancy / Maint / Mgmt
- −$269
- Net cashflow
- $67
Break-even live
Sensitivity live
| Price | -10% $149 | -5% $108 | +0% $67 | +5% $26 | +10% $-15 |
|---|---|---|---|---|---|
| Rent | -10% $-34 | -5% $17 | +0% $67 | +5% $118 | +10% $168 |
| Rate | -1.0pp $140 | -0.5pp $104 | base $67 | +0.5pp $30 | +1.0pp $-9 |
UW: 25.0% down · 7.5% · 30yr · 1.5% tax · 5.0% vac · 8.0% maint · 8.0% mgmt
Financing live
Cash to close
- Down payment
- $36,250
- Closing costs
- $4,350
- Reserves months
- —
- Total cash needed
- —
Loan-product check · same deal, 3 products live
Conventional
25% down · 7.5% · 30yr
- Down + closing
- —
- Monthly P&I
- —
- Monthly cashflow
- —
- DSCR
- —
- Eligible?
- —
Personal DTI + credit; lowest rate.
DSCR
20% down · 8.5% · 30yr
- Down + closing
- —
- Monthly P&I
- —
- Monthly cashflow
- —
- DSCR
- —
- Eligible?
- —
No personal income docs; deal must DSCR.
Hard money
10% down · 12.0% · 12mo
- Down + closing
- —
- Monthly P&I
- —
- Monthly cashflow
- —
- DSCR
- —
- Eligible?
- —
Short-term bridge; refi at stabilization.
Rent comps 3 comps
| Address | Beds | Baths | Sqft | Rent | $/sqft | DOM | Units | Dist |
|---|---|---|---|---|---|---|---|---|
| 220 W Willow St Anderson, IN | 3.0 | 1.0 | 1200 | $1,250 | $1.04 | 0d | 1 | 0.49mi |
| 521 W Vinyard St Anderson, IN | 3.0 | 2.0 | 1712 | $1,495 | $0.87 | 18d | 1 | 0.77mi |
| 632 W 300 N Anderson, IN | 3.0 | 1.0 | 1196 | $1,395 | $1.17 | 46d | 1 | 1.10mi |
Listing history 31 events
-
2026-06-21days on market $145,000 Active 72 DOM
-
2026-06-18days on market $145,000 Active 69 DOM
-
2026-06-17days on market $145,000 Active 68 DOM
-
2026-06-16days on market $145,000 Active 67 DOM
-
2026-06-15days on market $145,000 Active 66 DOM
-
2026-06-13days on market $145,000 Active 64 DOM
-
2026-06-09days on market $145,000 Active 60 DOM
-
2026-06-08days on market $145,000 Active 59 DOM
-
2026-06-07days on market $145,000 Active 58 DOM
-
2026-06-05days on market $145,000 Active 55 DOM
-
2026-06-03days on market $145,000 Active 54 DOM
-
2026-06-02days on market $145,000 Active 53 DOM
-
2026-06-01days on market $145,000 Active 52 DOM
-
2026-05-31days on market $145,000 Active 51 DOM
-
2026-04-08$145,000 Active 374-char remark
Show marketing remark (374 chars)
Income-producing property with tenant in place through 9/30/2026 at $1,400/month. This 3-bedroom, 1-bath home offers approximately 2,076 square feet, including a large bonus/family room and 2-car attached garage, adding long-term rental appeal. Sold as-is. No showings without accepted offer. Part of a 3-property investment portfolio available individually or as a package.
-
2025-09-25historical $1,400
-
2025-08-26$1,400
-
2024-05-24historical $1,300
-
2024-04-25$1,300
-
2024-04-08soldstatus $140,000 Closed 308-char remark
Show marketing remark (308 chars)
Check out this fabulously renovated 3 bedrooms home with a two car attached garage and huge bonus room with a bar in the back of the house. Enjoy the evenings on the large front porch. the renovated bathroom is inviting and well done. The large master bedroom on the second level offers ample space to relax.
-
2023-12-22status Pending 308-char remark
Show marketing remark (308 chars)
Check out this fabulously renovated 3 bedrooms home with a two car attached garage and huge bonus room with a bar in the back of the house. Enjoy the evenings on the large front porch. the renovated bathroom is inviting and well done. The large master bedroom on the second level offers ample space to relax.
-
2023-12-22$140,000 Active 308-char remark
Show marketing remark (308 chars)
Check out this fabulously renovated 3 bedrooms home with a two car attached garage and huge bonus room with a bar in the back of the house. Enjoy the evenings on the large front porch. the renovated bathroom is inviting and well done. The large master bedroom on the second level offers ample space to relax.
-
2022-01-10soldstatus $116,500 Closed
-
2021-12-06status Pending
-
2021-11-13status Active
-
2021-11-10status Pending
-
2021-11-08status Active
-
2021-10-28status Pending
-
2021-10-19$115,000 Active
-
2001-12-06soldstatus $53,900
-
2001-07-26$55,900
ⓘ Source: listings_history table (triggers on properties + properties_extension) + one-shot
backfill from property_details.listing_events for pre-trigger history.
Tax reassessment forecast IN · Partial reset (capped growth)
- Current annual tax
- $1,485 · $124/mo
- Projected year-2 tax
- $1,485 · $124/mo
- Expected delta
- $0/yr ($0/mo · 0.0%)
ⓘ Screening estimate from a state-policy table — verify with the county assessor before closing.
Climate risk First Street
- Flood 1/10 Low FEMA zone X (unshaded) · 0% chance over 30 yrs
- Wildfire 1/10 Low
- Heat 3/10 Moderate 7 d/yr ≥100°F today · 18 d/yr by 30 yrs out
- Wind 2/10 Low 0% chance of damaging wind over 30 yrs
- Air quality 3/10 Moderate 2 unhealthy d/yr today · 3 by 30 yrs out
Nearby sold comps map
Loading sold comps map…
Walkable amenities ~0.75 mi
Loading nearby amenities…
Taxation est. · year 1
- Rental income
- $15,366
- − Mortgage interest
- −$8,122
- − Property taxes
- −$1,485
- − Insurance
- −$725
- − Repairs & maintenance
- −$1,229
- − Management
- −$1,229
- − Depreciation
- −$4,218
- Taxable loss
- −$1,642
- Est. tax savings @ 24.0%
- +$394
- After-tax cash flow
- $1,199/yr
For passive investors: Depreciation is non-cash, so a rental often shows a tax loss while cash-flowing — sheltering income. Rental losses are passive: they offset passive income freely, and up to $25,000/yr can offset ordinary (W-2) income if you actively participate and your MAGI is under $100k (phasing out to $0 by $150k); unused losses carry forward. On sale, claimed depreciation is recaptured at up to 25%, and gains may owe capital-gains tax (a 1031 exchange can defer both). Figures are a year-1 estimate at your 24.0% rate — not tax advice; consult a CPA.
Schools (NCES district)
- District
- Anderson Community School Corporation
- NCES district ID
- 1800150
- Math proficiency
- 15% ▼ -14.00%
- Reading proficiency
- 23% ▼ -7.00%
- Median HH income
- $38,208
- Composite
- 15.93/100
- National rank
- #9250
- State rank
- #280 of 301 in IN
Livability — Anderson
- Score
- 60/100
- State rank
- #521
- US rank
- #18709
Category grades
Schools grade is shown separately in the Schools card above.
Census & demographics
- Census place
- Anderson, IN
- County
- Madison County · 69,445 people
- City population
- 57,762
- Metro
- Indianapolis-Carmel-Anderson, IN
- Population (ZIP)
- 20,855
- Household income
- $58,041
- Rent vs Own
- Severe rent burden
- 987.0
Population outlook (Madison County) Hauer SSP2
- Today (2025)
- 125,800 people
- By 2030
- 122,640 · -2.5%
- By 2040
- 115,420 · -8.3%
- By 2050
- 108,148 · -14.0%
- By 2075
- 91,838 · -27.0%
- By 2100
- 75,670 · -39.8%
Race, ethnicity, and origin ACS 2023
- Neighborhood character
- Predominantly White (85%)
- Race & ethnicity
- White 85% Hispanic / Latino 5% Two or more races 4% Black 4%
- Hispanic origin (detail)
- Mexican 4%
- Common ancestry
- Slovak 3% Serbian 2% Italian 1%
- Foreign-born
- 2% · Canada, Vietnam
- Languages at home
- 96% English-only · Spanish 3%
Political lean MEDSL · Madison
- 2024 margin
- Strong R (+26.9) · D 35.6% · R 62.5% · Other 1.9%
- 2008→2024 swing
- -33.5pp toward R · 2008: 6.5pp · 2024: -26.9pp
- All cycles
- 2024: R+26.9 2020: R+22.6 2016: R+25.7 2012: R+4.5 2008: D+6.5
Not yet ingested
- Civics
- —
Market trends
- HPI YoY
- ▼ -61.16%
- Current HPI
- 266.9819
- Rent YoY
- ▲ 1.82%
- Metro
- Indianapolis-Carmel-Anderson, IN
- State GDP YoY
- ▲ 2.90%
- F500 in state
- 18
Industry mix (Fortune 500 HQ in IN)
| Industry | F500 HQs | Revenue |
|---|---|---|
| Industrial Machinery | 2 | $37B |
|
||
| Healthcare | 1 | $177B |
|
||
| Pharmaceuticals | 1 | $45B |
|
||
| Metals / Steel | 1 | $18B |
|
||
| Agriculture | 1 | $17B |
|
||
| Packaging | 1 | $12B |
|
||
Price history
+159.4% since first listed17 events — show timeline
- 2026-04-08 Listed $145,000 MIBOR as Distributed by MLS Grid
- 2025-09-25 Rental Removed $1,400 BUILDIUM
- 2025-08-26 Listed for Rent $1,400 BUILDIUM
- 2024-05-24 Rental Removed $1,300 BUILDIUM
- 2024-04-25 Listed for Rent $1,300 BUILDIUM
- 2024-04-08 Sold (MLS) $140,000 MIBOR as Distributed by MLS Grid
- 2023-12-22 Pending — MIBOR as Distributed by MLS Grid
- 2023-12-22 Listed $140,000 MIBOR as Distributed by MLS Grid
- 2022-01-10 Sold (MLS) $116,500 MIBOR as Distributed by MLS Grid
- 2021-12-06 Pending — MIBOR as Distributed by MLS Grid
- 2021-11-13 Relisted — MIBOR as Distributed by MLS Grid
- 2021-11-10 Pending — MIBOR as Distributed by MLS Grid
- 2021-11-08 Relisted — MIBOR as Distributed by MLS Grid
- 2021-10-28 Pending — MIBOR as Distributed by MLS Grid
- 2021-10-19 Listed $115,000 MIBOR as Distributed by MLS Grid
- 2001-12-06 Sold (MLS) $53,900 MIBOR as Distributed by MLS Grid
- 2001-07-26 Listed $55,900 MIBOR as Distributed by MLS Grid
Property tax history
+11.2%/yrLatest (2024): $1,485 · +9.8% YoY. Source: county tax records.
Cash-flow waterfall
monthlySold comps — $/sqft
last 12 mo · ≤1 miLoading sold comps…