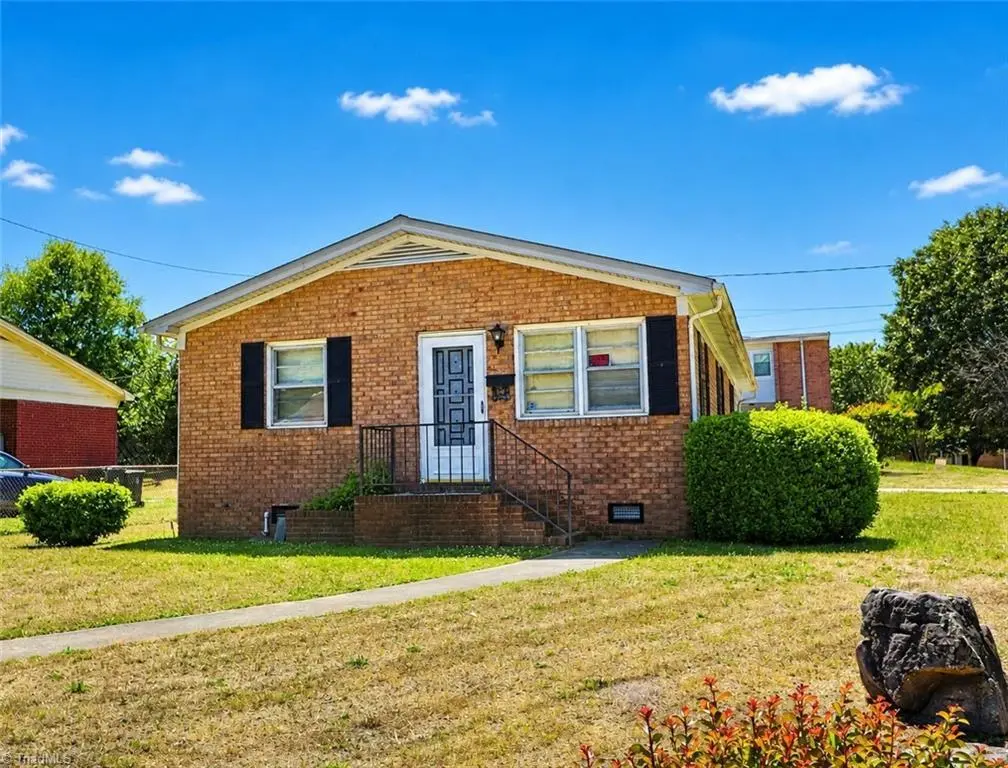
834 Mary James Ave · Thomasville, NC
Flood risk 1/10 · Minimal
- FEMA flood zone
- X (unshaded)
- Chance of flooding over 30 yrs
- 0.0%
- Est. flood insurance / yr
- $507 – $1,088
Fire risk 3/10 · Minor
- Est. fire insurance / yr
- $906 – $1,684
Heat risk 5/10 · Moderate
- Hot days now (above 103°F)
- 7 days/yr
- Hot days in 30 yrs
- 17 days/yr
Wind risk 4/10 · Minor
- Chance of severe wind over 30 yrs
- 14.0%
Air-quality risk 2/10 · Minimal
- Unhealthy air days now
- 1 days/yr
- Unhealthy air days in 30 yrs
- 1 days/yr
Risk factors via First Street. Map © Google.
Why this score? — see what drove the C+ grade
The composite is a weighted blend of 9 inputs, each scored 0–100. Each bar is that input's sub-score; the figure is the points it added to the 100-point composite (weight × sub-score).
- Cash flow +26.4/30.0
- DSCR +9.0/10.0
- ARV discount +7.5/15.0
- 1% rule +5.9/10.0
- Livability +4.0/5.0
- Rent growth +3.6/5.0
- Condition / age +2.5/5.0
- Schools +2.0/10.0
- Appreciation +0.0/10.0
$115,000
🖨 Deal sheet 📄 Offer letter ✓ Due diligence
Listing remarks
* * Amazing Flip Opportunity in Thomasville! * * Charming, convenient, and full of potential, 834 Mary James Avenue offers a fantastic opportunity for investors or renovators looking for their next project. This single-level home features comfortable living spaces, a spacious yard, and a layout that’s ready for your vision. Perfectly located with easy access to local amenities, this property is ideal for first-time buyers, downsizers, or anyone looking to add value through updates and improvements. Don’t miss your chance to transform this home into something special—schedule your showing today!
Key facts
- 6,969 sq ft lot
- Built 1966
Property features AI
Finance
- Other: Public maintained road
- HOA & community: No homeowners association
Exterior
- Parking: Driveway (no garage)
- Security: Security system
- Utilities: Public water; Public sewer; Electric water heater; Electric-powered heating
- Home design: Residential stick/site-built house; One story; Built in 1966; Has two or more access exits
- Construction: Brick and vinyl siding exterior
- Exterior features: Outdoor lighting; Fenced yard; Storage structure on property; Corner, level/flat city lot
Interior
- Kitchen: Free-standing range
- Bedrooms: Primary bedroom on main level
- Flooring: Carpet; Vinyl
- Bathrooms: 1 full bathroom
- Heating & cooling: Heat pump heating (electric); Central air; Window unit(s)
- Interior features: Ceiling fans; Storm windows
- Laundry & utility: Washer hookup; Dryer connection; Electric water heater
Neighborhood map
What this means for you Summary
Snapshot
- This is a 2-bed/1.0-bath single-family listed at $115k.
Deal economics
- At list price, monthly cash flow is $299 ($4k/yr) — positive.
- The deal already cash-flows at list — no discount required.
- Meets the 1% rule at list price ($1k rent vs $115k).
- Cap rate 9.4% vs local median 3.1% in Thomasville — top-decile yield for the area; either an underpriced asset or a hidden risk that comps aren't pricing in. Stress-test before assuming the spread holds.
Location & tenants
- Location reads 81/100 on livability (#16 in NC, #1,454 nationally) — a professional / high-income tenant draw. Strengths: commute A+, cost of living A+, housing A+; Watch: crime D+, schools F, employment F.
- Thomasville City Schools (suburban): math 24% / reading 25% proficiency, ranked #164 of 178 in NC (top 92%) — low school quality limits family demand, transient renter base, plan for 1-2y turnover; 82% free/reduced lunch — lower-income household profile, screen leases tightly.
- Market conditions: Rents rising fast (+4.3%/yr); 307 active listings in the ZIP; 5 comparable units currently listed for rent nearby; rentals at typical pace (median 14d on market — plan ~3-4 weeks tenant-placement turnaround); 990 units permitted in Davidson County in 2024 (54 in 5+ unit buildings).
Forward outlook
- Local home prices are declining (-3.0%/yr); year-one equity from $795 of loan paydown is wiped out by about $3k of value loss. Plan a longer hold.
- Davidson County population projected to shrink 6% by 2050 — rents likely to lag national; underwrite the cash flow, not the appreciation.
- At projected returns (-3.0% appreciation + 4.3% rent growth), your $32k cash investment doubles in ~9 years — after that, you're playing with house money.
Negotiation context
- Only 1 days on market — expect competitive offers; lowballing is unlikely to land.
Risks & watch-outs
- Climate carrying-cost: extreme-heat days projected 7→17/yr by 2055 (HVAC capex compounding) — expect insurance premiums to compound above CPI over the hold.
Questions for the listing agent
- Built in 1966 — when were the roof, HVAC, electrical panel, plumbing, and water heater last replaced?
- Is there a deadline driving the sale (1031 exchange, divorce, estate, relocation)? That informs how much negotiation room exists.
- Schools are F-rated, which usually means shorter tenancies and higher turnover. Who's the typical renter profile here, and what's been the actual vacancy rate?
- Crime grade is D in this area — have there been break-ins, vandalism, or insurance claims at this property in the last 3 years? What carrier currently insures it and at what premium?
- What's the average days-on-market for RENTAL listings here right now (not sales)? A rising rental-DOM trend means longer vacancies and softer asking-rent achievability than the comps imply.
- What's the recent tenant-quality profile in this submarket — average credit score on applications, eviction rate, late-payment / NSF rate, and stable-employment percentage? A property-management company in the area should have these aggregated.
- How much new for-sale + rental construction is in the pipeline within 1–3 miles? Heavy new supply typically softens prices + rents 12–24 months out; constrained supply supports both.
Investment metrics
- 1% rule
- 1.09% ✓
- Cap rate
- 9.42%
- Cash-on-cash
- 11.15%
- DSCR
- 1.50
- GRM
- 7.7
CMA / ARV
- ARV (on-the-fly)
- $235,125
- Comps found
- 12
Show comp detail 12 sales within ~0.75 mi
| Address | Dist | Beds/Ba | Sqft | Sold | Price | $/sf | Match |
|---|---|---|---|---|---|---|---|
| 834 Mary James Ave | 0.00mi | 3/1.0 (+1) | 1,375 (0%) | 1mo | $115,000 | $84 | 94 |
| 500 Pineywood Rd | 0.38mi | 3/2.0 (+1) | 1,338 (-3%) | 2mo | $255,000 | $191 | 67 |
| 732 Salem St | 0.57mi | 2/1.5 | 1,305 (-5%) | 12mo | $199,000 | $152 | 53 |
| 125 Forest Park Ln | 0.57mi | 2/2.0 | 1,277 (-7%) | 7mo | $110,000 | $86 | 52 |
| 614 Huger St | 0.36mi | 3/2.0 (+1) | 1,251 (-9%) | 10mo | $230,000 | $184 | 51 |
| 1132 W Green St | 0.74mi | 2/2.0 | 1,246 (-9%) | 1mo | $206,000 | $165 | 45 |
| 423 Barnwell St | 0.39mi | 3/1.0 (+1) | 1,176 (-14%) | 11mo | $188,000 | $160 | 44 |
| 317 Small St | 0.58mi | 3/1.5 (+1) | 1,198 (-13%) | 1mo | $205,000 | $171 | 43 |
| 1107 Sunset Dr | 0.58mi | 3/2.0 (+1) | 1,204 (-12%) | 2mo | $245,000 | $203 | 42 |
| 702 Davidson St | 0.67mi | 3/2.0 (+1) | 1,262 (-8%) | 15mo | $178,000 | $141 | 34 |
| 103 Stone St | 0.75mi | 3/2.0 (+1) | 1,248 (-9%) | 11mo | $254,500 | $204 | 31 |
| 313 W Guilford St | 0.74mi | 3/2.0 (+1) | 1,204 (-12%) | 10mo | $237,000 | $197 | 27 |
Match score weights: distance 35% · size 25% · config 20% · recency 20%. Top-matched comps best support the ARV.
Projected returns pro-forma
-3.0% appreciation · 4.34% rent growth · sell at horizon
- IRR
- 1.7%
- Equity multiple
- 1.06×
- Total profit
- $2,082
- Equity at exit
- $17,147
- IRR
- 12.4%
- Equity multiple
- 2.04×
- Total profit
- $33,360
- Equity at exit
- $9,943
Cash invested: $32,200 (down + closing). Projections, not guarantees.
Landlord ↔ Tenant lean methodology
- Overall (STATE)
- 85 Strongly Landlord-Friendly
- State North Carolina
- 85 Strongly Landlord-Friendly · R+3
- County
- — inherits STATE
- City
- — inherits STATE
ZIP-level market 27360
- Rents YoY
- 4.3%
- Active inventory
- 307
- Price-to-rent
- 7.7×
Monthly cashflow live
- Estimated rent
- $1,249 high interval (Pro) →
- Mortgage (P&I)
- −$603
- Tax from tax record
- −$37 /mo · $442/yr
- Insurance
- −$48
- HOA
- −$0
- Vacancy / Maint / Mgmt
- −$262
- Net cashflow
- $299
Break-even live
UW: 25.0% down · 7.5% · 30yr · 1.5% tax · 5.0% vac · 8.0% maint · 8.0% mgmt
Financing live
Cash to close
- Down payment
- $28,750
- Closing costs
- $3,450
- Reserves months
- —
- Total cash needed
- —
Loan-product check · same deal, 3 products live
Conventional
25% down · 7.5% · 30yr
- Down + closing
- —
- Monthly P&I
- —
- Monthly cashflow
- —
- DSCR
- —
- Eligible?
- —
Personal DTI + credit; lowest rate.
DSCR
20% down · 8.5% · 30yr
- Down + closing
- —
- Monthly P&I
- —
- Monthly cashflow
- —
- DSCR
- —
- Eligible?
- —
No personal income docs; deal must DSCR.
Hard money
10% down · 12.0% · 12mo
- Down + closing
- —
- Monthly P&I
- —
- Monthly cashflow
- —
- DSCR
- —
- Eligible?
- —
Short-term bridge; refi at stabilization.
Rent comps 5 comps
| Address | Beds | Baths | Sqft | Rent | $/sqft | DOM | Units | Dist |
|---|---|---|---|---|---|---|---|---|
| 722 Salem St Thomasville, NC | 2.0–3.0 | 2.0 | 1037 | $900 | $0.87 | 14d | 1 | 0.49mi |
| 200 Charles St Thomasville, NC | 3.0 | 2.0 | 1040 | $1,600 | $1.54 | 14d | 1 | 0.85mi |
| 202 Charles St Thomasville, NC | 3.0 | 2.0 | 990 | $1,500 | $1.52 | 14d | 1 | 0.86mi |
| 406 Fisher Ferry St Thomasville, NC | 2.0 | 2.0 | 1144 | $1,450 | $1.27 | 23d | 1 | 1.44mi |
| 106 Spruce St Thomasville, NC | 3.0 | 2.0 | 1131 | $1,450 | $1.28 | 23d | 1 | 1.48mi |
Listing history 3 events
-
2026-05-06status Pending
-
2026-05-05historical Due Diligence Period
-
2026-05-04$115,000 Active
ⓘ Source: listings_history table (triggers on properties + properties_extension) + one-shot
backfill from property_details.listing_events for pre-trigger history.
Tax reassessment forecast NC · Resets to sale price
- Current annual tax
- $442 · $37/mo
- Projected year-2 tax
- $943 · $79/mo
- Expected delta
- +$501/yr (+$42/mo · 113.5%)
ⓘ Screening estimate from a state-policy table — verify with the county assessor before closing.
Climate risk First Street
- Flood 1/10 Low FEMA zone X (unshaded) · 0% chance over 30 yrs
- Wildfire 3/10 Moderate
- Heat 5/10 Major 7 d/yr ≥103°F today · 17 d/yr by 30 yrs out
- Wind 4/10 Moderate 14% chance of damaging wind over 30 yrs
- Air quality 2/10 Low 1 unhealthy d/yr today · 1 by 30 yrs out
Nearby sold comps map
Loading sold comps map…
Walkable amenities ~0.75 mi
Loading nearby amenities…
Taxation est. · year 1
- Rental income
- $14,993
- − Mortgage interest
- −$6,442
- − Property taxes
- −$442
- − Insurance
- −$575
- − Repairs & maintenance
- −$1,199
- − Management
- −$1,199
- − Depreciation
- −$3,345
- Taxable income
- $1,790
- Est. tax owed @ 24.0%
- −$430
- After-tax cash flow
- $3,161/yr
For passive investors: Depreciation is non-cash, so a rental often shows a tax loss while cash-flowing — sheltering income. Rental losses are passive: they offset passive income freely, and up to $25,000/yr can offset ordinary (W-2) income if you actively participate and your MAGI is under $100k (phasing out to $0 by $150k); unused losses carry forward. On sale, claimed depreciation is recaptured at up to 25%, and gains may owe capital-gains tax (a 1031 exchange can defer both). Figures are a year-1 estimate at your 24.0% rate — not tax advice; consult a CPA.
Schools (NCES district)
- District
- Thomasville City Schools
- NCES district ID
- 3704500
- Math proficiency
- 24% ▲ 1.00%
- Reading proficiency
- 25% ▲ 2.00%
- Median HH income
- $29,831
- Composite
- 19.72/100
- National rank
- #8717
- State rank
- #164 of 178 in NC
Livability — Thomasville
- Score
- 81/100
- State rank
- #16
- US rank
- #1454
Category grades
Schools grade is shown separately in the Schools card above.
Census & demographics
- Census place
- Thomasville, NC
- County
- Davidson County · 129,088 people
- City population
- 49,510
- Metro
- Winston-Salem, NC
- Population (ZIP)
- 49,510
- Household income
- $61,983
- Rent vs Own
- Severe rent burden
- 1052.0
Population outlook (Davidson County) Hauer SSP2
- Today (2025)
- 167,156 people
- By 2030
- 167,216 · +0.0%
- By 2040
- 164,524 · -1.6%
- By 2050
- 157,229 · -5.9%
- By 2075
- 138,084 · -17.4%
- By 2100
- 112,729 · -32.6%
Race, ethnicity, and origin ACS 2023
- Neighborhood character
- Predominantly White (71%)
- Race & ethnicity
- White 71% Hispanic / Latino 11% Black 11% Two or more races 11%
- Hispanic origin (detail)
- Mexican 7%
- Common ancestry
- Slovak 2% Serbian 1% Italian 1%
- Foreign-born
- 7% · Canada
- Languages at home
- 88% English-only · Spanish 10% Other Indo-European 1%
Political lean MEDSL · Davidson
- 2024 margin
- Solid R (+47.1) · D 25.9% · R 73.0% · Other 1.1%
- 2008→2024 swing
- -13.5pp toward R · 2008: -33.5pp · 2024: -47.1pp
- All cycles
- 2024: R+47.1 2020: R+47.5 2016: R+49.4 2012: R+40.9 2008: R+33.5
Not yet ingested
- Civics
- —
Market trends
- HPI YoY
- ▼ -146.33%
- Current HPI
- 243.0953
- Rent YoY
- ▲ 4.34%
- Metro
- Winston-Salem, NC
- State GDP YoY
- ▲ 3.28%
- F500 in state
- 26
Industry mix (Fortune 500 HQ in NC)
| Industry | F500 HQs | Revenue |
|---|---|---|
| Financial Services | 2 | $213B |
|
||
| Retail | 2 | $95B |
|
||
| Industrial Conglomerate | 1 | $38B |
|
||
| Metals / Steel | 1 | $35B |
|
||
| Utilities | 1 | $30B |
|
||
| Industrial Machinery | 1 | $19B |
|
||
Price history
3 events — show timeline
- 2026-05-06 Pending — Triad MLS
- 2026-05-05 Contingent — Triad MLS
- 2026-05-04 Listed $115,000 Triad MLS
Property tax history
+0.5%/yrLatest (2025): $442 · +0.0% YoY. Source: county tax records.
Cash-flow waterfall
monthlySold comps — $/sqft
last 12 mo · ≤1 miLoading sold comps…