 Duplex
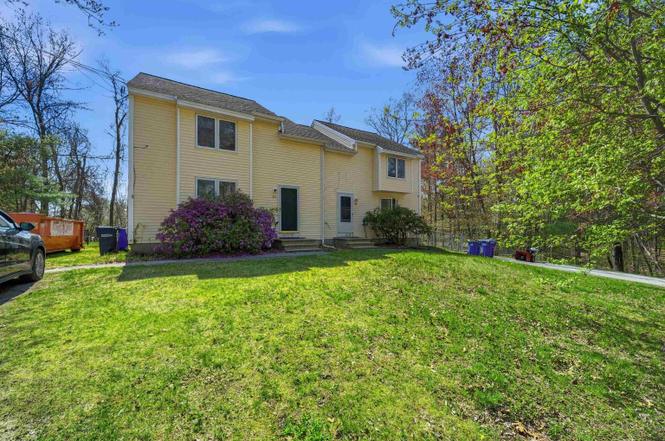
2 Shingle Mill Rd · Hudson, NH
Flood risk 1/10 · Minimal
- FEMA flood zone
- X (unshaded)
- Chance of flooding over 30 yrs
- 0.0%
- Est. flood insurance / yr
- $473 – $860
Fire risk 2/10 · Minimal
- Est. fire insurance / yr
- $507 – $941
Heat risk 4/10 · Minor
- Hot days now (above 96°F)
- 7 days/yr
- Hot days in 30 yrs
- 14 days/yr
Wind risk 5/10 · Moderate
- Chance of severe wind over 30 yrs
- 26.0%
Air-quality risk 2/10 · Minimal
- Unhealthy air days now
- 2 days/yr
- Unhealthy air days in 30 yrs
- 2 days/yr
Risk factors via First Street. Map © Google.
Why this score? — see what drove the D grade
The composite is a weighted blend of 9 inputs, each scored 0–100. Each bar is that input's sub-score; the figure is the points it added to the 100-point composite (weight × sub-score).
- Cash flow +12.6/30.0
- ARV discount +7.5/15.0
- Livability +4.2/5.0
- Schools +4.1/10.0
- DSCR +3.8/10.0
- 1% rule +3.1/10.0
- Rent growth +2.5/5.0
- Condition / age +2.5/5.0
- Appreciation +0.0/10.0
$750,000
🖨 Deal sheet (PDF) 📄 Offer letter ✓ Due diligence
Multi-family units
County records classify this as Multi-Family (2-4 Unit). Listing-text estimate: 2 units. confirmed
Listing remarks
Exceptional opportunity to own a spacious duplex at 2 Shingle Mill Road in Hudson, NH, offering the perfect combination of owner-occupancy potential, investment value, and long-term flexibility. Situated on over an acre corner lot on a quiet dead-end street just off of Barretts Hill Road, this property provides a rare blend of privacy, outdoor space, and convenience. Each unit features 3 bedrooms and 1.5 bathrooms, including a full bath and a half bath, with functional floor plans designed for comfortable everyday living. Inside, you'll find a mix of carpeting, laminate flooring, and luxury vinyl plank flooring, creating warm and inviting spaces ready for your personal touch. Large living a
Key facts
- Private driveway
- Outdoor space
- Fenced backyard
Tags
Property features AI
Exterior
- Parking: Paved driveway
- Utilities: Drilled well water; Septic / leach field sewer; 100 Amp electric; Internet: cable and fiber available; Other utilities
- Home design: Colonial duplex; Existing construction; Yellow exterior (vinyl siding)
- Construction: Built in 1980; Vinyl siding; Asphalt shingle roof
- Exterior features: Corner lot; Landscaped yard; Neighborhood setting; Paved driveway
Interior
- Bedrooms: Two 3+ bedroom units (multi-unit property)
- Flooring: Carpet; Laminate; Vinyl plank; Wood
- Bathrooms: Two full bathrooms (total for property)
- Heating & cooling: Oil heating with baseboard units; No central cooling
- Interior features: Basement with walkout access, bulkhead and storage space; Carpet, laminate, vinyl plank and wood flooring
Neighborhood map
What this means for you Summary
Snapshot
- This is a 2 × 3.0-bed/1.5-bath units multifamily listed at $750k.
Deal economics
- At list price, monthly cash flow is $-94 ($-1k/yr) — negative. Per door: $-47/mo.
- To cash-flow at today's rent, offer at most $733k (2.2% below list).
- To meet the 1% rule (rent ≥ 1% of price), the offer needs to be $606k (19.2% below list).
- Recommended offer: $606k (19.2% below list) — sets the bar for 1% rule.
- Cap rate 6.1% vs local median 3.0% in Hudson — top-decile yield for the area; either an underpriced asset or a hidden risk that comps aren't pricing in. Stress-test before assuming the spread holds.
Location & tenants
- Location reads 84/100 on livability (#9 in NH, #787 nationally) — a professional / high-income tenant draw. Strengths: crime A+, housing A+, health & safety A+; Watch: commute F.
- Hudson School District (suburban): math 38% / reading 50% proficiency, ranked #48 of 98 in NH (top 49%) — families likely to look elsewhere, expect single-tenant / working-renter base with shorter leases; only 13% free/reduced lunch — higher-income household profile.
- Zoned schools: Hills Garrison Elementary School (math 55% / reading 58%, grade C+, #59 of 263 statewide, top 22%, 383 students, 19% FRL).
- Zoned-school proficiency averages 56% at this address vs 44% district-wide (+12 pts) — the actual schools serving this property are materially stronger than the Hudson School District average implies; a family-tenant draw the district grade alone would hide.
- Market conditions: 78 active listings in the ZIP; high-income renter base; 981 units permitted in Hillsborough County in 2024 (381 in 5+ unit buildings).
- At $6,061/mo this rent would consume 59% of the median local household income ($124k/yr) (locally 238% of renters already pay >50% of income on rent) — very limited rent-growth headroom before tenants either downsize or default.
Forward outlook
- Local home prices are declining (-3.0%/yr); year-one equity from $5k of loan paydown is wiped out by about $22k of value loss. Plan a longer hold.
- Hillsborough County population projected to shrink 8% by 2050 — rents likely to lag national; underwrite the cash flow, not the appreciation.
Negotiation context
- Only 1 days on market — expect competitive offers; lowballing is unlikely to land.
Risks & watch-outs
- Climate carrying-cost: moderate wind risk, 26% chance of damaging wind over 30y — expect insurance premiums to compound above CPI over the hold.
Questions for the listing agent
- What do current leases actually rent for vs. the listed asking? Can we see a recent rent roll and the last 12 months of T-12 income?
- Can we see the unit-by-unit rent roll, current vacancy, and any below-market leases? What's the average tenancy length?
- What capital expenditures (roof, boiler, parking lot, exteriors) have been made in the last 5 years, and what's planned in the next 2?
- Is there a deadline driving the sale (1031 exchange, divorce, estate, relocation)? That informs how much negotiation room exists.
- The area grade is low — what's the realistic commute time and amenity access for the typical tenant pool here? Any planned neighborhood developments (good or bad) we should know about?
- What's the average days-on-market for RENTAL listings here right now (not sales)? A rising rental-DOM trend means longer vacancies and softer asking-rent achievability than the comps imply.
- What's the recent tenant-quality profile in this submarket — average credit score on applications, eviction rate, late-payment / NSF rate, and stable-employment percentage? A property-management company in the area should have these aggregated.
- How much new apartment / multifamily construction is in the pipeline within 1–3 miles? Heavy new supply (>2% of stock underway) typically softens rents 12–24 months out; light construction supports rent growth.
Investment metrics
- 1% rule
- 0.81% ✗
- Cap rate
- 6.14%
- Cash-on-cash
- -0.54%
- DSCR
- 0.98
- GRM
- 10.3
CMA / ARV
No comps found within radius.
Projected returns pro-forma
-3.0% appreciation · 3.0% rent growth · sell at horizon
- IRR
- -17.2%
- Equity multiple
- 0.39×
- Total profit
- $-127,632
- Equity at exit
- $111,827
- IRR
- -9.2%
- Equity multiple
- 0.43×
- Total profit
- $-119,253
- Equity at exit
- $64,846
Cash invested: $210,000 (down + closing). Projections, not guarantees.
Landlord ↔ Tenant lean methodology
- Overall (STATE)
- 56 Moderately Landlord-Leaning
- State New Hampshire
- 56 Moderately Landlord-Leaning · D+1
- County
- — inherits STATE
- City
- — inherits STATE
ZIP-level market 03051
- Active inventory
- 78
- Price-to-rent
- 20.6×
Monthly cashflow live
- Estimated rent
- $6,061 medium interval (Pro) →
- Mortgage (P&I)
- −$3,933
- Tax from tax record
- −$637 /mo · $7,643/yr
- Insurance
- −$312
- HOA
- −$0
- Vacancy / Maint / Mgmt
- −$1,273
- Net cashflow
- $-94
Break-even live
Sensitivity live
| Price | -10% $330 | -5% $118 | +0% $-94 | +5% $-307 | +10% $-519 |
|---|---|---|---|---|---|
| Rent | -10% $-573 | -5% $-334 | +0% $-94 | +5% $145 | +10% $385 |
| Rate | -1.0pp $283 | -0.5pp $96 | base $-94 | +0.5pp $-289 | +1.0pp $-486 |
2-unit breakdown (identical units grouped — click to expand)
| Units | Beds | Baths | Est. rent |
|---|---|---|---|
| 2× units | 3.0 | 1.5 | $6,060 |
| #1 | 3.0 | 1.5 | $3,030 |
| #2 | 3.0 | 1.5 | $3,030 |
| Total (2 units) | $6,061 | ||
UW: 25.0% down · 7.5% · 30yr · 1.5% tax · 5.0% vac · 8.0% maint · 8.0% mgmt
Financing live
Cash to close
- Down payment
- $187,500
- Closing costs
- $22,500
- Reserves months
- —
- Total cash needed
- —
Loan-product check · same deal, 3 products live
Conventional
25% down · 7.5% · 30yr
- Down + closing
- —
- Monthly P&I
- —
- Monthly cashflow
- —
- DSCR
- —
- Eligible?
- —
Personal DTI + credit; lowest rate.
DSCR
20% down · 8.5% · 30yr
- Down + closing
- —
- Monthly P&I
- —
- Monthly cashflow
- —
- DSCR
- —
- Eligible?
- —
No personal income docs; deal must DSCR.
Hard money
10% down · 12.0% · 12mo
- Down + closing
- —
- Monthly P&I
- —
- Monthly cashflow
- —
- DSCR
- —
- Eligible?
- —
Short-term bridge; refi at stabilization.
Listing history 6 events
-
2026-06-17statusdays on market $750,000 Active 1 DOM
-
2026-06-16days on market $750,000 Coming Soon 5 DOM
-
2026-06-15days on market $750,000 Coming Soon 4 DOM
-
2026-06-14days on market $750,000 Coming Soon 2 DOM
-
2026-06-13remarks 699-char remark
-
2026-06-13$750,000 Coming Soon 1 DOM
ⓘ Source: listings_history table (triggers on properties + properties_extension) + one-shot
backfill from property_details.listing_events for pre-trigger history.
Tax reassessment forecast NH · Partial reset (capped growth)
- Current annual tax
- $7,643 · $637/mo
- Projected year-2 tax
- $11,996 · $1,000/mo
- Expected delta
- +$4,354/yr (+$363/mo · 57.0%)
ⓘ Screening estimate from a state-policy table — verify with the county assessor before closing.
Climate risk First Street
- Flood 1/10 Low FEMA zone X (unshaded) · 0% chance over 30 yrs
- Wildfire 2/10 Low
- Heat 4/10 Moderate 7 d/yr ≥96°F today · 14 d/yr by 30 yrs out
- Wind 5/10 Major 26% chance of damaging wind over 30 yrs
- Air quality 2/10 Low 2 unhealthy d/yr today · 2 by 30 yrs out
Nearby sold comps map
Loading sold comps map…
Walkable amenities ~0.75 mi
Loading nearby amenities…
Taxation est. · year 1
- Rental income
- $72,732
- − Mortgage interest
- −$42,012
- − Property taxes
- −$7,643
- − Insurance
- −$3,750
- − Repairs & maintenance
- −$5,819
- − Management
- −$5,819
- − Depreciation
- −$21,818
- Taxable loss
- −$14,128
- Est. tax savings @ 24.0%
- +$3,391
- After-tax cash flow
- $2,259/yr
For passive investors: Depreciation is non-cash, so a rental often shows a tax loss while cash-flowing — sheltering income. Rental losses are passive: they offset passive income freely, and up to $25,000/yr can offset ordinary (W-2) income if you actively participate and your MAGI is under $100k (phasing out to $0 by $150k); unused losses carry forward. On sale, claimed depreciation is recaptured at up to 25%, and gains may owe capital-gains tax (a 1031 exchange can defer both). Figures are a year-1 estimate at your 24.0% rate — not tax advice; consult a CPA.
Schools (NCES district)
- District
- Hudson School District
- NCES district ID
- 3303930
- Math proficiency
- 38% ▼ -7.00%
- Reading proficiency
- 50% ▼ -3.00%
- Median HH income
- $85,941
- Composite
- 41.2/100
- National rank
- #3542
- State rank
- #48 of 98 in NH
Livability — Hudson
- Score
- 84/100
- State rank
- #9
- US rank
- #787
Category grades
Schools grade is shown separately in the Schools card above.
Census & demographics
- County
- Hillsborough County · 309,362 people
- City population
- 25,557
- Metro
- Manchester-Nashua, NH
- Population (ZIP)
- 25,557
- Household income
- $124,213
- Rent vs Own
- Severe rent burden
- 238.0
Population outlook (Hillsborough County) Hauer SSP2
- Today (2025)
- 412,771 people
- By 2030
- 410,974 · -0.4%
- By 2040
- 399,959 · -3.1%
- By 2050
- 381,542 · -7.6%
- By 2075
- 339,855 · -17.7%
- By 2100
- 289,270 · -29.9%
Race, ethnicity, and origin ACS 2023
- Neighborhood character
- Predominantly White (88%)
- Race & ethnicity
- White 88% Two or more races 4% Hispanic / Latino 3% Asian 2% Black 2%
- Common ancestry
- Lithuanian 14% Romanian 5% Russian 3%
- Foreign-born
- 6% · Canada, China
- Languages at home
- 91% English-only · French/Haitian/Cajun 2% Spanish 2% Other Indo-European 2%
Political lean MEDSL · Hillsborough
- 2024 margin
- Toss-up / Even · D 50.9% · R 48.0% · Other 1.0%
- 2008→2024 swing
- -0.9pp no change · 2008: 3.8pp · 2024: 2.9pp
- All cycles
- 2024: D+2.9 2020: D+7.7 2016: R+0.2 2012: D+1.7 2008: D+3.8
Not yet ingested
- Civics
- —
Market trends
- HPI YoY
- ▼ -293.22%
- Current HPI
- 304.4557
- Rent YoY
- —
- Metro
- Manchester-Nashua, NH
- State GDP YoY
- —
- F500 in state
- 0
Price history
1 event — show timeline
- 2026-06-11 Coming Soon $750,000 PrimeMLS
Property tax history
+4.4%/yrLatest (2025): $7,643 · +4.0% YoY. Source: county tax records.
Cash-flow waterfall
monthlySold comps — $/sqft
last 12 mo · ≤1 miLoading sold comps…