10240 Lawrence 1000 · La Russell, MO
Flood risk 1/10 · Minimal
- FEMA flood zone
- X (unshaded)
- Chance of flooding over 30 yrs
- 0.0%
- Est. flood insurance / yr
- $507 – $1,088
Fire risk 4/10 · Minor
- Est. fire insurance / yr
- $1,054 – $1,958
Heat risk 5/10 · Moderate
- Hot days now (above 105°F)
- 7 days/yr
- Hot days in 30 yrs
- 19 days/yr
Wind risk 2/10 · Minimal
- Chance of severe wind over 30 yrs
- 2.0%
Air-quality risk 2/10 · Minimal
- Unhealthy air days now
- 0 days/yr
- Unhealthy air days in 30 yrs
- 1 days/yr
Risk factors via First Street. Map © Google.
Why this score? — see what drove the C- grade
The composite is a weighted blend of 9 inputs, each scored 0–100. Each bar is that input's sub-score; the figure is the points it added to the 100-point composite (weight × sub-score).
- ARV discount +15.0/15.0
- Cash flow +14.5/30.0
- Appreciation +6.7/10.0
- DSCR +4.4/10.0
- 1% rule +2.7/10.0
- Schools +2.6/10.0
- Livability +2.6/5.0
- Rent growth +2.5/5.0
- Condition / age +2.5/5.0
$155,000
🖨 Deal sheet 📄 Offer letter ✓ Due diligence
Listing remarks MLS
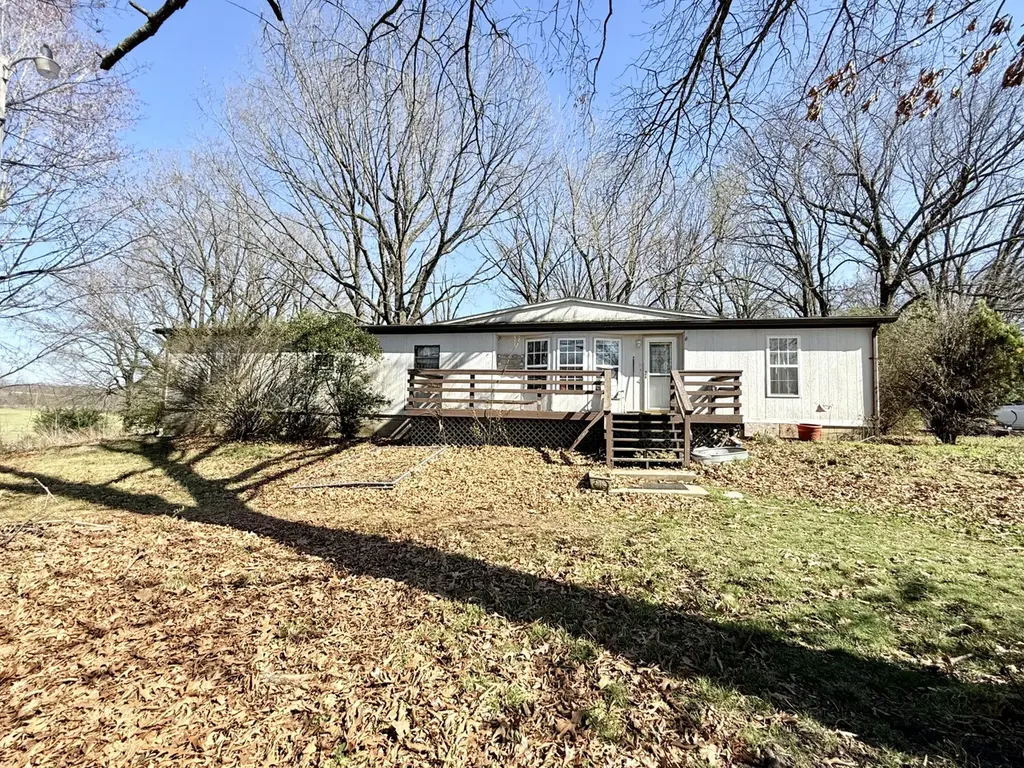
3 Bedroom, 2 Bathroom Residence Spanning 1785 sq ft on 1.38 Acres 10240 Lawrence 1000, La Russell, MO 64848. Discover serene country living on 1.38 acres with a spacious manufactured home featuring The open layout of a spacious living room, kitchen with dining area and bar, and two decks ideal for relaxation, surrounded by peaceful surroundings and picturesque country views.
Key facts
- Open layout
- Two decks
- 1 acre lot
Tags
Property features AI
Exterior
- Parking: Driveway
- Home design: Manufactured house; Single-family residence, freestanding
- Construction: Block foundation
- Exterior features: Composition roof; Lot about 1.38 acres
Interior
- Flooring: Vinyl
- Bathrooms: 2 full bathrooms
- Heating & cooling: Electric central heating; Has cooling
- Interior features: Vinyl flooring; 4 total rooms
Neighborhood map
What this means for you Summary
Snapshot
- This is a 3-bed/1.0-bath manufactured listed at $155k.
Deal economics
- At list price, monthly cash flow is $35 ($417/yr) — positive.
- The deal already cash-flows at list — no discount required.
- To meet the 1% rule (rent ≥ 1% of price), the offer needs to be $119k (23.0% below list).
- Recommended offer: $119k (23.0% below list) — sets the bar for 1% rule.
Location & tenants
- Location reads 51/100 on livability (#871 in MO) — a working-class tenant base; expect higher turnover. Strengths: cost of living A+; Watch: housing D+, schools D-, crime F.
- Sarcoxie R-II (rural): math 30% / reading 32% proficiency, ranked #265 of 324 in MO (top 82%) — families likely to look elsewhere, expect single-tenant / working-renter base with shorter leases.
- Market conditions: 5 active listings in the ZIP; 67 units permitted in Lawrence County in 2024 (35 in 5+ unit buildings).
Forward outlook
- In year one you build about $6k of equity ($1k loan paydown + $5k appreciation (3.3% local appreciation)).
- Lawrence County population projected at -15% by 2050 — secular population decline; favor cash flow + early exit over multi-decade hold.
- At projected returns (3.3% appreciation + 3.0% rent growth), your $43k cash investment doubles in ~6 years — after that, you're playing with house money.
- By year 6, paydown + projected appreciation supports a ~$33k cash-out refi (75% LTV) — recoverable capital for the next deal without selling this one.
Negotiation context
- It's been on market 55 days — a 3% lower offer ($150k) is reasonable based on typical stale-listing flexibility.
- 6 sale attempts since 12y ago; this cycle's ask has dropped $20k (11%) from the opening price — seller is motivated, your offer sets the floor, not the list.
Risks & watch-outs
- Climate carrying-cost: extreme-heat days projected 7→19/yr by 2055 (HVAC capex compounding) — expect insurance premiums to compound above CPI over the hold.
Questions for the listing agent
- It's been on market 55 days. Have you received any prior offers? Is the seller open to a 23% concession, seller financing, or rate buy-down credit?
- Is there a deadline driving the sale (1031 exchange, divorce, estate, relocation)? That informs how much negotiation room exists.
- Schools are D-rated, which usually means shorter tenancies and higher turnover. Who's the typical renter profile here, and what's been the actual vacancy rate?
- Crime grade is F in this area — have there been break-ins, vandalism, or insurance claims at this property in the last 3 years? What carrier currently insures it and at what premium?
- What's the average days-on-market for RENTAL listings here right now (not sales)? A rising rental-DOM trend means longer vacancies and softer asking-rent achievability than the comps imply.
- What's the recent tenant-quality profile in this submarket — average credit score on applications, eviction rate, late-payment / NSF rate, and stable-employment percentage? A property-management company in the area should have these aggregated.
- How much new for-sale + rental construction is in the pipeline within 1–3 miles? Heavy new supply typically softens prices + rents 12–24 months out; constrained supply supports both.
Investment metrics
- 1% rule
- 0.77% ✗
- Cap rate
- 6.56%
- Cash-on-cash
- 0.96%
- DSCR
- 1.04
- GRM
- 10.8
CMA / ARV
- ARV (median comp)
- $278,597
- List price
- $155,000
- Delta
- -44.36%
- Verdict
- UNDERPRICED
- Comps
- 2 within 2.0 mi
Projected returns pro-forma
3.33% appreciation · 3.0% rent growth · sell at horizon
- IRR
- 9.3%
- Equity multiple
- 1.54×
- Total profit
- $23,542
- Equity at exit
- $72,607
- IRR
- 11.5%
- Equity multiple
- 2.78×
- Total profit
- $77,267
- Equity at exit
- $114,214
Cash invested: $43,400 (down + closing). Projections, not guarantees.
Landlord ↔ Tenant lean methodology
- Overall (STATE)
- 81 Strongly Landlord-Friendly
- State Missouri
- 81 Strongly Landlord-Friendly · R+10
- County
- — inherits STATE
- City
- — inherits STATE
ZIP-level market 64848
- Home prices YoY
- 1.9%
- Active inventory
- 5
- Price-to-rent
- 10.8×
Monthly cashflow live
- Estimated rent
- $1,193 medium interval (Pro) →
- Mortgage (P&I)
- −$813
- Tax from tax record
- −$30 /mo · $364/yr
- Insurance
- −$65
- HOA
- −$0
- Vacancy / Maint / Mgmt
- −$251
- Net cashflow
- $35
Break-even live
UW: 25.0% down · 7.5% · 30yr · 1.5% tax · 5.0% vac · 8.0% maint · 8.0% mgmt
Financing live
Cash to close
- Down payment
- $38,750
- Closing costs
- $4,650
- Reserves months
- —
- Total cash needed
- —
Loan-product check · same deal, 3 products live
Conventional
25% down · 7.5% · 30yr
- Down + closing
- —
- Monthly P&I
- —
- Monthly cashflow
- —
- DSCR
- —
- Eligible?
- —
Personal DTI + credit; lowest rate.
DSCR
20% down · 8.5% · 30yr
- Down + closing
- —
- Monthly P&I
- —
- Monthly cashflow
- —
- DSCR
- —
- Eligible?
- —
No personal income docs; deal must DSCR.
Hard money
10% down · 12.0% · 12mo
- Down + closing
- —
- Monthly P&I
- —
- Monthly cashflow
- —
- DSCR
- —
- Eligible?
- —
Short-term bridge; refi at stabilization.
Listing history 28 events
-
2026-06-19days on market $155,000 Active 55 DOM
-
2026-06-18days on market $155,000 Active 54 DOM
-
2026-06-17days on market $155,000 Active 53 DOM
-
2026-06-16days on market $155,000 Active 52 DOM
-
2026-06-15days on market $155,000 Active 51 DOM
-
2026-06-14days on market $155,000 Active 49 DOM
-
2026-06-13days on market $155,000 Active 48 DOM
-
2026-06-10days on market $155,000 Active 46 DOM
-
2026-06-09days on market $155,000 Active 45 DOM
-
2026-06-08days on market $155,000 Active 44 DOM
-
2026-06-07days on market $155,000 Active 43 DOM
-
2026-06-05days on market $155,000 Active 40 DOM
-
2026-06-03days on market $155,000 Active 39 DOM
-
2026-06-02days on market $155,000 Active 38 DOM
-
2026-06-01days on market $155,000 Active 37 DOM
-
2026-05-31days on market $155,000 Active 36 DOM
-
2026-05-30days on market $155,000 Active 35 DOM
-
2026-04-26$175,000 Active 377-char remark
Show marketing remark (377 chars)
3 Bedroom, 2 Bathroom Residence Spanning 1785 sq ft on 1.38 Acres 10240 Lawrence 1000, La Russell, MO 64848. Discover serene country living on 1.38 acres with a spacious manufactured home featuring The open layout of a spacious living room, kitchen with dining area and bar, and two decks ideal for relaxation, surrounded by peaceful surroundings and picturesque country views.
-
2026-03-16$179,000 Active
-
2021-08-19soldstatus
-
2021-08-16soldstatus
-
2021-08-16soldstatus
-
2021-04-23$127,900
-
2021-04-21$127,900
-
2015-07-24soldstatus
-
2015-07-23soldstatus
-
2014-10-03$64,900
ⓘ Source: listings_history table (triggers on properties + properties_extension) + one-shot
backfill from property_details.listing_events for pre-trigger history.
Tax reassessment forecast MO · Resets to sale price
- Current annual tax
- $364 · $30/mo
- Projected year-2 tax
- $1,504 · $125/mo
- Expected delta
- +$1,140/yr (+$95/mo · 313.1%)
ⓘ Screening estimate from a state-policy table — verify with the county assessor before closing.
Climate risk First Street
- Flood 1/10 Low FEMA zone X (unshaded) · 0% chance over 30 yrs
- Wildfire 4/10 Moderate
- Heat 5/10 Major 7 d/yr ≥105°F today · 19 d/yr by 30 yrs out
- Wind 2/10 Low 2% chance of damaging wind over 30 yrs
- Air quality 2/10 Low 0 unhealthy d/yr today · 1 by 30 yrs out
Nearby sold comps map
Loading sold comps map…
Walkable amenities ~0.75 mi
Loading nearby amenities…
Taxation est. · year 1
- Rental income
- $14,317
- − Mortgage interest
- −$8,682
- − Property taxes
- −$364
- − Insurance
- −$775
- − Repairs & maintenance
- −$1,145
- − Management
- −$1,145
- − Depreciation
- −$4,509
- Taxable loss
- −$2,304
- Est. tax savings @ 24.0%
- +$553
- After-tax cash flow
- $970/yr
For passive investors: Depreciation is non-cash, so a rental often shows a tax loss while cash-flowing — sheltering income. Rental losses are passive: they offset passive income freely, and up to $25,000/yr can offset ordinary (W-2) income if you actively participate and your MAGI is under $100k (phasing out to $0 by $150k); unused losses carry forward. On sale, claimed depreciation is recaptured at up to 25%, and gains may owe capital-gains tax (a 1031 exchange can defer both). Figures are a year-1 estimate at your 24.0% rate — not tax advice; consult a CPA.
Schools (NCES district)
- District
- Sarcoxie R-II
- NCES district ID
- 2927540
- Math proficiency
- 30% ▼ -2.00%
- Reading proficiency
- 32% ▼ -13.00%
- Median HH income
- $38,365
- Composite
- 25.92/100
- National rank
- #7337
- State rank
- #265 of 324 in MO
Livability — La Russell
- Score
- 51/100
- State rank
- #871
- US rank
- #25195
Category grades
Schools grade is shown separately in the Schools card above.
Census & demographics
- Population (ZIP)
- 692
Population outlook (Lawrence County) Hauer SSP2
- Today (2025)
- 37,142 people
- By 2030
- 36,212 · -2.5%
- By 2040
- 34,080 · -8.2%
- By 2050
- 31,621 · -14.9%
- By 2075
- 25,987 · -30.0%
- By 2100
- 20,151 · -45.7%
Race, ethnicity, and origin ACS 2023
- Neighborhood character
- Predominantly White (100%)
- Race & ethnicity
- White 100%
- Common ancestry
- Serbian 5% Slovak 1%
- Languages at home
- 58% English-only · German/W. Germanic 42%
Political lean MEDSL · Lawrence
- 2024 margin
- Solid R (+63.8) · D 17.6% · R 81.5%
- 2008→2024 swing
- -26.8pp toward R · 2008: -37.1pp · 2024: -63.8pp
- All cycles
- 2024: R+63.8 2020: R+62.6 2016: R+61.1 2012: R+47.0 2008: R+37.1
Not yet ingested
- Civics
- —
Market trends
- HPI YoY
- ▲ 3.33%
- Current HPI
- 181.4892
- Rent YoY
- —
- Metro
- —
- State GDP YoY
- ▲ 1.84%
- F500 in state
- 20
Industry mix (Fortune 500 HQ in MO)
| Industry | F500 HQs | Revenue |
|---|---|---|
| Healthcare | 1 | $163B |
|
||
| Insurance | 1 | $21B |
|
||
| Industrial Technology | 1 | $17B |
|
||
| Retail | 1 | $16B |
|
||
| Industrial Distribution | 1 | $10B |
|
||
| Utilities | 1 | $9B |
|
||
Price history
+138.8% since first listed13 events — show timeline
- 2026-05-21 Price Changed $155,000 SOMO
- 2026-05-21 Price Changed $155,000 OGAR
- 2026-04-26 Listed $175,000 SOMO
- 2026-04-26 Listed $175,000 OGAR
- 2026-03-16 Listed $179,000 SOMO
- 2021-08-19 Sold (Public Records) — Public Records
- 2021-08-16 Sold (MLS) — SOMO
- 2021-08-16 Sold (MLS) — OGAR
- 2021-04-23 Listed $127,900 SOMO
- 2021-04-21 Listed $127,900 OGAR
- 2015-07-24 Sold (Public Records) — Public Records
- 2015-07-23 Sold (MLS) — OGAR
- 2014-10-03 Listed $64,900 OGAR
Property tax history
+0.2%/yrLatest (2025): $364 · -4.6% YoY. Source: county tax records.
Cash-flow waterfall
monthlySold comps — $/sqft
last 12 mo · ≤1 miLoading sold comps…