 Multi-family
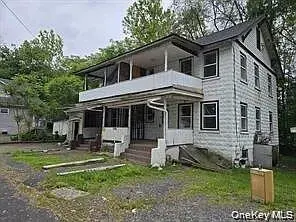
19 Tyrone Thomas Ln · Ellenville, NY
Flood risk 9/10 · Severe
- FEMA flood zone
- X (unshaded)
- Chance of flooding over 30 yrs
- 0.99%
- Est. flood insurance / yr
- $473 – $860
Fire risk 2/10 · Minimal
- Est. fire insurance / yr
- $691 – $1,283
Heat risk 4/10 · Minor
- Hot days now (above 89°F)
- 9 days/yr
- Hot days in 30 yrs
- 20 days/yr
Wind risk 3/10 · Minor
- Chance of severe wind over 30 yrs
- 6.0%
Air-quality risk 2/10 · Minimal
- Unhealthy air days now
- 1 days/yr
- Unhealthy air days in 30 yrs
- 1 days/yr
Risk factors via First Street. Map © Google.
Why this score? — see what drove the D+ grade
The composite is a weighted blend of 9 inputs, each scored 0–100. Each bar is that input's sub-score; the figure is the points it added to the 100-point composite (weight × sub-score).
- ARV discount +15.0/15.0
- Appreciation +10.0/10.0
- Cash flow +7.9/30.0
- Schools +3.3/10.0
- Livability +3.0/5.0
- Rent growth +2.5/5.0
- Condition / age +2.5/5.0
- DSCR +1.9/10.0
- 1% rule +1.7/10.0
$299,000
🖨 Deal sheet 📄 Offer letter ✓ Due diligence
Multi-family units
County records classify this as Multi-Family (2-4 Unit). Listing-text estimate: 1 unit. estimate disagrees with records
Listing remarks MLS
Investor opportunity or renovation-ready home! This classic two-story property offers a spacious layout with generous room sizes. Features include a large covered front porch, wood flooring, and a comfortable flow between living and kitchen areas.
Key facts
- Wood flooring
- 4,792 sq ft lot
- Built 1902
Tags
Neighborhood map
What this means for you Summary
Snapshot
- This is a 4-bed/2.0-bath multifamily listed at $299k.
Deal economics
- At list price, monthly cash flow is $-378 ($-5k/yr) — negative.
- To cash-flow at today's rent, offer at most $232k (22.3% below list).
- To meet the 1% rule (rent ≥ 1% of price), the offer needs to be $200k (33.1% below list).
- Recommended offer: $200k (33.1% below list) — sets the bar for 1% rule.
- Cap rate 5.0% vs local median 3.8% in Ellenville — top-decile yield for the area; either an underpriced asset or a hidden risk that comps aren't pricing in. Stress-test before assuming the spread holds.
Location & tenants
- Location reads 60/100 on livability (#961 in NY) — a middle-class / working-renter tenant base. Strengths: cost of living A, housing A-; Watch: crime C-, schools D-, amenities F.
- Ellenville Central School District (town): math 32% / reading 46% proficiency, ranked #534 of 590 in NY (top 90%) — families likely to look elsewhere, expect single-tenant / working-renter base with shorter leases.
- Market conditions: 70 active listings in the ZIP; 1 comparable units currently listed for rent nearby; 464 units permitted in Ulster County in 2024 (170 in 5+ unit buildings).
Forward outlook
- In year one you build about $32k of equity ($2k loan paydown + $30k appreciation (10.0% local appreciation)).
- Ulster County population projected at -14% by 2050 — secular population decline; favor cash flow + early exit over multi-decade hold.
- By year 2, paydown + projected appreciation supports a ~$51k cash-out refi (75% LTV) — recoverable capital for the next deal without selling this one.
Negotiation context
- It's been on market 40 days — a 3% lower offer ($290k) is reasonable based on typical stale-listing flexibility.
- 10 sale attempts since 7y ago with the ask held roughly flat each time — persistent listings suggest the price (not the market) is what's stuck; bring a comps-based counter.
Risks & watch-outs
- Watch-outs: flood insurance adds $56/mo; built in 1902 — expect roof / HVAC / electrical / plumbing capex.
- Climate carrying-cost: severe flood risk — expect insurance premiums to compound above CPI over the hold.
Questions for the listing agent
- What do current leases actually rent for vs. the listed asking? Can we see a recent rent roll and the last 12 months of T-12 income?
- It's been on market 40 days. Have you received any prior offers? Is the seller open to a 33% concession, seller financing, or rate buy-down credit?
- Built in 1902 — when were the roof, HVAC, electrical panel, plumbing, and water heater last replaced?
- What's the actual annual flood-insurance premium (NFIP or private), and is the property in a SFHA with mandatory coverage?
- Is there a deadline driving the sale (1031 exchange, divorce, estate, relocation)? That informs how much negotiation room exists.
- Schools are D-rated, which usually means shorter tenancies and higher turnover. Who's the typical renter profile here, and what's been the actual vacancy rate?
- The area grade is low — what's the realistic commute time and amenity access for the typical tenant pool here? Any planned neighborhood developments (good or bad) we should know about?
- What's the average days-on-market for RENTAL listings here right now (not sales)? A rising rental-DOM trend means longer vacancies and softer asking-rent achievability than the comps imply.
- What's the recent tenant-quality profile in this submarket — average credit score on applications, eviction rate, late-payment / NSF rate, and stable-employment percentage? A property-management company in the area should have these aggregated.
- How much new apartment / multifamily construction is in the pipeline within 1–3 miles? Heavy new supply (>2% of stock underway) typically softens rents 12–24 months out; light construction supports rent growth.
Investment metrics
- 1% rule
- 0.67% ✗
- Cap rate
- 5.00%
- Cash-on-cash
- -4.62%
- DSCR
- 0.79
- GRM
- 12.5
CMA / ARV
- ARV (median comp)
- $507,236
- List price
- $299,000
- Delta
- -41.05%
- Verdict
- UNDERPRICED
- Comps
- 20 within 1.0 mi
Show comp detail 6 sales within ~0.75 mi
| Address | Dist | Beds/Ba | Sqft | Sold | Price | $/sf | Match |
|---|---|---|---|---|---|---|---|
| 5 Park St | 0.59mi | 4/2.0 | 2,140 (+1%) | 2mo | $275,000 | $129 | 70 |
| 244 Canal St | 0.21mi | 5/3.0 (+1) | 1,936 (-9%) | 1mo | $354,998 | $183 | 65 |
| 6 Park St | 0.57mi | 4/2.0 | 2,208 (+4%) | 8mo | $355,000 | $161 | 61 |
| 129 Center St | 0.19mi | 4/2.0 | 1,934 (-9%) | 22mo | $210,000 | $109 | 57 |
| 15 Essex St #2 | 0.42mi | 4/3.5 | 2,000 (-6%) | 13mo | $330,000 | $165 | 54 |
| 49 Warren St | 0.32mi | 5/3.0 (+1) | 2,000 (-6%) | 19mo | $402,000 | $201 | 50 |
Match score weights: distance 35% · size 25% · config 20% · recency 20%. Top-matched comps best support the ARV.
Projected returns pro-forma
10.0% appreciation · 3.0% rent growth · sell at horizon
- IRR
- 20.4%
- Equity multiple
- 2.66×
- Total profit
- $138,754
- Equity at exit
- $269,363
- IRR
- 18.6%
- Equity multiple
- 6.11×
- Total profit
- $427,450
- Equity at exit
- $580,891
Cash invested: $83,720 (down + closing). Projections, not guarantees.
Landlord ↔ Tenant lean methodology
- Overall (STATE)
- 15 Strongly Tenant-Friendly
- State New York
- 15 Strongly Tenant-Friendly · D+10
- County
- — inherits STATE
- City
- — inherits STATE
ZIP-level market 12428
- Home prices YoY
- 20.0%
- Active inventory
- 70
- Price-to-rent
- 12.5×
Monthly cashflow live
- Estimated rent
- $2,000 medium interval (Pro) →
- Mortgage (P&I)
- −$1,568
- Tax from tax record
- −$210 /mo · $2,514/yr
- Insurance
- −$125
- Flood insurance flood zone
- −$56 /mo · $666/yr
- HOA
- −$0
- Vacancy / Maint / Mgmt
- −$420
- Net cashflow
- $-378
Break-even live
UW: 25.0% down · 7.5% · 30yr · 1.5% tax · 5.0% vac · 8.0% maint · 8.0% mgmt
Financing live
Cash to close
- Down payment
- $74,750
- Closing costs
- $8,970
- Reserves months
- —
- Total cash needed
- —
Loan-product check · same deal, 3 products live
Conventional
25% down · 7.5% · 30yr
- Down + closing
- —
- Monthly P&I
- —
- Monthly cashflow
- —
- DSCR
- —
- Eligible?
- —
Personal DTI + credit; lowest rate.
DSCR
20% down · 8.5% · 30yr
- Down + closing
- —
- Monthly P&I
- —
- Monthly cashflow
- —
- DSCR
- —
- Eligible?
- —
No personal income docs; deal must DSCR.
Hard money
10% down · 12.0% · 12mo
- Down + closing
- —
- Monthly P&I
- —
- Monthly cashflow
- —
- DSCR
- —
- Eligible?
- —
Short-term bridge; refi at stabilization.
Rent comps 1 comps
| Address | Beds | Baths | Sqft | Rent | $/sqft | DOM | Units | Dist |
|---|---|---|---|---|---|---|---|---|
| 14 Warren St Ellenville, NY | 3.0 | 2.0 | 1500 | $2,000 | $1.33 | 44d | 1 | 0.52mi |
Listing history 23 events
-
2026-05-31days on market $299,000 Active 40 DOM
-
2026-04-21$299,000 Active 247-char remark
Show marketing remark (247 chars)
Investor opportunity or renovation-ready home! This classic two-story property offers a spacious layout with generous room sizes. Features include a large covered front porch, wood flooring, and a comfortable flow between living and kitchen areas.
-
2026-04-21historical
Show marketing remark (247 chars)
Investor opportunity or renovation-ready home! This classic two-story property offers a spacious layout with generous room sizes. Features include a large covered front porch, wood flooring, and a comfortable flow between living and kitchen areas.
-
2026-04-21$299,000 Active
Show marketing remark (247 chars)
Investor opportunity or renovation-ready home! This classic two-story property offers a spacious layout with generous room sizes. Features include a large covered front porch, wood flooring, and a comfortable flow between living and kitchen areas.
-
2025-12-26soldstatus $302,000
-
2025-12-01soldstatus $302,000 Closed
-
2025-10-30status Pending
-
2025-10-28status Active
-
2025-10-27historical
-
2025-10-21$290,000
-
2025-09-17status Pending
-
2025-09-17historical
-
2025-09-17$290,000 Active
-
2025-07-04historical $1,575
-
2025-06-06$1,575
-
2025-06-01historical $1,575
-
2025-03-12$1,575
-
2021-10-27soldstatus $175,000
-
2021-10-21soldstatus $175,500 Closed
-
2021-04-12historical
-
2021-01-19$199,000
-
2021-01-18$199,000
-
2019-01-17$119,000
ⓘ Source: listings_history table (triggers on properties + properties_extension) + one-shot
backfill from property_details.listing_events for pre-trigger history.
Tax reassessment forecast NY · Partial reset (capped growth)
- Current annual tax
- $2,514 · $210/mo
- Projected year-2 tax
- $3,784 · $315/mo
- Expected delta
- +$1,269/yr (+$106/mo · 50.5%)
ⓘ Screening estimate from a state-policy table — verify with the county assessor before closing.
Climate risk First Street
- Flood 9/10 Extreme FEMA zone X (unshaded) · 99% chance over 30 yrs
- Wildfire 2/10 Low
- Heat 4/10 Moderate 9 d/yr ≥89°F today · 20 d/yr by 30 yrs out
- Wind 3/10 Moderate 6% chance of damaging wind over 30 yrs
- Air quality 2/10 Low 1 unhealthy d/yr today · 1 by 30 yrs out
Nearby sold comps map
Loading sold comps map…
Walkable amenities ~0.75 mi
Loading nearby amenities…
Taxation est. · year 1
- Rental income
- $24,000
- − Mortgage interest
- −$16,749
- − Property taxes
- −$2,514
- − Insurance
- −$2,162
- − Repairs & maintenance
- −$1,920
- − Management
- −$1,920
- − Depreciation
- −$8,698
- Taxable loss
- −$9,963
- Est. tax savings @ 24.0%
- +$2,391
- After-tax cash flow
- $-2,141/yr
For passive investors: Depreciation is non-cash, so a rental often shows a tax loss while cash-flowing — sheltering income. Rental losses are passive: they offset passive income freely, and up to $25,000/yr can offset ordinary (W-2) income if you actively participate and your MAGI is under $100k (phasing out to $0 by $150k); unused losses carry forward. On sale, claimed depreciation is recaptured at up to 25%, and gains may owe capital-gains tax (a 1031 exchange can defer both). Figures are a year-1 estimate at your 24.0% rate — not tax advice; consult a CPA.
Schools (NCES district)
- District
- Ellenville Central School District
- NCES district ID
- 3610500
- Math proficiency
- 32% ▼ -6.00%
- Reading proficiency
- 46% ▲ 10.00%
- Median HH income
- $45,937
- Composite
- 33.22/100
- National rank
- #5525
- State rank
- #534 of 590 in NY
Livability — Ellenville
- Score
- 60/100
- State rank
- #961
- US rank
- #18871
Category grades
Schools grade is shown separately in the Schools card above.
Census & demographics
- Census place
- Ellenville, NY
- Population (ZIP)
- 6,972
Population outlook (Ulster County) Hauer SSP2
- Today (2025)
- 175,887 people
- By 2030
- 171,876 · -2.3%
- By 2040
- 161,771 · -8.0%
- By 2050
- 151,470 · -13.9%
- By 2075
- 133,023 · -24.4%
- By 2100
- 113,504 · -35.5%
Race, ethnicity, and origin ACS 2023
- Neighborhood character
- Majority White (63%)
- Race & ethnicity
- White 63% Hispanic / Latino 28% Two or more races 9% Black 4%
- Hispanic origin (detail)
- Mexican 1% Puerto Rican 17% Dominican 4%
- Common ancestry
- Romanian 5% Italian 3% Lithuanian 3%
- Foreign-born
- 9% · Canada, Jamaica, Dominican Republic
- Languages at home
- 75% English-only · Spanish 20% Russian/Polish/Slavic 4% Other Indo-European 1%
Political lean MEDSL · Ulster
- 2024 margin
- D (+18.7) · D 59.3% · R 40.7%
- 2008→2024 swing
- -4.9pp toward R · 2008: 23.6pp · 2024: 18.7pp
- All cycles
- 2024: D+18.7 2020: D+20.9 2016: D+9.1 2012: D+21.9 2008: D+23.6
Not yet ingested
- Civics
- —
Market trends
- HPI YoY
- ▲ 62.17%
- Current HPI
- 372.5352
- Rent YoY
- —
- Metro
- —
- State GDP YoY
- ▲ 2.60%
- F500 in state
- 92
Industry mix (Fortune 500 HQ in NY)
| Industry | F500 HQs | Revenue |
|---|---|---|
| Financial Services | 10 | $950B |
|
||
| Consumer Goods | 9 | $162B |
|
||
| Insurance | 4 | $225B |
|
||
| Telecommunications | 2 | $144B |
|
||
| Pharmaceuticals | 2 | $112B |
|
||
| Media / Entertainment | 2 | $69B |
|
||
Price history
+151.3% since first listed22 events — show timeline
- 2026-04-21 Listed $299,000 OneKey® MLS as Distributed by MLS Grid
- 2026-04-21 Listing Removed — OneKey® MLS as Distributed by MLS Grid
- 2026-04-21 Listed $299,000 OneKey® MLS as Distributed by MLS Grid
- 2025-12-26 Sold (Public Records) $302,000 Public Records
- 2025-12-01 Sold (MLS) $302,000 OneKey® MLS as Distributed by MLS Grid
- 2025-10-30 Pending — OneKey® MLS as Distributed by MLS Grid
- 2025-10-28 Relisted — OneKey® MLS as Distributed by MLS Grid
- 2025-10-27 Listing Removed — OneKey® MLS as Distributed by MLS Grid
- 2025-10-21 Listed $290,000 OneKey® MLS as Distributed by MLS Grid
- 2025-09-17 Pending — OneKey® MLS as Distributed by MLS Grid
- 2025-09-17 Listed $290,000 OneKey® MLS as Distributed by MLS Grid
- 2025-09-17 Listing Removed — OneKey® MLS as Distributed by MLS Grid
- 2025-07-04 Rental Removed $1,575 ONEKEY
- 2025-06-06 Listed for Rent $1,575 ONEKEY
- 2025-06-01 Rental Removed $1,575 ONEKEY
- 2025-03-12 Listed for Rent $1,575 ONEKEY
- 2021-10-27 Sold (Public Records) $175,000 Public Records
- 2021-10-21 Sold (MLS) $175,500 OneKey® MLS as Distributed by MLS Grid
- 2021-04-12 Listing Removed — OneKey® MLS as Distributed by MLS Grid
- 2021-01-19 Listed $199,000 HVCRMLS
- 2021-01-18 Listed $199,000 OneKey® MLS as Distributed by MLS Grid
- 2019-01-17 Listed $119,000 HVCRMLS
Property tax history
+2.1%/yrLatest (2025): $2,514 · +51.9% YoY. Source: county tax records.
Cash-flow waterfall
monthlySold comps — $/sqft
last 12 mo · ≤1 miLoading sold comps…