 Multi-family
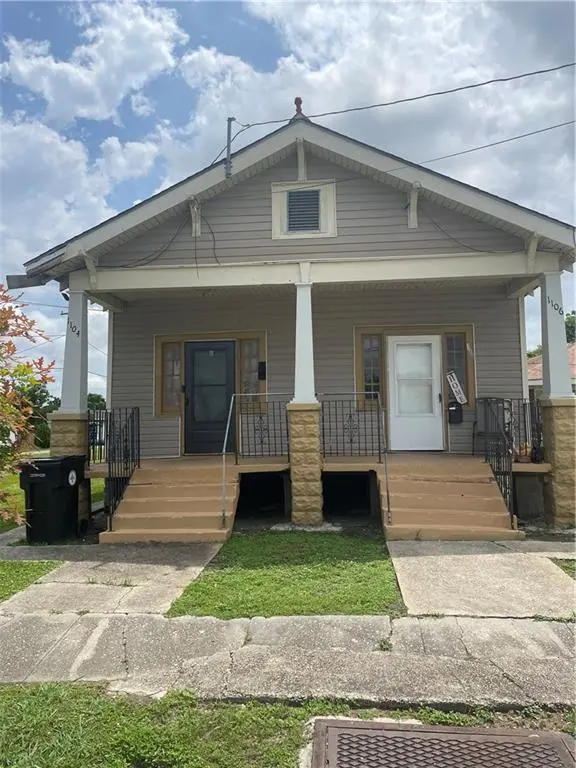
1104 06 Leboeuf St · New Orleans, LA
Flood risk 8/10 · Major
- FEMA flood zone
- X
- Chance of flooding over 30 yrs
- 0.6%
- Est. flood insurance / yr
- $507 – $1,088
Fire risk 1/10 · Minimal
- Est. fire insurance / yr
- $1,269 – $2,357
Heat risk 10/10 · Severe
- Hot days now (above 108°F)
- 7 days/yr
- Hot days in 30 yrs
- 21 days/yr
Wind risk 10/10 · Severe
- Chance of severe wind over 30 yrs
- 99.0%
Air-quality risk 2/10 · Minimal
- Unhealthy air days now
- 2 days/yr
- Unhealthy air days in 30 yrs
- 2 days/yr
Risk factors via First Street. Map © Google.
Why this score? — see what drove the C+ grade
The composite is a weighted blend of 9 inputs, each scored 0–100. Each bar is that input's sub-score; the figure is the points it added to the 100-point composite (weight × sub-score).
- Cash flow +30.0/30.0
- 1% rule +10.0/10.0
- DSCR +10.0/10.0
- Livability +4.0/5.0
- Rent growth +2.3/5.0
- Condition / age +2.2/5.0
- ARV discount +1.8/15.0
- Schools +1.6/10.0
- Appreciation +0.0/10.0
$165,000
🖨 Deal sheet 📄 Offer letter ✓ Due diligence
Multi-family units
County records classify this as Multi-Family (2-4 Unit). Listing-text estimate: 1 unit. estimate disagrees with records
Listing remarks MLS
VERY NICE DOUBLE IN X FLOOD ZONE, ONE UNIT IS VACANT AND IS BEING REFURBISHED. BOTH UNITS HAVE SEPARATE METERS, BOTH UNITS HAS RANGE/OVEN AND REFRIGERATORS. SITUATED ON A DEEP LOT. WORKING ON LEVELING FOUNDATION
Key facts
- Deep lot
- Being refurbished
- Leveling foundation
Tags
Property features AI
Finance
- Financial info: Two-unit property (total units: 2); Tenant pays electricity, gas, and water; Unit 1104 listed rent: $1,100 (actual rent $1,100)
Exterior
- Parking: Off-street parking
- Utilities: Public water; Public sewer
- Home design: Single-story building
- Construction: Vinyl siding; Asphalt shingle roof; Raised foundation
- Exterior features: Porch; Fence; City lot with rectangular shape; Lot dimensions approximately 33 x 164 feet; Raised foundation
Interior
- Bedrooms: Unit 1104: 2 bedrooms; Unit 1106: 2 bedrooms
- Bathrooms: Unit 1104: 1 full bathroom; Unit 1106: 1 full bathroom; Total full bathrooms: 2
- Heating & cooling: Window heating units; Window cooling units
- Interior features: Two 2-bedroom units (units 1104 and 1106); Each unit has 1 full bathroom
Neighborhood map
What this means for you Summary
Snapshot
- This is a 4-bed/2.0-bath multifamily listed at $165k. Condition is rated fair.
Deal economics
- At list price, monthly cash flow is $805 ($10k/yr) — positive.
- The deal already cash-flows at list — no discount required.
- Meets the 1% rule at list price ($3k rent vs $165k).
- Recommended offer: $160k (3.0% below list) — sets the bar for market timing.
- Cap rate 12.6% vs local median 4.4% in New Orleans — top-decile yield for the area; either an underpriced asset or a hidden risk that comps aren't pricing in. Stress-test before assuming the spread holds.
Location & tenants
- Location reads 81/100 on livability (#3 in LA, #1,383 nationally) — a professional / high-income tenant draw. Strengths: amenities A+, commute A+, health & safety A+; Watch: crime C-, employment D.
- Orleans Parish (urban): math 11% / reading 27% proficiency, ranked #69 of 98 in LA (top 70%) — low school quality limits family demand, transient renter base, plan for 1-2y turnover; 68% free/reduced lunch — lower-income household profile, screen leases tightly.
- Market conditions: Rents soft (-0.7%/yr); 265 active listings in the ZIP; 29 comparable units currently listed for rent nearby; rentals at typical pace (median 21d on market — plan ~3-4 weeks tenant-placement turnaround); lower-income renter base — watch delinquency; 710 units permitted in Orleans Parish in 2024 (244 in 5+ unit buildings).
- At $2,547/mo this rent would consume 70% of the median local household income ($43k/yr) (locally 2240% of renters already pay >50% of income on rent) — very limited rent-growth headroom before tenants either downsize or default.
Forward outlook
- Local home prices are declining (-3.0%/yr); year-one equity from $1k of loan paydown is wiped out by about $5k of value loss. Plan a longer hold.
- Orleans County population projected at +61% by 2050 — long-run rental-demand tailwind backs the buy-and-hold thesis.
- At projected returns (-3.0% appreciation + 0.0% rent growth), your $46k cash investment doubles in ~8 years — after that, you're playing with house money.
Negotiation context
- It's been on market 47 days — a 3% lower offer ($160k) is reasonable based on typical stale-listing flexibility.
- 11 sale attempts since 29y ago with the ask held roughly flat each time — persistent listings suggest the price (not the market) is what's stuck; bring a comps-based counter.
Risks & watch-outs
- Watch-outs: flood insurance adds $66/mo.
- Climate carrying-cost: severe flood risk; severe wind risk, 99% chance of damaging wind over 30y; extreme-heat days projected 7→21/yr by 2055 (HVAC capex compounding) — expect insurance premiums to compound above CPI over the hold.
Questions for the listing agent
- It's been on market 47 days. Have you received any prior offers? Is the seller open to a 3% concession, seller financing, or rate buy-down credit?
- Have any recent inspections been done? Can we get a copy of the seller's disclosures and any deferred-maintenance estimates?
- Built in 1960 — when were the roof, HVAC, electrical panel, plumbing, and water heater last replaced?
- What's the actual annual flood-insurance premium (NFIP or private), and is the property in a SFHA with mandatory coverage?
- Is there a deadline driving the sale (1031 exchange, divorce, estate, relocation)? That informs how much negotiation room exists.
- What's the average days-on-market for RENTAL listings here right now (not sales)? A rising rental-DOM trend means longer vacancies and softer asking-rent achievability than the comps imply.
- What's the recent tenant-quality profile in this submarket — average credit score on applications, eviction rate, late-payment / NSF rate, and stable-employment percentage? A property-management company in the area should have these aggregated.
- How much new apartment / multifamily construction is in the pipeline within 1–3 miles? Heavy new supply (>2% of stock underway) typically softens rents 12–24 months out; light construction supports rent growth.
Investment metrics
- 1% rule
- 1.54% ✓
- Cap rate
- 12.63%
- Cash-on-cash
- 22.65%
- DSCR
- 2.01
- GRM
- 5.4
CMA / ARV
- ARV (median comp)
- $146,530
- List price
- $165,000
- Delta
- 12.60%
- Verdict
- OVERPRICED
- Comps
- 20 within 1.0 mi
Show comp detail 5 sales within ~0.75 mi
| Address | Dist | Beds/Ba | Sqft | Sold | Price | $/sf | Match |
|---|---|---|---|---|---|---|---|
| 1031 33 Nunez St | 0.55mi | 4/1.0 | 1,352 (+0%) | 21mo | $107,500 | $80 | 52 |
| 1100 02 Hendee St | 0.20mi | 4/2.0 | 1,521 (+13%) | 22mo | $174,490 | $115 | 51 |
| 733 Whitney Ave | 0.25mi | 3/3.0 (-1) | 1,500 (+11%) | 22mo | $144,000 | $96 | 42 |
| 320-22 Lebouef St | 0.58mi | 4/2.0 | 1,200 (-11%) | 21mo | $140,000 | $117 | 37 |
| 841 Elmira Ave | 0.37mi | 3/3.0 (-1) | 1,500 (+11%) | 22mo | $214,000 | $143 | 37 |
Match score weights: distance 35% · size 25% · config 20% · recency 20%. Top-matched comps best support the ARV.
Projected returns pro-forma
-3.0% appreciation · 0.0% rent growth · sell at horizon
- IRR
- 9.8%
- Equity multiple
- 1.37×
- Total profit
- $17,174
- Equity at exit
- $24,602
- IRR
- 16.2%
- Equity multiple
- 2.14×
- Total profit
- $52,482
- Equity at exit
- $14,266
Cash invested: $46,200 (down + closing). Projections, not guarantees.
Landlord ↔ Tenant lean methodology
- Overall (STATE)
- 90 Strongly Landlord-Friendly
- State Louisiana
- 90 Strongly Landlord-Friendly · R+12
- County
- — inherits STATE
- City
- — inherits STATE
ZIP-level market 70114
- Rents YoY
- -0.7%
- Active inventory
- 265
- Price-to-rent
- 10.8×
Monthly cashflow live
- Estimated rent
- $2,547 high interval (Pro) →
- Mortgage (P&I)
- −$865
- Tax est. 1.5%
- −$206 /mo · $2,475/yr
- Insurance
- −$69
- Flood insurance flood zone
- −$66 /mo · $798/yr
- HOA
- −$0
- Vacancy / Maint / Mgmt
- −$535
- Net cashflow
- $805
Break-even live
2-unit breakdown (identical units grouped — click to expand)
| Units | Beds | Baths | Est. rent |
|---|---|---|---|
| 2× units | 2 | 1 | $2,546 |
| #1 | 2 | 1 | $1,273 |
| #2 | 2 | 1 | $1,273 |
| Total (2 units) | $2,547 | ||
UW: 25.0% down · 7.5% · 30yr · 1.5% tax · 5.0% vac · 8.0% maint · 8.0% mgmt
Financing live
Cash to close
- Down payment
- $41,250
- Closing costs
- $4,950
- Reserves months
- —
- Total cash needed
- —
Loan-product check · same deal, 3 products live
Conventional
25% down · 7.5% · 30yr
- Down + closing
- —
- Monthly P&I
- —
- Monthly cashflow
- —
- DSCR
- —
- Eligible?
- —
Personal DTI + credit; lowest rate.
DSCR
20% down · 8.5% · 30yr
- Down + closing
- —
- Monthly P&I
- —
- Monthly cashflow
- —
- DSCR
- —
- Eligible?
- —
No personal income docs; deal must DSCR.
Hard money
10% down · 12.0% · 12mo
- Down + closing
- —
- Monthly P&I
- —
- Monthly cashflow
- —
- DSCR
- —
- Eligible?
- —
Short-term bridge; refi at stabilization.
Rent comps 29 comps
| Address | Beds | Baths | Sqft | Rent | $/sqft | DOM | Units | Dist |
|---|---|---|---|---|---|---|---|---|
| 807 Whitney Ave Unit 1 New Orleans, LA | 3.0 | 2.0 | 1262 | $1,500 | $1.19 | 3d | 1 | 0.22mi |
| 1108 Sumner St New Orleans, LA | 3.0 | 1.5 | 1197 | $1,500 | $1.25 | 11d | 1 | 0.26mi |
| 1414 Sumner St New Orleans, LA | 3.0 | 2.0 | 1800 | $1,450 | $0.81 | 16d | 1 | 0.35mi |
| 718 Majestic Pl New Orleans, LA | 3.0 | 2.0 | 1164 | $1,785 | $1.53 | 21d | 1 | 0.35mi |
| 701 Behrman Ave New Orleans, LA | 3.0 | 2.0 | 1368 | $2,300 | $1.68 | 3d | 1 | 0.41mi |
| 606 Drum St New Orleans, LA | 3.0 | 2.0 | 1131 | $2,350 | $2.08 | 23d | 1 | 0.46mi |
| 527 Atlantic Ave New Orleans, LA | 3.0 | 2.0 | 1800 | $2,050 | $1.14 | 23d | 1 | 0.47mi |
| 513 Park Blvd New Orleans, LA | 3.0 | 2.0 | 1600 | $2,300 | $1.44 | 3d | 1 | 0.56mi |
| 433 Homer St Unit 1 New Orleans, LA | 4.0 | 2.0 | 1570 | $1,850 | $1.18 | 23d | 1 | 0.58mi |
| 1140 Teche St Apt B New Orleans, LA | 3.0 | 1.0 | 1100 | $1,850 | $1.68 | 23d | 1 | 0.60mi |
| 336 Elmira Ave New Orleans, LA | 3.0 | 1.0 | 1250 | $1,825 | $1.46 | 23d | 1 | 0.64mi |
| 400 Park Blvd Unit A New Orleans, LA | 4.0 | 1.5 | 1275 | $2,200 | $1.73 | 23d | 1 | 0.64mi |
| 1136 Brooklyn Ave New Orleans, LA | 3.0 | 1.0 | 913 | $1,600 | $1.75 | 23d | 1 | 0.66mi |
| 325 Elmira Ave Unit 325 New Orleans, LA | 3.0 | 1.5 | 1050 | $1,525 | $1.45 | 23d | 1 | 0.67mi |
| 1625 Lauradale Dr New Orleans, LA | 3.0 | 2.0 | 1029 | $1,700 | $1.65 | 3d | 1 | 0.69mi |
| 1684 Lauradale Dr New Orleans, LA | 4.0 | 2.0 | 1571 | $2,000 | $1.27 | 23d | 1 | 0.76mi |
| 249 Vallette St New Orleans, LA | 4.0 | 2.0 | 1734 | $2,500 | $1.44 | 16d | 1 | 0.78mi |
| 119 Vallette St New Orleans, LA | 3.0 | 2.5 | 1500 | $2,100 | $1.40 | 23d | 1 | 0.85mi |
| 2320 Mardi Gras Blvd New Orleans, LA | 4.0 | 2.5 | 1600 | $2,500 | $1.56 | 1d | 1 | 0.92mi |
| 1010 Isbell St Gretna, LA | 3.0 | 1.0 | 1300 | $1,350 | $1.04 | 43d | 1 | 0.96mi |
| 1719 Pace Blvd New Orleans, LA | 3.0 | 1.0 | 1178 | $2,000 | $1.70 | 11d | 1 | 1.03mi |
| 1200 Southlawn Blvd New Orleans, LA | 3.0 | 2.0 | 950 | $1,725 | $1.82 | 23d | 1 | 1.04mi |
| 1622 Jo Ann Pl New Orleans, LA | 3.0 | 1.5 | 1301 | $1,500 | $1.15 | 1d | 1 | 1.07mi |
| 1774 Pace Blvd New Orleans, LA | 4.0 | 2.5 | 1574 | $2,000 | $1.27 | 23d | 1 | 1.09mi |
| 3000 Americus St New Orleans, LA | 3.0 | 2.0 | 1280 | $1,400 | $1.09 | 23d | 1 | 1.15mi |
| 2002 Pace Blvd Unit 103 New Orleans, LA | 3.0 | 2.0 | 1000 | $1,500 | $1.50 | 14d | 1 | 1.20mi |
| 619 Reynes St New Orleans, LA | 3.0 | 2.0 | 1318 | $2,100 | $1.59 | 16d | 1 | 1.46mi |
| 3441 Catalina Dr New Orleans, LA | 5.0 | 2.0 | 1610 | $2,450 | $1.52 | 11d | 1 | 1.46mi |
| 617 Forstall St New Orleans, LA | 3.0 | 2.0 | 1262 | $2,200 | $1.74 | 3d | 1 | 1.49mi |
Listing history 28 events
-
2026-06-18days on market $165,000 Active 47 DOM
-
2026-06-17days on market $165,000 Active 46 DOM
-
2026-06-16days on market $165,000 Active 45 DOM
-
2026-06-15days on market $165,000 Active 44 DOM
-
2026-06-13days on market $165,000 Active 42 DOM
-
2026-06-10days on market $165,000 Active 39 DOM
-
2026-06-09days on market $165,000 Active 38 DOM
-
2026-06-08days on market $165,000 Active 37 DOM
-
2026-06-07days on market $165,000 Active 36 DOM
-
2026-06-05days on market $165,000 Active 33 DOM
-
2026-06-03days on market $165,000 Active 32 DOM
-
2026-06-02days on market $165,000 Active 31 DOM
-
2026-06-01days on market $165,000 Active 30 DOM
-
2026-05-31days on market $165,000 Active 29 DOM
-
2026-04-30$165,000 Active 211-char remark
Show marketing remark (211 chars)
VERY NICE DOUBLE IN X FLOOD ZONE, ONE UNIT IS VACANT AND IS BEING REFURBISHED. BOTH UNITS HAVE SEPARATE METERS, BOTH UNITS HAS RANGE/OVEN AND REFRIGERATORS. SITUATED ON A DEEP LOT. WORKING ON LEVELING FOUNDATION
-
2026-04-30$165,000 Active 212-char remark
Show marketing remark (211 chars)
VERY NICE DOUBLE IN X FLOOD ZONE, ONE UNIT IS VACANT AND IS BEING REFURBISHED. BOTH UNITS HAVE SEPARATE METERS, BOTH UNITS HAS RANGE/OVEN AND REFRIGERATORS. SITUATED ON A DEEP LOT. WORKING ON LEVELING FOUNDATION
-
2024-11-06price $170,000
-
2024-11-06price $170,000
-
2024-06-05price $180,000
-
2024-05-06$180,000 Active
-
2020-12-10$150,000
-
2017-12-14$109,000
-
2016-01-13$114,000
-
2014-05-01$124,000
-
2009-04-04$145,000
-
2006-10-23$141,500
-
1998-11-24$39,999
-
1997-02-04$29,500
ⓘ Source: listings_history table (triggers on properties + properties_extension) + one-shot
backfill from property_details.listing_events for pre-trigger history.
Climate risk First Street
- Flood 8/10 Severe FEMA zone X · 60% chance over 30 yrs
- Wildfire 1/10 Low
- Heat 10/10 Extreme 7 d/yr ≥108°F today · 21 d/yr by 30 yrs out
- Wind 10/10 Extreme 99% chance of damaging wind over 30 yrs
- Air quality 2/10 Low 2 unhealthy d/yr today · 2 by 30 yrs out
Nearby sold comps map
Loading sold comps map…
Walkable amenities ~0.75 mi
Loading nearby amenities…
Taxation est. · year 1
- Rental income
- $30,564
- − Mortgage interest
- −$9,243
- − Property taxes
- −$2,475
- − Insurance
- −$1,622
- − Repairs & maintenance
- −$2,445
- − Management
- −$2,445
- − Depreciation
- −$4,800
- Taxable income
- $7,534
- Est. tax owed @ 24.0%
- −$1,808
- After-tax cash flow
- $7,857/yr
For passive investors: Depreciation is non-cash, so a rental often shows a tax loss while cash-flowing — sheltering income. Rental losses are passive: they offset passive income freely, and up to $25,000/yr can offset ordinary (W-2) income if you actively participate and your MAGI is under $100k (phasing out to $0 by $150k); unused losses carry forward. On sale, claimed depreciation is recaptured at up to 25%, and gains may owe capital-gains tax (a 1031 exchange can defer both). Figures are a year-1 estimate at your 24.0% rate — not tax advice; consult a CPA.
Condition & rehab AI · 10 photos
This property requires moderate repairs and maintenance, including roof replacement and exterior painting, to improve its condition and value.
Repairs flagged
- Major roof — visible wear
- Major exterior siding — weathered appearance
- Minor landscaping — basic landscaping
Value-add opportunities
- Both paint exterior — enhances curb appeal and value
- Both replace roof — extends life and improves value
- Both landscaping — enhances curb appeal and value
Renovation cost estimate screening
| Repair item | Severity | Est. cost |
|---|---|---|
| roof · visible wear | Major | $15,000–50,000 |
| exterior siding · weathered appearance | Major | $15,000–50,000 |
| landscaping · basic landscaping | Minor | $500–3,000 |
| Total estimated repair cost · 3 items | $30,500–103,000 |
Value-add ROI direction
- Both paint exterior — enhances curb appeal and value ↑
- Both replace roof — extends life and improves value ↑
- Both landscaping — enhances curb appeal and value ↑
ⓘ Cost ranges are severity-bucket heuristics (US national rule-of-thumb). Get contractor quotes + a written scope before underwriting a rehab budget.
Schools (NCES district)
- District
- Orleans Parish
- NCES district ID
- 2201170
- Math proficiency
- 11% ▼ -52.00%
- Reading proficiency
- 27% ▼ -46.00%
- Median HH income
- $37,011
- Composite
- 15.78/100
- National rank
- #9271
- State rank
- #69 of 98 in LA
Livability — New Orleans
- Score
- 81/100
- State rank
- #3
- US rank
- #1383
Category grades
Schools grade is shown separately in the Schools card above.
Census & demographics
- Census place
- New Orleans, LA
- County
- Orleans Parish · 338,817 people
- City population
- 338,817
- Metro
- New Orleans-Metairie, LA
- Population (ZIP)
- 22,659
- Household income
- $43,493
- Rent vs Own
- Severe rent burden
- 2240.0
Population outlook (Orleans County) Hauer SSP2
- Today (2025)
- 513,025 people
- By 2030
- 575,781 · +12.2%
- By 2040
- 700,174 · +36.5%
- By 2050
- 826,541 · +61.1%
- By 2075
- 1,123,374 · +119.0%
- By 2100
- 1,355,609 · +164.2%
Race, ethnicity, and origin ACS 2023
- Neighborhood character
- Predominantly Black (72%)
- Race & ethnicity
- Black 72% White 16% Hispanic / Latino 8% Two or more races 5%
- Hispanic origin (detail)
- Mexican 2% Puerto Rican 1%
- Common ancestry
- Lithuanian 3% Slovak 1% Italian 1%
- Foreign-born
- 5% · Canada
- Languages at home
- 91% English-only · Spanish 6% French/Haitian/Cajun 2% Other Indo-European 1%
Political lean MEDSL · Orleans
- 2024 margin
- Solid D (+67.0) · D 82.2% · R 15.2% · Other 2.7%
- 2008→2024 swing
- +6.7pp toward D · 2008: 60.3pp · 2024: 67.0pp
- All cycles
- 2024: D+67.0 2020: D+68.2 2016: D+66.2 2012: D+62.5 2008: D+60.3
Not yet ingested
- Civics
- —
Market trends
- HPI YoY
- ▼ -98.56%
- Current HPI
- 149.0172
- Rent YoY
- ▼ -0.72%
- Metro
- New Orleans-Metairie, LA
- State GDP YoY
- ▲ 3.29%
- F500 in state
- 10
Industry mix (Fortune 500 HQ in LA)
| Industry | F500 HQs | Revenue |
|---|---|---|
| Telecommunications | 2 | $23B |
|
||
| Utilities | 1 | $12B |
|
||
| Wholesale / Distribution | 1 | $5B |
|
||
| Advertising | 1 | $2B |
|
||
Price history
+459.3% since first listed14 events — show timeline
- 2026-04-30 Listed $165,000 GSREIN
- 2026-04-30 Listed $165,000 AcadianaMLS
- 2024-11-06 Price Changed $170,000 AcadianaMLS
- 2024-11-06 Price Changed $170,000 GSREIN
- 2024-06-05 Price Changed $180,000 GSREIN
- 2024-05-06 Listed $180,000 AcadianaMLS
- 2020-12-10 Listed $150,000 AcadianaMLS
- 2017-12-14 Listed $109,000 AcadianaMLS
- 2016-01-13 Listed $114,000 AcadianaMLS
- 2014-05-01 Listed $124,000 AcadianaMLS
- 2009-04-04 Listed $145,000 AcadianaMLS
- 2006-10-23 Listed $141,500 AcadianaMLS
- 1998-11-24 Listed $39,999 AcadianaMLS
- 1997-02-04 Listed $29,500 AcadianaMLS
Cash-flow waterfall
monthlySold comps — $/sqft
last 12 mo · ≤1 miLoading sold comps…