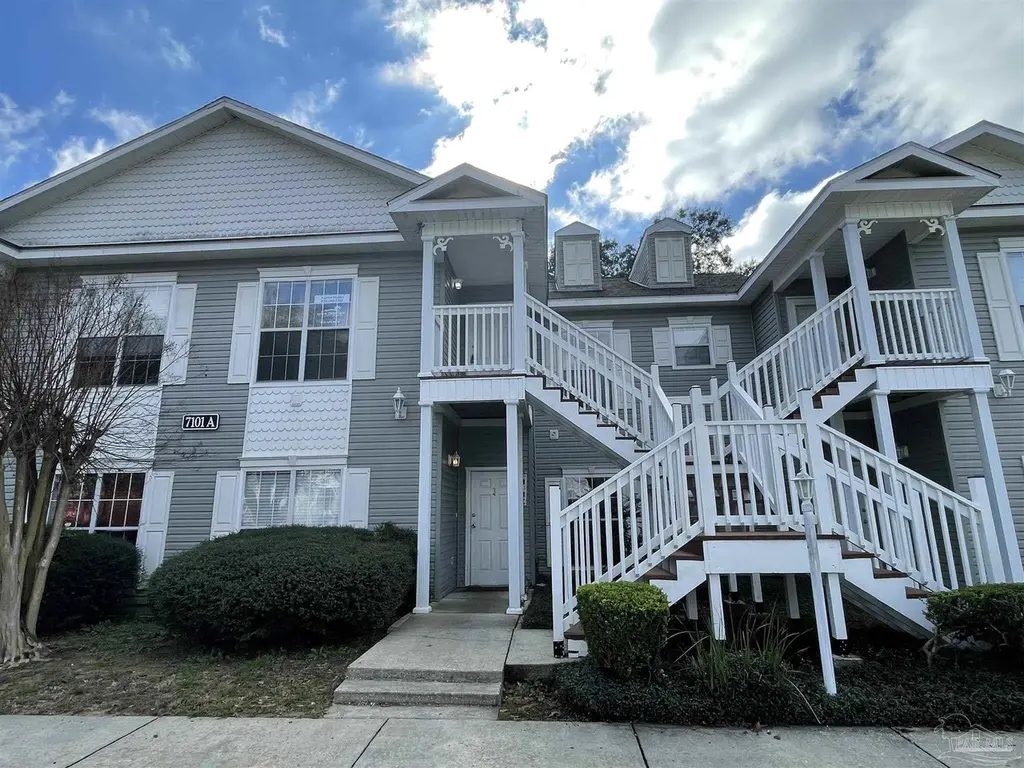
7101 Joy St Unit A7 · Ferry Pass, FL
Flood risk 1/10 · Minimal
- FEMA flood zone
- X (unshaded)
- Chance of flooding over 30 yrs
- 0.0%
- Est. flood insurance / yr
- $507 – $1,088
Fire risk 1/10 · Minimal
- Est. fire insurance / yr
- $947 – $1,759
Heat risk 10/10 · Severe
- Hot days now (above 106°F)
- 7 days/yr
- Hot days in 30 yrs
- 22 days/yr
Wind risk 9/10 · Severe
- Chance of severe wind over 30 yrs
- 99.0%
Air-quality risk 1/10 · Minimal
- Unhealthy air days now
- 0 days/yr
- Unhealthy air days in 30 yrs
- 0 days/yr
Risk factors via First Street. Map © Google.
Why this score? — see what drove the D- grade
The composite is a weighted blend of 9 inputs, each scored 0–100. Each bar is that input's sub-score; the figure is the points it added to the 100-point composite (weight × sub-score).
- Cash flow +10.7/30.0
- ARV discount +7.6/15.0
- 1% rule +5.2/10.0
- Schools +3.6/10.0
- Rent growth +3.4/5.0
- Livability +3.2/5.0
- DSCR +3.1/10.0
- Condition / age +2.5/5.0
- Appreciation +0.0/10.0
$165,000
🖨 Deal sheet 📄 Offer letter ✓ Due diligence
Listing remarks MLS
Beautiful Condo near EVERYTHING! Davis shopping area, UWF, Cordova Mall, Airports, MAJOR shopping - all within 5-10 minutes or even less! ~ The condo is clean and beautiful with New Luxury Vinyl Plank flooring throughout the entire unit ~ 3 nice-size Bedrooms and 2 Baths ~ High ceilings throughout gives it an open, more spacious feeling! ~ The Living Room is large and the Kitchen is well-featured and open ~ Laundry room ~ Balcony for relaxing ~ Parking is directly in front of the unit *** Community Pool ***
Key facts
- Community pool
- Uwf
- Laundry room
Tags
Neighborhood map
What this means for you Summary
Snapshot
- This is a 3-bed/2.0-bath condo listed at $165k.
Deal economics
- At list price, monthly cash flow is $-77 ($-926/yr) — negative.
- To cash-flow at today's rent, offer at most $151k (8.3% below list).
- Meets the 1% rule at list price ($2k rent vs $165k).
- Recommended offer: $145k (12.0% below list) — sets the bar for market timing.
- Cap rate 5.7% vs local median 4.4% in Ferry Pass — meaningfully above typical; check what's discounted (condition, days-on-market, listing class) to confirm the premium yield is real.
Location & tenants
- Location reads 65/100 on livability (#664 in FL) — a middle-class / working-renter tenant base. Strengths: cost of living A+, housing A+; Watch: employment C-, schools D, amenities F.
- Escambia (suburban): math 40% / reading 45% proficiency, ranked #56 of 73 in FL (top 77%) — families likely to look elsewhere, expect single-tenant / working-renter base with shorter leases.
- Market conditions: Rents rising (+3.6%/yr); 172 active listings in the ZIP; 24 comparable units currently listed for rent nearby; rentals at typical pace (median 24d on market — plan ~3-4 weeks tenant-placement turnaround); 1,479 units permitted in Escambia County in 2024 (0 in 5+ unit buildings).
Forward outlook
- Local home prices are declining (-3.0%/yr); year-one equity from $1k of loan paydown is wiped out by about $5k of value loss. Plan a longer hold.
- Escambia County population projected at +13% by 2050 — modest demand growth; plan on rents tracking national, not racing it.
Negotiation context
- It's been on market 165 days — a 12% lower offer ($145k) is reasonable based on typical stale-listing flexibility.
- 4 sale attempts since 23y ago with the ask held roughly flat each time — persistent listings suggest the price (not the market) is what's stuck; bring a comps-based counter.
- Current owner paid $108k; list at $165k implies a 53% gain — meaningful room to come down on a strong offer.
Risks & watch-outs
- Climate carrying-cost: severe wind risk, 99% chance of damaging wind over 30y; extreme-heat days projected 7→22/yr by 2055 (HVAC capex compounding) — expect insurance premiums to compound above CPI over the hold.
Questions for the listing agent
- What do current leases actually rent for vs. the listed asking? Can we see a recent rent roll and the last 12 months of T-12 income?
- It's been on market 165 days. Have you received any prior offers? Is the seller open to a 12% concession, seller financing, or rate buy-down credit?
- What does the HOA fee cover, when was the last increase, and are there any pending special assessments or reserve-fund shortfalls?
- Any open or pending special assessments — roof, HVAC, plumbing, elevator, façade? What's the per-unit balance and payoff schedule, and is the seller paying it off at close or rolling it to the buyer?
- Why hasn't it sold? Are there any deal-killer items the seller is aware of (foundation, flood, title, zoning, code violations)?
- Is there a deadline driving the sale (1031 exchange, divorce, estate, relocation)? That informs how much negotiation room exists.
- Schools are D-rated, which usually means shorter tenancies and higher turnover. Who's the typical renter profile here, and what's been the actual vacancy rate?
- The area grade is low — what's the realistic commute time and amenity access for the typical tenant pool here? Any planned neighborhood developments (good or bad) we should know about?
- What's the average days-on-market for RENTAL listings here right now (not sales)? A rising rental-DOM trend means longer vacancies and softer asking-rent achievability than the comps imply.
- What's the recent tenant-quality profile in this submarket — average credit score on applications, eviction rate, late-payment / NSF rate, and stable-employment percentage? A property-management company in the area should have these aggregated.
- How much new apartment / multifamily construction is in the pipeline within 1–3 miles? Heavy new supply (>2% of stock underway) typically softens rents 12–24 months out; light construction supports rent growth.
Investment metrics
- 1% rule
- 1.02% ✓
- Cap rate
- 5.73%
- Cash-on-cash
- -2.00%
- DSCR
- 0.91
- GRM
- 8.1
CMA / ARV
- ARV (median comp)
- $165,496
- List price
- $165,000
- Delta
- -0.30%
- Verdict
- FAIR
- Comps
- 20 within 1.0 mi
Projected returns pro-forma
-3.0% appreciation · 3.63% rent growth · sell at horizon
- IRR
- -18.6%
- Equity multiple
- 0.34×
- Total profit
- $-30,383
- Equity at exit
- $24,602
- IRR
- -9.3%
- Equity multiple
- 0.40×
- Total profit
- $-27,527
- Equity at exit
- $14,266
Cash invested: $46,200 (down + closing). Projections, not guarantees.
Landlord ↔ Tenant lean methodology
- Overall (STATE)
- 87 Strongly Landlord-Friendly
- State Florida
- 87 Strongly Landlord-Friendly · R+3
- County
- — inherits STATE
- City
- — inherits STATE
ZIP-level market 32504
- Home prices YoY
- -30.9%
- Rents YoY
- 3.6%
- Active inventory
- 172
- Price-to-rent
- 8.1×
Monthly cashflow live
- Estimated rent
- $1,689 high interval (Pro) →
- Mortgage (P&I)
- −$865
- Tax from tax record
- −$190 /mo · $2,278/yr
- Insurance
- −$69
- HOA
- −$288
- Vacancy / Maint / Mgmt
- −$355
- Net cashflow
- $-77
Break-even live
UW: 25.0% down · 7.5% · 30yr · 1.5% tax · 5.0% vac · 8.0% maint · 8.0% mgmt
Financing live
Cash to close
- Down payment
- $41,250
- Closing costs
- $4,950
- Reserves months
- —
- Total cash needed
- —
Loan-product check · same deal, 3 products live
Conventional
25% down · 7.5% · 30yr
- Down + closing
- —
- Monthly P&I
- —
- Monthly cashflow
- —
- DSCR
- —
- Eligible?
- —
Personal DTI + credit; lowest rate.
DSCR
20% down · 8.5% · 30yr
- Down + closing
- —
- Monthly P&I
- —
- Monthly cashflow
- —
- DSCR
- —
- Eligible?
- —
No personal income docs; deal must DSCR.
Hard money
10% down · 12.0% · 12mo
- Down + closing
- —
- Monthly P&I
- —
- Monthly cashflow
- —
- DSCR
- —
- Eligible?
- —
Short-term bridge; refi at stabilization.
Rent comps 24 comps
| Address | Beds | Baths | Sqft | Rent | $/sqft | DOM | Units | Dist |
|---|---|---|---|---|---|---|---|---|
| 7101 Joy St Unit I5 Pensacola, FL | 3.0 | 2.0 | 1183 | $1,950 | $1.65 | 23d | 1 | 0.03mi |
| 6016 Sewell St Pensacola, FL | 3.0 | 1.5 | 1377 | $1,650 | $1.20 | 23d | 1 | 0.28mi |
| 1857 Atwood Dr Pensacola, FL | 1.0–2.0 | 1.0–1.5 | 892 | $1,399 | $1.57 | 23d | 1 | 0.53mi |
| 7322 Mangum Dr Unit 7322 Pensacola, FL | 2.0 | 2.0 | 1100 | $1,450 | $1.32 | 23d | 1 | 0.61mi |
| 7150 Plantation Rd #122 Pensacola, FL | 2.0 | 2.0 | 1092 | $1,500 | $1.37 | 23d | 1 | 0.62mi |
| 7840 Lilac Ln Pensacola, FL | 1.0–3.0 | 1.0–2.0 | 1025 | $1,904 | $1.86 | 14d | 16 | 0.64mi |
| 601 E Burgess Rd Pensacola, FL | 2.0 | 2.0 | 870 | $1,425 | $1.64 | 23d | 1 | 0.74mi |
| 7240 Hilburn Rd Unit 1D Pensacola, FL | 2.0 | 1.0 | 800 | $1,075 | $1.34 | 23d | 1 | 0.78mi |
| 5820 Sanders Ave Apt E Pensacola, FL | 2.0 | 1.0 | 728 | $1,050 | $1.44 | 14d | 1 | 0.79mi |
| 7650 Kipling St Unit 1 Pensacola, FL | 3.0 | 2.0 | 1200 | $1,300 | $1.08 | 23d | 1 | 0.83mi |
| 7650 Kipling St Unit 3 Pensacola, FL | 2.0 | 2.0 | 800 | $1,000 | $1.25 | 23d | 1 | 0.83mi |
| 6003 Born Dr Pensacola, FL | 2.0 | 2.0 | 999 | $1,450 | $1.45 | 21d | 1 | 0.93mi |
| 1843 San Dollar Cir Unit 1843 Pensacola, FL | 2.0 | 1.0 | 920 | $1,400 | $1.52 | 23d | 1 | 0.94mi |
| 6115 N Davis Hwy Pensacola, FL | 1.0–3.0 | 1.0–2.0 | 1112 | $1,825 | $1.64 | 14d | 10 | 0.97mi |
| 3205 E Olive Rd Pensacola, FL | 1.0–2.0 | 1.0–2.0 | 900 | $1,540 | $1.71 | 14d | 8 | 1.23mi |
| 47 Coleman Ln Pensacola, FL | 2.0 | 2.0 | 1036 | $1,650 | $1.59 | 14d | 1 | 1.25mi |
| 700 College Blvd Pensacola, FL | 1.0–2.0 | 1.0–2.0 | 850 | $1,381 | $1.62 | 14d | 9 | 1.27mi |
| 8390 Country Walk Dr Unit B Pensacola, FL | 2.0 | 2.0 | 994 | $1,250 | $1.26 | 23d | 1 | 1.29mi |
| 2106 Schwab Ct Unit B Pensacola, FL | 2.0 | 1.5 | 960 | $1,595 | $1.66 | 14d | 1 | 1.29mi |
| 1040 E Olive Rd Pensacola, FL | 1.0–3.0 | 1.0–2.0 | 897 | $1,644 | $1.83 | 23d | 7 | 1.32mi |
| 711 Underwood Ave Pensacola, FL | 3.0 | 1.0–2.5 | 950 | $1,718 | $1.81 | 14d | 25 | 1.33mi |
| 6409 Concord Way Pensacola, FL | 2.0 | 2.0 | 990 | $2,100 | $2.12 | 23d | 1 | 1.35mi |
| 204 Tree Swallow Dr Pensacola, FL | 3.0 | 2.0 | 1500 | $2,000 | $1.33 | 23d | 1 | 1.45mi |
| 1500 E Johnson Ave #128 Pensacola, FL | 2.0 | 2.0 | 1078 | $1,275 | $1.18 | 23d | 1 | 1.45mi |
HOA detail condo
- Monthly dues
- $288 · $3,456/yr
- Likely covers
- pool
- Assessments
- None detected in remarks — confirm with the listing agent.
Listing history 26 events
-
2026-06-18days on market $165,000 Active 165 DOM
-
2026-06-17days on market $165,000 Active 164 DOM
-
2026-06-16days on market $165,000 Active 163 DOM
-
2026-06-15days on market $165,000 Active 162 DOM
-
2026-06-14days on market $165,000 Active 160 DOM
-
2026-06-10days on market $165,000 Active 157 DOM
-
2026-06-09days on market $165,000 Active 156 DOM
-
2026-06-08days on market $165,000 Active 155 DOM
-
2026-06-07days on market $165,000 Active 154 DOM
-
2026-06-03days on market $165,000 Active 150 DOM
-
2026-06-02days on market $165,000 Active 149 DOM
-
2026-06-01days on market $165,000 Active 148 DOM
-
2026-05-31days on market $165,000 Active 147 DOM
-
2026-05-31days on market $165,000 Active 146 DOM
-
2026-02-17price $165,000 512-char remark
Show marketing remark (512 chars)
Beautiful Condo near EVERYTHING! Davis shopping area, UWF, Cordova Mall, Airports, MAJOR shopping - all within 5-10 minutes or even less! ~ The condo is clean and beautiful with New Luxury Vinyl Plank flooring throughout the entire unit ~ 3 nice-size Bedrooms and 2 Baths ~ High ceilings throughout gives it an open, more spacious feeling! ~ The Living Room is large and the Kitchen is well-featured and open ~ Laundry room ~ Balcony for relaxing ~ Parking is directly in front of the unit *** Community Pool ***
-
2026-01-04$169,000 Active 512-char remark
Show marketing remark (512 chars)
Beautiful Condo near EVERYTHING! Davis shopping area, UWF, Cordova Mall, Airports, MAJOR shopping - all within 5-10 minutes or even less! ~ The condo is clean and beautiful with New Luxury Vinyl Plank flooring throughout the entire unit ~ 3 nice-size Bedrooms and 2 Baths ~ High ceilings throughout gives it an open, more spacious feeling! ~ The Living Room is large and the Kitchen is well-featured and open ~ Laundry room ~ Balcony for relaxing ~ Parking is directly in front of the unit *** Community Pool ***
-
2025-12-10historical $1,525
-
2025-08-27price $1,525
-
2025-08-13price $1,550
-
2025-07-30price $1,600
-
2025-07-01$1,650
-
2019-11-12soldstatus $108,000
-
2019-10-31soldstatus $108,000 516-char remark
Show marketing remark (516 chars)
Cute 3 bedroom and 2 bath condo on second floor conveniently located in northeast Pensacola. This complex is conveniently located within minutes to UWF, West Florida Hospital, Shopping, Interstate, restaurants and so much more. Open floor plan with large foyer to nice sized kitchen and living area with split bedrooms. Washer/ dryer hookups inside and extra storage closet on Balcony in back. The association fees include an inground pool, lawn maintenance, water/sewer and trash services. Call today for your tour.
-
2019-08-15$109,900 516-char remark
Show marketing remark (516 chars)
Cute 3 bedroom and 2 bath condo on second floor conveniently located in northeast Pensacola. This complex is conveniently located within minutes to UWF, West Florida Hospital, Shopping, Interstate, restaurants and so much more. Open floor plan with large foyer to nice sized kitchen and living area with split bedrooms. Washer/ dryer hookups inside and extra storage closet on Balcony in back. The association fees include an inground pool, lawn maintenance, water/sewer and trash services. Call today for your tour.
-
2004-12-15soldstatus $93,500
-
2003-06-05$89,500
ⓘ Source: listings_history table (triggers on properties + properties_extension) + one-shot
backfill from property_details.listing_events for pre-trigger history.
Tax reassessment forecast FL · Resets to sale price
- Current annual tax
- $2,278 · $190/mo
- Projected year-2 tax
- $2,278 · $190/mo
- Expected delta
- $0/yr ($0/mo · 0.0%)
ⓘ Screening estimate from a state-policy table — verify with the county assessor before closing.
Climate risk First Street
- Flood 1/10 Low FEMA zone X (unshaded) · 0% chance over 30 yrs
- Wildfire 1/10 Low
- Heat 10/10 Extreme 7 d/yr ≥106°F today · 22 d/yr by 30 yrs out
- Wind 9/10 Extreme 99% chance of damaging wind over 30 yrs
- Air quality 1/10 Low 0 unhealthy d/yr today · 0 by 30 yrs out
Nearby sold comps map
Loading sold comps map…
Walkable amenities ~0.75 mi
Loading nearby amenities…
Taxation est. · year 1
- Rental income
- $20,273
- − Mortgage interest
- −$9,243
- − Property taxes
- −$2,278
- − Insurance
- −$825
- − Repairs & maintenance
- −$1,622
- − Management
- −$1,622
- − HOA
- −$3,456
- − Depreciation
- −$4,800
- Taxable loss
- −$3,572
- Est. tax savings @ 24.0%
- +$857
- After-tax cash flow
- $-69/yr
For passive investors: Depreciation is non-cash, so a rental often shows a tax loss while cash-flowing — sheltering income. Rental losses are passive: they offset passive income freely, and up to $25,000/yr can offset ordinary (W-2) income if you actively participate and your MAGI is under $100k (phasing out to $0 by $150k); unused losses carry forward. On sale, claimed depreciation is recaptured at up to 25%, and gains may owe capital-gains tax (a 1031 exchange can defer both). Figures are a year-1 estimate at your 24.0% rate — not tax advice; consult a CPA.
Schools (NCES district)
- District
- Escambia
- NCES district ID
- 1200510
- Math proficiency
- 40% ▼ -9.00%
- Reading proficiency
- 45% ▼ -4.00%
- Median HH income
- $44,649
- Composite
- 36.04/100
- National rank
- #4773
- State rank
- #56 of 73 in FL
Livability — Ferry Pass
- Score
- 65/100
- State rank
- #664
- US rank
- #13543
Category grades
Schools grade is shown separately in the Schools card above.
Census & demographics
- Census place
- Ferry Pass, FL
- County
- Escambia County · 301,722 people
- City population
- 43,072
- Metro
- Pensacola-Ferry Pass-Brent, FL
- Population (ZIP)
- 22,153
- Household income
- $72,672
- Rent vs Own
- Severe rent burden
- 533.0
Population outlook (Escambia County) Hauer SSP2
- Today (2025)
- 334,637 people
- By 2030
- 345,779 · +3.3%
- By 2040
- 364,828 · +9.0%
- By 2050
- 378,514 · +13.1%
- By 2075
- 403,220 · +20.5%
- By 2100
- 386,125 · +15.4%
Race, ethnicity, and origin ACS 2023
- Neighborhood character
- Predominantly White (69%)
- Race & ethnicity
- White 69% Black 13% Two or more races 10% Hispanic / Latino 6% Asian 4%
- Hispanic origin (detail)
- Mexican 2%
- Common ancestry
- Lithuanian 3% Italian 2% Slovak 2%
- Foreign-born
- 7% · Canada, China, Jamaica
- Languages at home
- 92% English-only · Spanish 2% Chinese 2% Other Indo-European 1%
Political lean MEDSL · Escambia
- 2024 margin
- R (+19.5) · D 39.7% · R 59.2% · Other 1.1%
- 2008→2024 swing
- -0.2pp no change · 2008: -19.3pp · 2024: -19.5pp
- All cycles
- 2024: R+19.5 2020: R+15.1 2016: R+20.6 2012: R+20.6 2008: R+19.3
Not yet ingested
- Civics
- —
Market trends
- HPI YoY
- ▼ -119.75%
- Current HPI
- 268.2214
- Rent YoY
- ▲ 3.63%
- Metro
- Pensacola-Ferry Pass-Brent, FL
- State GDP YoY
- ▲ 3.28%
- F500 in state
- 36
Industry mix (Fortune 500 HQ in FL)
| Industry | F500 HQs | Revenue |
|---|---|---|
| Industrial Technology | 2 | $29B |
|
||
| Insurance | 2 | $17B |
|
||
| Retail | 1 | $60B |
|
||
| Technology Distribution | 1 | $58B |
|
||
| Homebuilding | 1 | $35B |
|
||
| Technology Manufacturing | 1 | $35B |
|
||
Price history
+84.4% since first listed12 events — show timeline
- 2026-02-17 Price Changed $165,000 PARMLS
- 2026-01-04 Listed $169,000 PARMLS
- 2025-12-10 Rental Removed $1,525 PARMLS
- 2025-08-27 Price Changed $1,525 PARMLS
- 2025-08-13 Price Changed $1,550 PARMLS
- 2025-07-30 Price Changed $1,600 PARMLS
- 2025-07-01 Listed for Rent $1,650 PARMLS
- 2019-11-12 Sold (Public Records) $108,000 Public Records
- 2019-10-31 Sold (MLS) $108,000 PARMLS
- 2019-08-15 Listed $109,900 PARMLS
- 2004-12-15 Sold (MLS) $93,500 PARMLS
- 2003-06-05 Listed $89,500 PARMLS
Property tax history
+10.5%/yrLatest (2025): $2,278 · +14.4% YoY. Source: county tax records.
Cash-flow waterfall
monthlySold comps — $/sqft
last 12 mo · ≤1 miLoading sold comps…