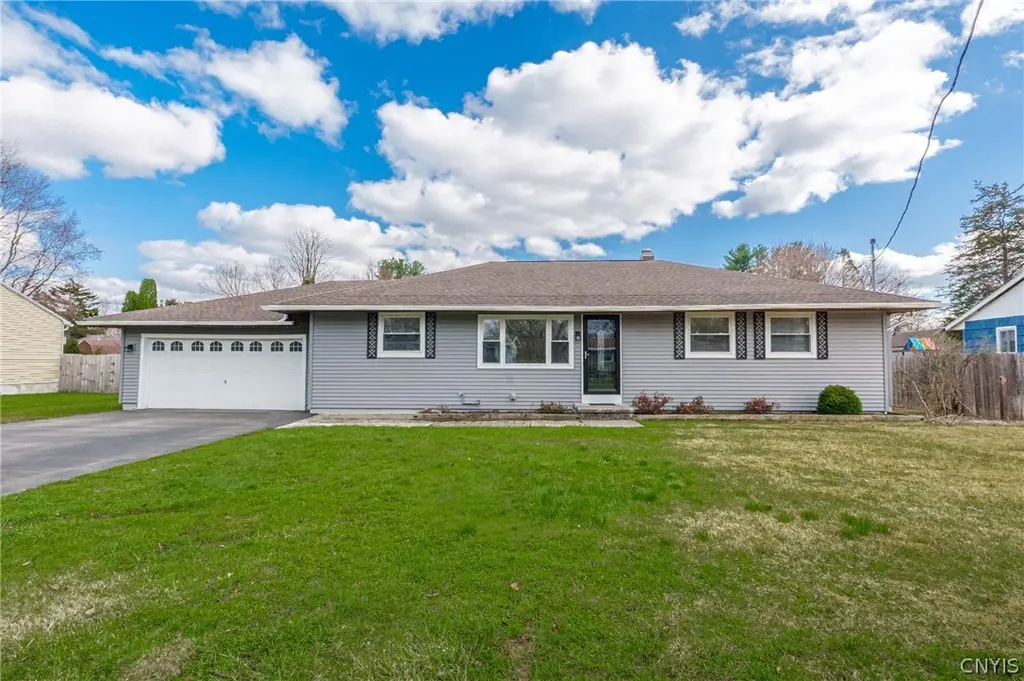
326 Glen Rd N · Rome, NY
Flood risk 4/10 · Minor
- FEMA flood zone
- X (unshaded)
- Chance of flooding over 30 yrs
- 0.22%
- Est. flood insurance / yr
- $473 – $860
Fire risk 1/10 · Minimal
- Est. fire insurance / yr
- $691 – $1,283
Heat risk 3/10 · Minor
- Hot days now (above 94°F)
- 7 days/yr
- Hot days in 30 yrs
- 17 days/yr
Wind risk 1/10 · Minimal
- Chance of severe wind over 30 yrs
- 1.0%
Air-quality risk 2/10 · Minimal
- Unhealthy air days now
- 0 days/yr
- Unhealthy air days in 30 yrs
- 1 days/yr
Risk factors via First Street. Map © Google.
Why this score? — see what drove the C- grade
The composite is a weighted blend of 9 inputs, each scored 0–100. Each bar is that input's sub-score; the figure is the points it added to the 100-point composite (weight × sub-score).
- Cash flow +20.0/30.0
- ARV discount +11.9/15.0
- DSCR +6.3/10.0
- 1% rule +4.9/10.0
- Schools +3.5/10.0
- Livability +3.2/5.0
- Rent growth +2.5/5.0
- Condition / age +2.5/5.0
- Appreciation +0.0/10.0
$239,900
🖨 Deal sheet 📄 Offer letter ✓ Due diligence
Listing remarks MLS
This 3 bedroom/1.5 bath ranch (with a hard-to-find 2 stall garage) has endless possibilities! The mudroom area is well thought out and can have an ultimate purpose in this home. A manicured yard can be enjoyed on a beautiful and spacious screened and covered deck! Use the basement area for crafts or turn it into the ultimate "man cave"! Make your appointment today to see this home where pride of ownership shines!!!
Key facts
- Quartz countertops
- Newer shed
- Flat open yard
Tags
Neighborhood map
What this means for you Summary
Snapshot
- This is a 3-bed/1.5-bath single-family listed at $240k.
Deal economics
- At list price, monthly cash flow is $293 ($4k/yr) — positive.
- The deal already cash-flows at list — no discount required.
- To meet the 1% rule (rent ≥ 1% of price), the offer needs to be $237k (1.3% below list).
- Recommended offer: $237k (1.3% below list) — sets the bar for 1% rule.
- Cap rate 7.8% vs local median 5.6% in Rome — top-decile yield for the area; either an underpriced asset or a hidden risk that comps aren't pricing in. Stress-test before assuming the spread holds.
Location & tenants
- Location reads 64/100 on livability (#722 in NY) — a middle-class / working-renter tenant base. Strengths: cost of living A+, housing A+; Watch: health & safety C-, schools F, amenities F.
- Rome City School District (town): math 35% / reading 46% proficiency, ranked #516 of 590 in NY (top 88%) — families likely to look elsewhere, expect single-tenant / working-renter base with shorter leases.
- Market conditions: 272 active listings in the ZIP; 2 comparable units currently listed for rent nearby; 204 units permitted in Oneida County in 2024 (68 in 5+ unit buildings).
Forward outlook
- Local home prices are declining (-3.0%/yr); year-one equity from $2k of loan paydown is wiped out by about $7k of value loss. Plan a longer hold.
- Oneida County population projected at -12% by 2050 — secular population decline; favor cash flow + early exit over multi-decade hold.
Negotiation context
- Only 7 days on market — expect competitive offers; lowballing is unlikely to land.
- 3 sale attempts since 9y ago with the ask held roughly flat each time — persistent listings suggest the price (not the market) is what's stuck; bring a comps-based counter.
- Current owner paid $125k; list at $240k implies a 92% gain — meaningful room to come down on a strong offer.
Risks & watch-outs
- Watch-outs: built in 1958 — expect roof / HVAC / electrical / plumbing capex.
Questions for the listing agent
- Built in 1958 — when were the roof, HVAC, electrical panel, plumbing, and water heater last replaced?
- Is there a deadline driving the sale (1031 exchange, divorce, estate, relocation)? That informs how much negotiation room exists.
- Schools are F-rated, which usually means shorter tenancies and higher turnover. Who's the typical renter profile here, and what's been the actual vacancy rate?
- What's the average days-on-market for RENTAL listings here right now (not sales)? A rising rental-DOM trend means longer vacancies and softer asking-rent achievability than the comps imply.
- What's the recent tenant-quality profile in this submarket — average credit score on applications, eviction rate, late-payment / NSF rate, and stable-employment percentage? A property-management company in the area should have these aggregated.
- How much new for-sale + rental construction is in the pipeline within 1–3 miles? Heavy new supply typically softens prices + rents 12–24 months out; constrained supply supports both.
Investment metrics
- 1% rule
- 0.99% ✗
- Cap rate
- 7.76%
- Cash-on-cash
- 5.24%
- DSCR
- 1.23
- GRM
- 8.4
CMA / ARV
- ARV (on-the-fly)
- $265,845
- Comps found
- 8
Show comp detail 8 sales within ~0.75 mi
| Address | Dist | Beds/Ba | Sqft | Sold | Price | $/sf | Match |
|---|---|---|---|---|---|---|---|
| 6604 Seville Dr | 0.29mi | 4/1.5 (+1) | 1,491 (+4%) | 8mo | $244,900 | $164 | 69 |
| 7933 Turin Rd | 0.72mi | 2/1.5 (-1) | 1,425 (-1%) | 7mo | $240,000 | $168 | 54 |
| 6410 Edgewood Dr | 0.22mi | 4/1.5 (+1) | 1,650 (+15%) | 11mo | $304,004 | $184 | 51 |
| 6593 Bishopp Rd | 0.31mi | 3/2.0 | 1,600 (+11%) | 21mo | $242,500 | $152 | 47 |
| 8102 Buena Vista Dr | 0.56mi | 3/2.0 | 1,248 (-13%) | 9mo | $269,900 | $216 | 43 |
| 8275 Elmer Hill Rd | 0.56mi | 3/1.0 | 1,243 (-14%) | 15mo | $230,000 | $185 | 37 |
| 8115 Rome Westernville Rd | 0.72mi | 4/1.5 (+1) | 1,577 (+10%) | 12mo | $335,000 | $212 | 35 |
| 8330 Turin Rd | 0.69mi | 4/2.0 (+1) | 1,224 (-15%) | 21mo | $230,000 | $188 | 19 |
Match score weights: distance 35% · size 25% · config 20% · recency 20%. Top-matched comps best support the ARV.
Projected returns pro-forma
-3.0% appreciation · 3.0% rent growth · sell at horizon
- IRR
- -8.2%
- Equity multiple
- 0.70×
- Total profit
- $-20,214
- Equity at exit
- $35,770
- IRR
- 1.3%
- Equity multiple
- 1.10×
- Total profit
- $6,387
- Equity at exit
- $20,742
Cash invested: $67,172 (down + closing). Projections, not guarantees.
Landlord ↔ Tenant lean methodology
- Overall (STATE)
- 15 Strongly Tenant-Friendly
- State New York
- 15 Strongly Tenant-Friendly · D+10
- County
- — inherits STATE
- City
- — inherits STATE
ZIP-level market 13440
- Home prices YoY
- -8.0%
- Active inventory
- 272
- Price-to-rent
- 8.4×
Monthly cashflow live
- Estimated rent
- $2,367 medium interval (Pro) →
- Mortgage (P&I)
- −$1,258
- Tax from tax record
- −$219 /mo · $2,624/yr
- Insurance
- −$100
- HOA
- −$0
- Vacancy / Maint / Mgmt
- −$497
- Net cashflow
- $293
Break-even live
UW: 25.0% down · 7.5% · 30yr · 1.5% tax · 5.0% vac · 8.0% maint · 8.0% mgmt
Financing live
Cash to close
- Down payment
- $59,975
- Closing costs
- $7,197
- Reserves months
- —
- Total cash needed
- —
Loan-product check · same deal, 3 products live
Conventional
25% down · 7.5% · 30yr
- Down + closing
- —
- Monthly P&I
- —
- Monthly cashflow
- —
- DSCR
- —
- Eligible?
- —
Personal DTI + credit; lowest rate.
DSCR
20% down · 8.5% · 30yr
- Down + closing
- —
- Monthly P&I
- —
- Monthly cashflow
- —
- DSCR
- —
- Eligible?
- —
No personal income docs; deal must DSCR.
Hard money
10% down · 12.0% · 12mo
- Down + closing
- —
- Monthly P&I
- —
- Monthly cashflow
- —
- DSCR
- —
- Eligible?
- —
Short-term bridge; refi at stabilization.
Rent comps 2 comps
| Address | Beds | Baths | Sqft | Rent | $/sqft | DOM | Units | Dist |
|---|---|---|---|---|---|---|---|---|
| 7805 Merrick Rd Unit 201 Rome, NY | 2.0 | 2.0 | 1200 | $2,000 | $1.67 | 43d | 1 | 1.20mi |
| 251 Liam Ln Unit 251 Rome, NY | 3.0 | 2.0 | 1577 | $2,750 | $1.74 | 43d | 1 | 1.37mi |
Listing history 6 events
-
2026-04-17status Pending
-
2026-04-10$239,900 Active
-
2017-08-21soldstatus $125,000 433-char remark
Show marketing remark (433 chars)
This 3 bedroom/1.5 bath ranch (with a hard-to-find 2 stall garage) has endless possibilities! The mudroom area is well thought out and can have an ultimate purpose in this home. A manicured yard can be enjoyed on a beautiful and spacious screened and covered deck! Use the basement area for crafts or turn it into the ultimate "man cave"! Make your appointment today to see this home where pride of ownership shines!!!
-
2017-08-14soldstatus $125,000
-
2017-06-09$121,500 433-char remark
Show marketing remark (433 chars)
This 3 bedroom/1.5 bath ranch (with a hard-to-find 2 stall garage) has endless possibilities! The mudroom area is well thought out and can have an ultimate purpose in this home. A manicured yard can be enjoyed on a beautiful and spacious screened and covered deck! Use the basement area for crafts or turn it into the ultimate "man cave"! Make your appointment today to see this home where pride of ownership shines!!!
-
2017-05-30$126,000
ⓘ Source: listings_history table (triggers on properties + properties_extension) + one-shot
backfill from property_details.listing_events for pre-trigger history.
Tax reassessment forecast NY · Partial reset (capped growth)
- Current annual tax
- $2,624 · $219/mo
- Projected year-2 tax
- $3,339 · $278/mo
- Expected delta
- +$715/yr (+$60/mo · 27.3%)
ⓘ Screening estimate from a state-policy table — verify with the county assessor before closing.
Climate risk First Street
- Flood 4/10 Moderate FEMA zone X (unshaded) · 22% chance over 30 yrs
- Wildfire 1/10 Low
- Heat 3/10 Moderate 7 d/yr ≥94°F today · 17 d/yr by 30 yrs out
- Wind 1/10 Low 100% chance of damaging wind over 30 yrs
- Air quality 2/10 Low 0 unhealthy d/yr today · 1 by 30 yrs out
Nearby sold comps map
Loading sold comps map…
Walkable amenities ~0.75 mi
Loading nearby amenities…
Taxation est. · year 1
- Rental income
- $28,404
- − Mortgage interest
- −$13,438
- − Property taxes
- −$2,624
- − Insurance
- −$1,200
- − Repairs & maintenance
- −$2,272
- − Management
- −$2,272
- − Depreciation
- −$6,979
- Taxable loss
- −$382
- Est. tax savings @ 24.0%
- +$92
- After-tax cash flow
- $3,610/yr
For passive investors: Depreciation is non-cash, so a rental often shows a tax loss while cash-flowing — sheltering income. Rental losses are passive: they offset passive income freely, and up to $25,000/yr can offset ordinary (W-2) income if you actively participate and your MAGI is under $100k (phasing out to $0 by $150k); unused losses carry forward. On sale, claimed depreciation is recaptured at up to 25%, and gains may owe capital-gains tax (a 1031 exchange can defer both). Figures are a year-1 estimate at your 24.0% rate — not tax advice; consult a CPA.
Schools (NCES district)
- District
- Rome City School District
- NCES district ID
- 3624900
- Math proficiency
- 35% ▼ -4.00%
- Reading proficiency
- 46% ▲ 10.00%
- Median HH income
- $46,406
- Composite
- 34.52/100
- National rank
- #5178
- State rank
- #516 of 590 in NY
Livability — Rome
- Score
- 64/100
- State rank
- #722
- US rank
- #13676
Category grades
Schools grade is shown separately in the Schools card above.
Census & demographics
- Census place
- Rome, NY
- City population
- 41,418
- Population (ZIP)
- 41,273
Population outlook (Oneida County) Hauer SSP2
- Today (2025)
- 225,223 people
- By 2030
- 220,384 · -2.1%
- By 2040
- 209,071 · -7.2%
- By 2050
- 197,920 · -12.1%
- By 2075
- 175,541 · -22.1%
- By 2100
- 148,491 · -34.1%
Race, ethnicity, and origin ACS 2023
- Neighborhood character
- Predominantly White (82%)
- Race & ethnicity
- White 82% Hispanic / Latino 7% Two or more races 6% Black 4% Asian 1%
- Hispanic origin (detail)
- Mexican 1% Puerto Rican 4%
- Common ancestry
- Romanian 9% Lithuanian 4% Slovak 1%
- Foreign-born
- 3% · Canada, China
- Languages at home
- 94% English-only · Spanish 3% Other Indo-European 1%
Political lean MEDSL · Oneida
- 2024 margin
- Strong R (+21.3) · D 39.4% · R 60.6%
- 2008→2024 swing
- -15.2pp toward R · 2008: -6.1pp · 2024: -21.3pp
- All cycles
- 2024: R+21.3 2020: R+15.5 2016: R+21.1 2012: R+5.3 2008: R+6.1
Not yet ingested
- Civics
- —
Market trends
- HPI YoY
- ▼ -29.58%
- Current HPI
- 339.3589
- Rent YoY
- —
- Metro
- —
- State GDP YoY
- ▲ 2.60%
- F500 in state
- 92
Industry mix (Fortune 500 HQ in NY)
| Industry | F500 HQs | Revenue |
|---|---|---|
| Financial Services | 10 | $950B |
|
||
| Consumer Goods | 9 | $162B |
|
||
| Insurance | 4 | $225B |
|
||
| Telecommunications | 2 | $144B |
|
||
| Pharmaceuticals | 2 | $112B |
|
||
| Media / Entertainment | 2 | $69B |
|
||
Price history
+90.4% since first listed6 events — show timeline
- 2026-04-17 Pending — CNYIS
- 2026-04-10 Listed $239,900 CNYIS
- 2017-08-21 Sold (MLS) $125,000 CNYIS
- 2017-08-14 Sold (Public Records) $125,000 Public Records
- 2017-06-09 Listed $121,500 CNYIS
- 2017-05-30 Listed $126,000 CNYIS
Property tax history
+1.3%/yrLatest (2025): $2,624 · +0.1% YoY. Source: county tax records.
Cash-flow waterfall
monthlySold comps — $/sqft
last 12 mo · ≤1 miLoading sold comps…