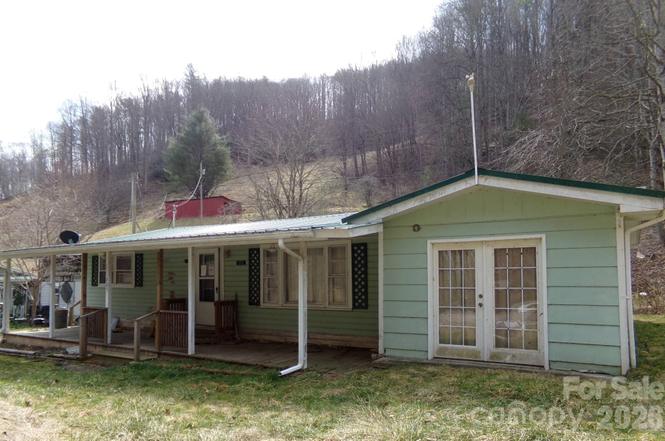
1905 Little Creek Rd · Banner Hill, TN
Flood risk 10/10 · Severe
- FEMA flood zone
- X (unshaded)
- Chance of flooding over 30 yrs
- 0.99%
- Est. flood insurance / yr
- $473 – $860
Fire risk 5/10 · Moderate
- Est. fire insurance / yr
- $906 – $1,684
Heat risk 2/10 · Minimal
- Hot days now (above 92°F)
- 7 days/yr
- Hot days in 30 yrs
- 22 days/yr
Wind risk 2/10 · Minimal
- Chance of severe wind over 30 yrs
- —
Air-quality risk 3/10 · Minor
- Unhealthy air days now
- 3 days/yr
- Unhealthy air days in 30 yrs
- 3 days/yr
Risk factors via First Street. Map © Google.
Why this score? — see what drove the B- grade
The composite is a weighted blend of 9 inputs, each scored 0–100. Each bar is that input's sub-score; the figure is the points it added to the 100-point composite (weight × sub-score).
- Cash flow +30.0/30.0
- 1% rule +10.0/10.0
- DSCR +10.0/10.0
- ARV discount +7.5/15.0
- Schools +4.5/10.0
- Livability +3.0/5.0
- Rent growth +2.5/5.0
- Condition / age +2.5/5.0
- Appreciation +0.0/10.0
$74,900
🖨 Deal sheet 📄 Offer letter ✓ Due diligence
Listing remarks
Enjoy one level living with this ranch style home. Relax on the front porch overlooking a babbling creek. Home sold as is with no representations by seller or broker. Buyer is advised to discover and confirm any and all information included this listing and in regards to the property.
Key facts
- Babbling creek
- Front porch
- 0.52 acre lot
Tags
Property features AI
Finance
- HOA & community: No HOA
Exterior
- Parking: Driveway parking
- Utilities: Water source described as 'Other' (see remarks); Sewer described as 'Other' (see remarks)
- Home design: Single-family residential property; Site-built construction; One story (single level); Entry and living primarily on the main level
- Construction: Vinyl exterior; Crawl space foundation
- Exterior features: Lot approximately 0.52 acres; Road surfaces include gravel and paved; Property located on a publicly maintained road
Interior
- Kitchen: Appliances listed as 'Other' (see remarks)
- Bedrooms: Two bedrooms on the main level
- Bathrooms: One full bathroom on the main level
- Heating & cooling: Heating described as 'Other' (see remarks); Cooling described as 'Other' (see remarks)
- Interior features: Open room count: 1; Additional interior features described as 'Other' (see remarks)
- Laundry & utility: Laundry described as 'Other' (see remarks)
Neighborhood map
What this means for you Summary
Snapshot
- This is a 2-bed/1.0-bath single-family listed at $75k.
Deal economics
- At list price, monthly cash flow is $803 ($10k/yr) — positive.
- The deal already cash-flows at list — no discount required.
- Meets the 1% rule at list price ($2k rent vs $75k).
- Recommended offer: $66k (12.0% below list) — sets the bar for market timing.
Location & tenants
- Location reads 60/100 on livability (#278 in TN) — a middle-class / working-renter tenant base. Strengths: cost of living A+, housing A+, crime A-; Watch: schools F, amenities F, commute F.
- Yancey County Schools (rural): math 55% / reading 52% proficiency, ranked #56 of 178 in NC (top 32%) — acceptable for families but not a draw, mixed tenant base, ~2y average lease.
- Market conditions: 100 units permitted in Yancey County in 2024 (0 in 5+ unit buildings).
Forward outlook
- Local home prices are declining (-3.0%/yr); year-one equity from $518 of loan paydown is wiped out by about $2k of value loss. Plan a longer hold.
- Yancey County population projected at -20% by 2050 — secular population decline; favor cash flow + early exit over multi-decade hold.
- At projected returns (-3.0% appreciation + 3.0% rent growth), your $21k cash investment doubles in ~3 years — after that, you're playing with house money.
Negotiation context
- It's been on market 267 days — a 12% lower offer ($66k) is reasonable based on typical stale-listing flexibility.
Risks & watch-outs
- Watch-outs: flood insurance adds $56/mo.
- Climate carrying-cost: severe flood risk; moderate wildfire risk — expect insurance premiums to compound above CPI over the hold.
Questions for the listing agent
- It's been on market 267 days. Have you received any prior offers? Is the seller open to a 12% concession, seller financing, or rate buy-down credit?
- Built in 1960 — when were the roof, HVAC, electrical panel, plumbing, and water heater last replaced?
- What's the actual annual flood-insurance premium (NFIP or private), and is the property in a SFHA with mandatory coverage?
- Why hasn't it sold? Are there any deal-killer items the seller is aware of (foundation, flood, title, zoning, code violations)?
- Is there a deadline driving the sale (1031 exchange, divorce, estate, relocation)? That informs how much negotiation room exists.
- Schools are F-rated, which usually means shorter tenancies and higher turnover. Who's the typical renter profile here, and what's been the actual vacancy rate?
- What's the average days-on-market for RENTAL listings here right now (not sales)? A rising rental-DOM trend means longer vacancies and softer asking-rent achievability than the comps imply.
- What's the recent tenant-quality profile in this submarket — average credit score on applications, eviction rate, late-payment / NSF rate, and stable-employment percentage? A property-management company in the area should have these aggregated.
- How much new for-sale + rental construction is in the pipeline within 1–3 miles? Heavy new supply typically softens prices + rents 12–24 months out; constrained supply supports both.
Investment metrics
- 1% rule
- 2.25% ✓
- Cap rate
- 20.05%
- Cash-on-cash
- 49.14%
- DSCR
- 3.19
- GRM
- 3.7
CMA / ARV
No comps found within radius.
Projected returns pro-forma
-3.0% appreciation · 3.0% rent growth · sell at horizon
- IRR
- 43.2%
- Equity multiple
- 2.86×
- Total profit
- $39,059
- Equity at exit
- $11,168
- IRR
- 49.2%
- Equity multiple
- 5.77×
- Total profit
- $100,021
- Equity at exit
- $6,476
Cash invested: $20,972 (down + closing). Projections, not guarantees.
Landlord ↔ Tenant lean methodology
- Overall (STATE)
- 87 Strongly Landlord-Friendly
- State Tennessee
- 87 Strongly Landlord-Friendly · R+13
- County
- — inherits STATE
- City
- — inherits STATE
ZIP-level market 28714
- Home prices YoY
- -9.3%
- Price-to-rent
- 3.7×
Monthly cashflow live
- Estimated rent
- $1,684 medium interval (Pro) →
- Mortgage (P&I)
- −$393
- Tax from tax record
- −$48 /mo · $573/yr
- Insurance
- −$31
- Flood insurance flood zone
- −$56 /mo · $666/yr
- HOA
- −$0
- Vacancy / Maint / Mgmt
- −$354
- Net cashflow
- $803
Break-even live
UW: 25.0% down · 7.5% · 30yr · 1.5% tax · 5.0% vac · 8.0% maint · 8.0% mgmt
Financing live
Cash to close
- Down payment
- $18,725
- Closing costs
- $2,247
- Reserves months
- —
- Total cash needed
- —
Loan-product check · same deal, 3 products live
Conventional
25% down · 7.5% · 30yr
- Down + closing
- —
- Monthly P&I
- —
- Monthly cashflow
- —
- DSCR
- —
- Eligible?
- —
Personal DTI + credit; lowest rate.
DSCR
20% down · 8.5% · 30yr
- Down + closing
- —
- Monthly P&I
- —
- Monthly cashflow
- —
- DSCR
- —
- Eligible?
- —
No personal income docs; deal must DSCR.
Hard money
10% down · 12.0% · 12mo
- Down + closing
- —
- Monthly P&I
- —
- Monthly cashflow
- —
- DSCR
- —
- Eligible?
- —
Short-term bridge; refi at stabilization.
Listing history 23 events
-
2026-06-18days on market $74,900 Active 267 DOM
-
2026-06-17days on market $74,900 Active 266 DOM
-
2026-06-16days on market $74,900 Active 265 DOM
-
2026-06-15days on market $74,900 Active 264 DOM
-
2026-06-14days on market $74,900 Active 262 DOM
-
2026-06-13days on market $74,900 Active 261 DOM
-
2026-06-10pricedays on market $74,900 Active 259 DOM
-
2026-06-09days on market $76,900 Active 258 DOM
-
2026-06-08days on market $76,900 Active 257 DOM
-
2026-06-07days on market $76,900 Active 256 DOM
-
2026-06-03days on market $76,900 Active 252 DOM
-
2026-06-02days on market $76,900 Active 251 DOM
-
2026-06-01days on market $76,900 Active 250 DOM
-
2026-05-31days on market $76,900 Active 249 DOM
-
2026-05-30days on market $76,900 Active 248 DOM
-
2026-04-28price $76,900
-
2026-03-16price $77,900
-
2026-01-13price $79,900
-
2025-12-10price $84,900
-
2025-11-04price $89,900
-
2025-10-21price $99,900
-
2025-10-09price $114,900
-
2025-09-24$124,900 Active
ⓘ Source: listings_history table (triggers on properties + properties_extension) + one-shot
backfill from property_details.listing_events for pre-trigger history.
Tax reassessment forecast TN · Resets to sale price
- Current annual tax
- $573 · $48/mo
- Projected year-2 tax
- $573 · $48/mo
- Expected delta
- $0/yr ($0/mo · 0.0%)
ⓘ Screening estimate from a state-policy table — verify with the county assessor before closing.
Climate risk First Street
- Flood 10/10 Extreme FEMA zone X (unshaded) · 99% chance over 30 yrs
- Wildfire 5/10 Major
- Heat 2/10 Low 7 d/yr ≥92°F today · 22 d/yr by 30 yrs out
- Wind 2/10 Low
- Air quality 3/10 Moderate 3 unhealthy d/yr today · 3 by 30 yrs out
Nearby sold comps map
Loading sold comps map…
Walkable amenities ~0.75 mi
Loading nearby amenities…
Taxation est. · year 1
- Rental income
- $20,212
- − Mortgage interest
- −$4,196
- − Property taxes
- −$573
- − Insurance
- −$1,041
- − Repairs & maintenance
- −$1,617
- − Management
- −$1,617
- − Depreciation
- −$2,179
- Taxable income
- $8,989
- Est. tax owed @ 24.0%
- −$2,157
- After-tax cash flow
- $7,482/yr
For passive investors: Depreciation is non-cash, so a rental often shows a tax loss while cash-flowing — sheltering income. Rental losses are passive: they offset passive income freely, and up to $25,000/yr can offset ordinary (W-2) income if you actively participate and your MAGI is under $100k (phasing out to $0 by $150k); unused losses carry forward. On sale, claimed depreciation is recaptured at up to 25%, and gains may owe capital-gains tax (a 1031 exchange can defer both). Figures are a year-1 estimate at your 24.0% rate — not tax advice; consult a CPA.
Schools (NCES district)
- District
- Yancey County Schools
- NCES district ID
- 3705070
- Math proficiency
- 55% ▲ 6.00%
- Reading proficiency
- 52% ▲ 5.00%
- Median HH income
- $37,576
- Composite
- 44.52/100
- National rank
- #2795
- State rank
- #56 of 178 in NC
Livability — Banner Hill
- Score
- 60/100
- State rank
- #278
- US rank
- #19501
Category grades
Schools grade is shown separately in the Schools card above.
Census & demographics
- Population (ZIP)
- 16,621
Population outlook (Yancey County) Hauer SSP2
- Today (2025)
- 16,797 people
- By 2030
- 16,215 · -3.5%
- By 2040
- 14,830 · -11.7%
- By 2050
- 13,469 · -19.8%
- By 2075
- 10,583 · -37.0%
- By 2100
- 7,497 · -55.4%
Race, ethnicity, and origin ACS 2023
- Neighborhood character
- Predominantly White (91%)
- Race & ethnicity
- White 91% Hispanic / Latino 6% Two or more races 4%
- Hispanic origin (detail)
- Mexican 4%
- Common ancestry
- Serbian 6% Italian 4% Slovak 3%
- Foreign-born
- 3% · Canada
- Languages at home
- 95% English-only · Spanish 4%
Political lean MEDSL · Yancey
- 2024 margin
- Solid R (+34.4) · D 32.3% · R 66.8%
- 2008→2024 swing
- -28.7pp toward R · 2008: -5.8pp · 2024: -34.4pp
- All cycles
- 2024: R+34.4 2020: R+33.7 2016: R+32.5 2012: R+13.9 2008: R+5.8
Not yet ingested
- Civics
- —
Market trends
- HPI YoY
- ▼ -30.39%
- Current HPI
- 297.9461
- Rent YoY
- —
- Metro
- —
- State GDP YoY
- ▲ 2.78%
- F500 in state
- 22
Industry mix (Fortune 500 HQ in TN)
| Industry | F500 HQs | Revenue |
|---|---|---|
| Healthcare | 3 | $91B |
|
||
| Retail | 3 | $72B |
|
||
| Transportation / Logistics | 1 | $88B |
|
||
| Paper / Packaging | 1 | $19B |
|
||
| Insurance | 1 | $13B |
|
||
| Energy | 1 | $12B |
|
||
Price history
-38.4% since first listed8 events — show timeline
- 2026-04-28 Price Changed $76,900 CANOPYMLS as Distributed by MLS Grid
- 2026-03-16 Price Changed $77,900 CANOPYMLS as Distributed by MLS Grid
- 2026-01-13 Price Changed $79,900 CANOPYMLS as Distributed by MLS Grid
- 2025-12-10 Price Changed $84,900 CANOPYMLS as Distributed by MLS Grid
- 2025-11-04 Price Changed $89,900 CANOPYMLS as Distributed by MLS Grid
- 2025-10-21 Price Changed $99,900 CANOPYMLS as Distributed by MLS Grid
- 2025-10-09 Price Changed $114,900 CANOPYMLS as Distributed by MLS Grid
- 2025-09-24 Listed $124,900 CANOPYMLS as Distributed by MLS Grid
Property tax history
+12.4%/yrLatest (2025): $573 · +0.0% YoY. Source: county tax records.
Cash-flow waterfall
monthlySold comps — $/sqft
last 12 mo · ≤1 miLoading sold comps…