533 NE 3rd Ave #321 · Fort Lauderdale, FL
Flood risk 6/10 · Moderate
- FEMA flood zone
- AH
- Chance of flooding over 30 yrs
- 0.54%
- Est. flood insurance / yr
- $1,142 – $2,507
Fire risk 1/10 · Minimal
- Est. fire insurance / yr
- $947 – $1,759
Heat risk 10/10 · Severe
- Hot days now (above 105°F)
- 7 days/yr
- Hot days in 30 yrs
- 25 days/yr
Wind risk 10/10 · Severe
- Chance of severe wind over 30 yrs
- 99.0%
Air-quality risk 2/10 · Minimal
- Unhealthy air days now
- 1 days/yr
- Unhealthy air days in 30 yrs
- 1 days/yr
Risk factors via First Street. Map © Google.
Why this score? — see what drove the D grade
The composite is a weighted blend of 9 inputs, each scored 0–100. Each bar is that input's sub-score; the figure is the points it added to the 100-point composite (weight × sub-score).
- ARV discount +7.5/15.0
- Appreciation +7.3/10.0
- Cash flow +7.2/30.0
- 1% rule +6.4/10.0
- Schools +4.1/10.0
- Livability +4.1/5.0
- Rent growth +3.3/5.0
- Condition / age +2.5/5.0
- DSCR +1.3/10.0
$259,500
🖨 Deal sheet (PDF) 📄 Offer letter ✓ Due diligence
Listing remarks
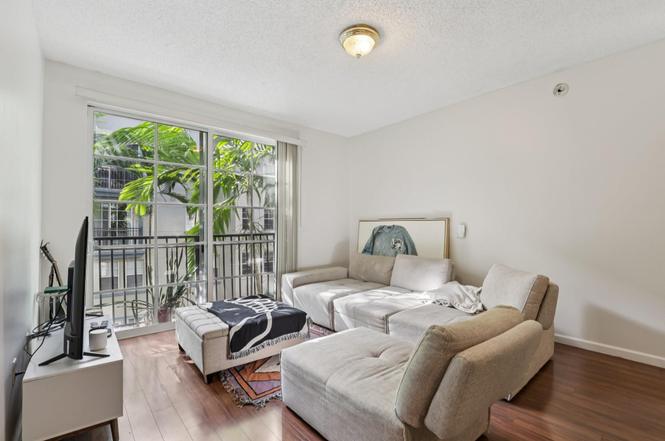
Great investment opportunity or ideal option for an owner-occupant, featuring the largest 1 bedroom plus den floor plan. The unit offers a walk-in kitchen with a washer and dryer closet and peaceful atrium views with a water fountain visible from every window. Spacious living and dining areas are complemented by a separate den ideal for a home office or additional sleeping area. The large bedroom includes a walk-in closet, and the bathroom offers ample cabinetry. The building features a pool, clubhouse, fitness center, elegant lobby with on-site management, covered garage parking, a beautifully maintained atrium courtyard with fountains, and secured gated entry. Located close to Las Olas di
Key facts
- Walk-in closet
- Separate den
- Walk-in kitchen
Tags
Property features AI
Finance
- Other: Directions: GPS
- Financial info: Pets allowed with restrictions (breed, number, and size limits)
- HOA & community: Monthly HOA fee; Association amenities include fitness center, pool, picnic area, business center, trash chute, and maintenance; HOA covers maintenance of structure, roof repairs, pool service, common areas, water, sewer and trash
Exterior
- Parking: 1-car garage; 1 covered parking space; Guest parking available
- Security: Key card entry; Security system; Entry phone/intercom
- Utilities: Cable available; Sewer and water included in association fees
- Home design: Condominium; Resale unit; 5-story building; Entry on first floor
- Construction: Block construction
- Exterior features: First-floor entry; Not waterfront
Interior
- Kitchen: Dishwasher; Electric range; Refrigerator
- Bedrooms: 2 bedrooms on the main level
- Flooring: Ceramic tile; Laminate
- Bathrooms: 1 full bathroom
- Heating & cooling: Central heating; Central air conditioning
- Interior features: Key card entry, security system, and phone/intercom entry; Electric water heater; Disposal
- Laundry & utility: Washer/Dryer connections (standard condominium utilities included in association amenities)
Neighborhood map
What this means for you Summary
Snapshot
- This is a 2-bed/1.0-bath condo listed at $260k.
Deal economics
- At list price, monthly cash flow is $-513 ($-6k/yr) — negative.
- To cash-flow at today's rent, offer at most $169k (34.9% below list).
- Meets the 1% rule at list price ($3k rent vs $260k).
- Recommended offer: $169k (34.9% below list) — sets the bar for cash-flow.
- Cap rate 4.6% vs local median 2.2% in Fort Lauderdale — top-decile yield for the area; either an underpriced asset or a hidden risk that comps aren't pricing in. Stress-test before assuming the spread holds.
Location & tenants
- Location reads 82/100 on livability (#78 in FL, #1,293 nationally) — a professional / high-income tenant draw. Strengths: crime A+, amenities A+, health & safety A+; Watch: cost of living D-.
- Broward (suburban): math 42% / reading 53% proficiency, ranked #46 of 73 in FL (top 63%) — families likely to look elsewhere, expect single-tenant / working-renter base with shorter leases.
- Zoned schools: Walker Elementary School (math 17% / reading 18%, grade F, #2,117 of 2,144 statewide, top 99%, 539 students, 92% FRL); Sunrise Middle School (math 50% / reading 52%, grade C, #237 of 571 statewide, top 43%, 1,242 students, 64% FRL); Fort Lauderdale High School (math 38% / reading 67%, grade C-, #154 of 667 statewide, top 24%, 2,228 students, 57% FRL) — zoned schools average 71% FRL vs 51% district-wide (20 pts higher); higher-poverty schools than district average — tighter screening recommended.
- Market conditions: Rents rising (+3.0%/yr); 474 active listings in the ZIP; 40 comparable units currently listed for rent nearby; rentals leasing fast (median 10d on market — plan ~1-2 weeks tenant-placement turnaround); high-income renter base; 2,111 units permitted in Broward County in 2024 (1,265 in 5+ unit buildings).
Forward outlook
- In year one you build about $14k of equity ($2k loan paydown + $12k appreciation (4.6% local appreciation)).
- Broward County population projected at +34% by 2050 — long-run rental-demand tailwind backs the buy-and-hold thesis.
- By year 3, paydown + projected appreciation supports a ~$34k cash-out refi (75% LTV) — recoverable capital for the next deal without selling this one.
Negotiation context
- It's been on market 102 days — a 9% lower offer ($236k) is reasonable based on typical stale-listing flexibility.
- 4 sale attempts since 11y ago; this cycle's ask has dropped $24k (8%) from the opening price — seller is motivated, your offer sets the floor, not the list.
Risks & watch-outs
- Watch-outs: flood insurance adds $152/mo; HOA is 24% of rent.
- Climate carrying-cost: in FEMA flood zone AH (mandatory federal flood insurance); severe wind risk, 99% chance of damaging wind over 30y; extreme-heat days projected 7→25/yr by 2055 (HVAC capex compounding) — expect insurance premiums to compound above CPI over the hold.
Questions for the listing agent
- What do current leases actually rent for vs. the listed asking? Can we see a recent rent roll and the last 12 months of T-12 income?
- It's been on market 102 days. Have you received any prior offers? Is the seller open to a 35% concession, seller financing, or rate buy-down credit?
- What's the actual annual flood-insurance premium (NFIP or private), and is the property in a SFHA with mandatory coverage?
- What does the HOA fee cover, when was the last increase, and are there any pending special assessments or reserve-fund shortfalls?
- Any open or pending special assessments — roof, HVAC, plumbing, elevator, façade? What's the per-unit balance and payoff schedule, and is the seller paying it off at close or rolling it to the buyer?
- Why hasn't it sold? Are there any deal-killer items the seller is aware of (foundation, flood, title, zoning, code violations)?
- Is there a deadline driving the sale (1031 exchange, divorce, estate, relocation)? That informs how much negotiation room exists.
- Schools are B-rated — typically a magnet for longer-tenancy family renters. What's the average tenant stay here, and is there a school-zone premium baked into asking?
- The area grade is low — what's the realistic commute time and amenity access for the typical tenant pool here? Any planned neighborhood developments (good or bad) we should know about?
- What's the average days-on-market for RENTAL listings here right now (not sales)? A rising rental-DOM trend means longer vacancies and softer asking-rent achievability than the comps imply.
- What's the recent tenant-quality profile in this submarket — average credit score on applications, eviction rate, late-payment / NSF rate, and stable-employment percentage? A property-management company in the area should have these aggregated.
- How much new apartment / multifamily construction is in the pipeline within 1–3 miles? Heavy new supply (>2% of stock underway) typically softens rents 12–24 months out; light construction supports rent growth.
Investment metrics
- 1% rule
- 1.14% ✓
- Cap rate
- 4.62%
- Cash-on-cash
- -5.96%
- DSCR
- 0.73
- GRM
- 7.3
CMA / ARV
No comps found within radius.
Projected returns pro-forma
4.58% appreciation · 3.02% rent growth · sell at horizon
- IRR
- 4.7%
- Equity multiple
- 1.30×
- Total profit
- $21,713
- Equity at exit
- $140,470
- IRR
- 7.5%
- Equity multiple
- 2.35×
- Total profit
- $98,437
- Equity at exit
- $237,155
Cash invested: $72,660 (down + closing). Projections, not guarantees.
Landlord ↔ Tenant lean methodology
- Overall (STATE)
- 87 Strongly Landlord-Friendly
- State Florida
- 87 Strongly Landlord-Friendly · R+3
- County
- — inherits STATE
- City
- — inherits STATE
ZIP-level market 33301
- Home prices YoY
- 1.6%
- Rents YoY
- 3.0%
- Active inventory
- 474
- Price-to-rent
- 7.3×
Monthly cashflow live
- Estimated rent
- $2,956 high interval (Pro) →
- Mortgage (P&I)
- −$1,361
- Tax from tax record
- −$510 /mo · $6,120/yr
- Insurance
- −$108
- Flood insurance flood zone
- −$152 /mo · $1,824/yr
- HOA
- −$717
- Vacancy / Maint / Mgmt
- −$621
- Net cashflow
- $-513
Break-even live
Sensitivity live
| Price | -10% $-366 | -5% $-439 | +0% $-513 | +5% $-586 | +10% $-660 |
|---|---|---|---|---|---|
| Rent | -10% $-746 | -5% $-630 | +0% $-513 | +5% $-396 | +10% $-279 |
| Rate | -1.0pp $-382 | -0.5pp $-447 | base $-513 | +0.5pp $-580 | +1.0pp $-648 |
UW: 25.0% down · 7.5% · 30yr · 1.5% tax · 5.0% vac · 8.0% maint · 8.0% mgmt
Financing live
Cash to close
- Down payment
- $64,875
- Closing costs
- $7,785
- Reserves months
- —
- Total cash needed
- —
Loan-product check · same deal, 3 products live
Conventional
25% down · 7.5% · 30yr
- Down + closing
- —
- Monthly P&I
- —
- Monthly cashflow
- —
- DSCR
- —
- Eligible?
- —
Personal DTI + credit; lowest rate.
DSCR
20% down · 8.5% · 30yr
- Down + closing
- —
- Monthly P&I
- —
- Monthly cashflow
- —
- DSCR
- —
- Eligible?
- —
No personal income docs; deal must DSCR.
Hard money
10% down · 12.0% · 12mo
- Down + closing
- —
- Monthly P&I
- —
- Monthly cashflow
- —
- DSCR
- —
- Eligible?
- —
Short-term bridge; refi at stabilization.
Rent comps 40 comps
| Address | Beds | Baths | Sqft | Rent | $/sqft | DOM | Units | Dist |
|---|---|---|---|---|---|---|---|---|
| 533 NE 3rd Ave Fort Lauderdale, FL | 1.0–3.0 | 1.0–2.0 | 1053 | $3,525 | $3.35 | 1d | 8 | 0.02mi |
| 533 NE 3rd Ave Fort Lauderdale, FL | 1.0–3.0 | 1.0–2.0 | 1053 | $3,525 | $3.35 | 5d | 7 | 0.02mi |
| 408 NE 6th St Fort Lauderdale, FL | 1.0–3.0 | 1.0–2.0 | 1163 | $2,923 | $2.51 | 1d | 15 | 0.11mi |
| 400 NE 3rd Ave Fort Lauderdale, FL | 1.0–3.0 | 1.0–3.0 | 1211 | $3,470 | $2.86 | 1d | 27 | 0.13mi |
| 673 NE 3rd Ave Fort Lauderdale, FL | 1.0–2.0 | 1.0–2.0 | 971 | $3,243 | $3.34 | 1d | 26 | 0.14mi |
| 633 NE 2nd Ave #15 Fort Lauderdale, FL | 2.0 | 1.5 | 896 | $2,200 | $2.46 | 19d | 1 | 0.15mi |
| 633 NE 2nd Ave #14 Fort Lauderdale, FL | 2.0 | 1.5 | 1000 | $2,200 | $2.20 | 26d | 1 | 0.15mi |
| 600 N Andrews Ave Fort Lauderdale, FL | 1.0 | 1.0 | 760 | $2,820 | $3.71 | 23d | 1 | 0.16mi |
| 600 N Andrews Ave Fort Lauderdale, FL | 1.0 | 1.0 | 638 | $5,115 | $8.02 | 10d | 1 | 0.16mi |
| 600 N Andrews Ave Fort Lauderdale, FL | 2.0 | 2.0 | 986 | $2,891 | $2.93 | 16d | 1 | 0.16mi |
| 500 N Andrews Ave Fort Lauderdale, FL | 1.0–3.0 | 1.0–2.0 | 1040 | $3,273 | $3.15 | 1d | 6 | 0.17mi |
| 501 NE 5th Ter Fort Lauderdale, FL | 1.0–2.0 | 1.0–2.0 | 1045 | $3,712 | $3.55 | 1d | 21 | 0.17mi |
| 440 NE 4th Ave Fort Lauderdale, FL | 2.0–3.0 | 2.0 | 1227 | $3,381 | $2.75 | 0d | 9 | 0.18mi |
| 444 NE 7th St Fort Lauderdale, FL | 2.0 | 1.0–2.0 | 898 | $3,635 | $4.05 | 0d | 31 | 0.20mi |
| 711 NE 2nd Ave Unit 102 Fort Lauderdale, FL | 2.0 | 1.0 | 775 | $1,900 | $2.45 | 13d | 1 | 0.22mi |
| 120 NE 4th St Fort Lauderdale, FL | 1.0–2.0 | 1.0–2.0 | 1061 | $4,109 | $3.87 | 1d | 42 | 0.22mi |
| 315 NE 3rd Ave Unit 1 Fort Lauderdale, FL | 1.0 | 1.0 | 889 | $2,650 | $2.98 | 10d | 1 | 0.22mi |
| 315 NE 3rd Ave Fort Lauderdale, FL | 1.0–2.0 | 1.0–2.0 | 839 | $3,100 | $3.69 | 26d | 2 | 0.22mi |
| 425 N Andrews Ave #303 Fort Lauderdale, FL | 1.0 | 1.0 | 1022 | $3,300 | $3.23 | 26d | 1 | 0.23mi |
| 715 NE 2nd Ave #204 Fort Lauderdale, FL | 1.0 | 1.0 | 750 | $1,700 | $2.27 | 1d | 1 | 0.23mi |
| 410 NW 1st Ave #505 Fort Lauderdale, FL | 1.0 | 1.0 | 1051 | $3,300 | $3.14 | 13d | 1 | 0.28mi |
| 313 NE 2nd St Fort Lauderdale, FL | 1.0–2.0 | 1.0–2.0 | 950 | $3,250 | $3.42 | 23d | 3 | 0.32mi |
| 313 NE 2nd St Fort Lauderdale, FL | 1.0–2.0 | 1.0–2.0 | 1083 | $3,250 | $3.00 | 0d | 3 | 0.32mi |
| 405 NE 2nd St Fort Lauderdale, FL | 1.0–3.0 | 1.0–2.0 | 953 | $3,384 | $3.55 | 0d | 19 | 0.34mi |
| 115 NE 3rd Ave Fort Lauderdale, FL | 1.0 | 1.0 | 860 | $3,057 | $3.55 | 1d | 3 | 0.35mi |
| 714 NW 2nd Ave Unit A Fort Lauderdale, FL | 1.0 | 1.0 | 650 | $1,481 | $2.28 | 1d | 1 | 0.35mi |
| 714 NW 2nd Ave Apt 6 Fort Lauderdale, FL | 1.0 | 1.0 | 850 | $1,481 | $1.74 | 26d | 1 | 0.35mi |
| 715 NE 6th St Unit 9 Fort Lauderdale, FL | 1.0 | 1.0 | 650 | $1,800 | $2.77 | 6d | 1 | 0.36mi |
| 715 NE 6th St Unit 9 Fort Lauderdale, FL | 1.0 | 1.0 | 650 | $1,850 | $2.85 | 24d | 1 | 0.36mi |
| 555 NE 8th St Fort Lauderdale, FL | 3.0 | 1.0–2.0 | 940 | $3,420 | $3.64 | 0d | 37 | 0.36mi |
| 613 NW 3rd Ave Fort Lauderdale, FL | 2.0 | 2.0 | 935 | $2,681 | $2.87 | 15d | 1 | 0.39mi |
| 613 NW 3rd Ave Fort Lauderdale, FL | 2.0 | 2.0 | 988 | $2,550 | $2.58 | 26d | 1 | 0.39mi |
| 613 NW 3rd Ave Fort Lauderdale, FL | 1.0 | 1.0 | 654 | $2,322 | $3.55 | 10d | 1 | 0.39mi |
| 613 NW 3rd Ave Fort Lauderdale, FL | 2.0 | 2.0 | 939 | $2,625 | $2.80 | 5d | 1 | 0.39mi |
| 613 NW 3rd Ave Fort Lauderdale, FL | 1.0 | 1.0 | 693 | $2,255 | $3.25 | 16d | 1 | 0.39mi |
| 613 NW 3rd Ave Fort Lauderdale, FL | 1.0 | 1.0 | 711 | $2,372 | $3.34 | 23d | 1 | 0.39mi |
| 700 NW 3rd Ave Unit 1-8 Fort Lauderdale, FL | 2.0 | 1.0 | 750 | $2,050 | $2.73 | 26d | 1 | 0.39mi |
| 628 NE 8th Ave Unit 2 Fort Lauderdale, FL | 1.0 | 1.0 | 600 | $1,849 | $3.08 | 26d | 1 | 0.41mi |
| 804 NW 2nd Ave Unit C Fort Lauderdale, FL | 1.0 | 1.0 | 700 | $1,350 | $1.93 | 26d | 1 | 0.42mi |
| 736 NW 3rd Ave Unit 1-2 Fort Lauderdale, FL | 1.0 | 1.0 | 650 | $1,350 | $2.08 | 26d | 1 | 0.44mi |
HOA detail condo
- Monthly dues
- $717 · $8,604/yr
- Likely covers
- waterpoolgymsecurity
- Assessments
- None detected in remarks — confirm with the listing agent.
Listing history 26 events
-
2026-06-21days on market $259,500 Active 102 DOM
-
2026-06-18days on market $259,500 Active 99 DOM
-
2026-06-17days on market $259,500 Active 98 DOM
-
2026-06-16days on market $259,500 Active 97 DOM
-
2026-06-15days on market $259,500 Active 96 DOM
-
2026-06-13days on market $259,500 Active 94 DOM
-
2026-06-09statusdays on market $259,500 Active 90 DOM
-
2026-06-07days on market $259,500 Active Under Contract 88 DOM
-
2026-06-04days on market $259,500 Active Under Contract 85 DOM
-
2026-06-03days on market $259,500 Active Under Contract 84 DOM
-
2026-06-02days on market $259,500 Active Under Contract 83 DOM
-
2026-06-01days on market $259,500 Active Under Contract 82 DOM
-
2026-05-31days on market $259,500 Active Under Contract 81 DOM
-
2026-05-06price $259,500
-
2026-04-27price $267,000
-
2026-04-07price $274,500
-
2026-01-11$283,500 Active
-
2023-09-18soldstatus $352,000
-
2015-10-30historical
-
2015-10-09$203,000 Active
-
2015-10-06historical
-
2015-09-22$195,000 Active
-
2015-09-15historical
-
2015-08-31price $195,000
-
2015-08-05$199,000 Active
-
2009-03-09soldstatus $203,400
ⓘ Source: listings_history table (triggers on properties + properties_extension) + one-shot
backfill from property_details.listing_events for pre-trigger history.
Tax reassessment forecast FL · Resets to sale price
- Current annual tax
- $6,120 · $510/mo
- Projected year-2 tax
- $6,120 · $510/mo
- Expected delta
- $0/yr ($0/mo · 0.0%)
ⓘ Screening estimate from a state-policy table — verify with the county assessor before closing.
Climate risk First Street
- Flood 6/10 Major FEMA zone AH · 54% chance over 30 yrs
- Wildfire 1/10 Low
- Heat 10/10 Extreme 7 d/yr ≥105°F today · 25 d/yr by 30 yrs out
- Wind 10/10 Extreme 99% chance of damaging wind over 30 yrs
- Air quality 2/10 Low 1 unhealthy d/yr today · 1 by 30 yrs out
Nearby sold comps map
Loading sold comps map…
Walkable amenities ~0.75 mi
Loading nearby amenities…
Taxation est. · year 1
- Rental income
- $35,472
- − Mortgage interest
- −$14,536
- − Property taxes
- −$6,120
- − Insurance
- −$3,122
- − Repairs & maintenance
- −$2,838
- − Management
- −$2,838
- − HOA
- −$8,604
- − Depreciation
- −$7,549
- Taxable loss
- −$10,135
- Est. tax savings @ 24.0%
- +$2,432
- After-tax cash flow
- $-3,721/yr
For passive investors: Depreciation is non-cash, so a rental often shows a tax loss while cash-flowing — sheltering income. Rental losses are passive: they offset passive income freely, and up to $25,000/yr can offset ordinary (W-2) income if you actively participate and your MAGI is under $100k (phasing out to $0 by $150k); unused losses carry forward. On sale, claimed depreciation is recaptured at up to 25%, and gains may owe capital-gains tax (a 1031 exchange can defer both). Figures are a year-1 estimate at your 24.0% rate — not tax advice; consult a CPA.
Schools (NCES district)
- District
- Broward
- NCES district ID
- 1200180
- Math proficiency
- 42% ▼ -18.00%
- Reading proficiency
- 53% ▼ -5.00%
- Median HH income
- $52,139
- Composite
- 40.88/100
- National rank
- #3621
- State rank
- #46 of 73 in FL
Livability — Fort Lauderdale
- Score
- 82/100
- State rank
- #78
- US rank
- #1293
Category grades
Schools grade is shown separately in the Schools card above.
Census & demographics
- Census place
- Fort Lauderdale, FL
- County
- Broward County · 1,963,430 people
- City population
- 235,769
- Metro
- Miami-Fort Lauderdale-Pompano Beach, FL
- Population (ZIP)
- 19,503
- Household income
- $124,812
- Rent vs Own
- Severe rent burden
- 1662.0
Population outlook (Broward County) Hauer SSP2
- Today (2025)
- 2,207,033 people
- By 2030
- 2,360,704 · +7.0%
- By 2040
- 2,661,208 · +20.6%
- By 2050
- 2,946,698 · +33.5%
- By 2075
- 3,602,273 · +63.2%
- By 2100
- 3,970,984 · +79.9%
Race, ethnicity, and origin ACS 2023
- Neighborhood character
- Predominantly White (67%)
- Race & ethnicity
- White 67% Hispanic / Latino 17% Two or more races 14% Black 8% Asian 2%
- Hispanic origin (detail)
- Mexican 1% Puerto Rican 3% Cuban 5%
- Common ancestry
- Romanian 3% Scotch-Irish 3% Czech 2%
- Foreign-born
- 19% · Canada, Jamaica, Dominican Republic
- Languages at home
- 75% English-only · Spanish 13% Other Indo-European 3% French/Haitian/Cajun 3%
Political lean MEDSL · Broward
- 2024 margin
- D (+17.0) · D 58.0% · R 41.0%
- 2008→2024 swing
- -17.8pp toward R · 2008: 34.7pp · 2024: 17.0pp
- All cycles
- 2024: D+17.0 2020: D+29.8 2016: D+35.0 2012: D+34.9 2008: D+34.7
Not yet ingested
- Civics
- —
Market trends
- HPI YoY
- ▲ 4.58%
- Current HPI
- 300.8346
- Rent YoY
- ▲ 3.02%
- Metro
- Miami-Fort Lauderdale-Pompano Beach, FL
- State GDP YoY
- ▲ 3.28%
- F500 in state
- 36
Industry mix (Fortune 500 HQ in FL)
| Industry | F500 HQs | Revenue |
|---|---|---|
| Industrial Technology | 2 | $29B |
|
||
| Insurance | 2 | $17B |
|
||
| Retail | 1 | $60B |
|
||
| Technology Distribution | 1 | $58B |
|
||
| Homebuilding | 1 | $35B |
|
||
| Technology Manufacturing | 1 | $35B |
|
||
Price history
+27.6% since first listed13 events — show timeline
- 2026-05-06 Price Changed $259,500 Beaches MLS
- 2026-04-27 Price Changed $267,000 Beaches MLS
- 2026-04-07 Price Changed $274,500 Beaches MLS
- 2026-01-11 Listed $283,500 Beaches MLS
- 2023-09-18 Sold (Public Records) $352,000 Public Records
- 2015-10-30 Listing Removed — MARMLS
- 2015-10-09 Listed $203,000 MARMLS
- 2015-10-06 Listing Removed — MARMLS
- 2015-09-22 Listed $195,000 MARMLS
- 2015-09-15 Listing Removed — MARMLS
- 2015-08-31 Price Changed $195,000 MARMLS
- 2015-08-05 Listed $199,000 MARMLS
- 2009-03-09 Sold (Public Records) $203,400 Public Records
Property tax history
+9.1%/yrLatest (2025): $6,120 · +0.8% YoY. Source: county tax records.
Cash-flow waterfall
monthlySold comps — $/sqft
last 12 mo · ≤1 miLoading sold comps…