1230 Greenbriar · Canyon Lake, TX
Flood risk 1/10 · Minimal
- FEMA flood zone
- X (unshaded)
- Chance of flooding over 30 yrs
- 0.0%
- Est. flood insurance / yr
- $507 – $1,088
Fire risk 4/10 · Minor
- Est. fire insurance / yr
- $1,222 – $2,270
Heat risk 7/10 · Major
- Hot days now (above 107°F)
- 7 days/yr
- Hot days in 30 yrs
- 22 days/yr
Wind risk 6/10 · Moderate
- Chance of severe wind over 30 yrs
- 73.0%
Air-quality risk 2/10 · Minimal
- Unhealthy air days now
- 0 days/yr
- Unhealthy air days in 30 yrs
- 1 days/yr
Risk factors via First Street. Map © Google.
Why this score? — see what drove the D+ grade
The composite is a weighted blend of 9 inputs, each scored 0–100. Each bar is that input's sub-score; the figure is the points it added to the 100-point composite (weight × sub-score).
- ARV discount +15.0/15.0
- Cash flow +12.0/30.0
- Schools +5.2/10.0
- DSCR +3.6/10.0
- Livability +3.4/5.0
- Condition / age +2.5/5.0
- 1% rule +2.4/10.0
- Rent growth +2.2/5.0
- Appreciation +0.0/10.0
$185,000
🖨 Deal sheet (PDF) 📄 Offer letter ✓ Due diligence
Listing remarks MLS
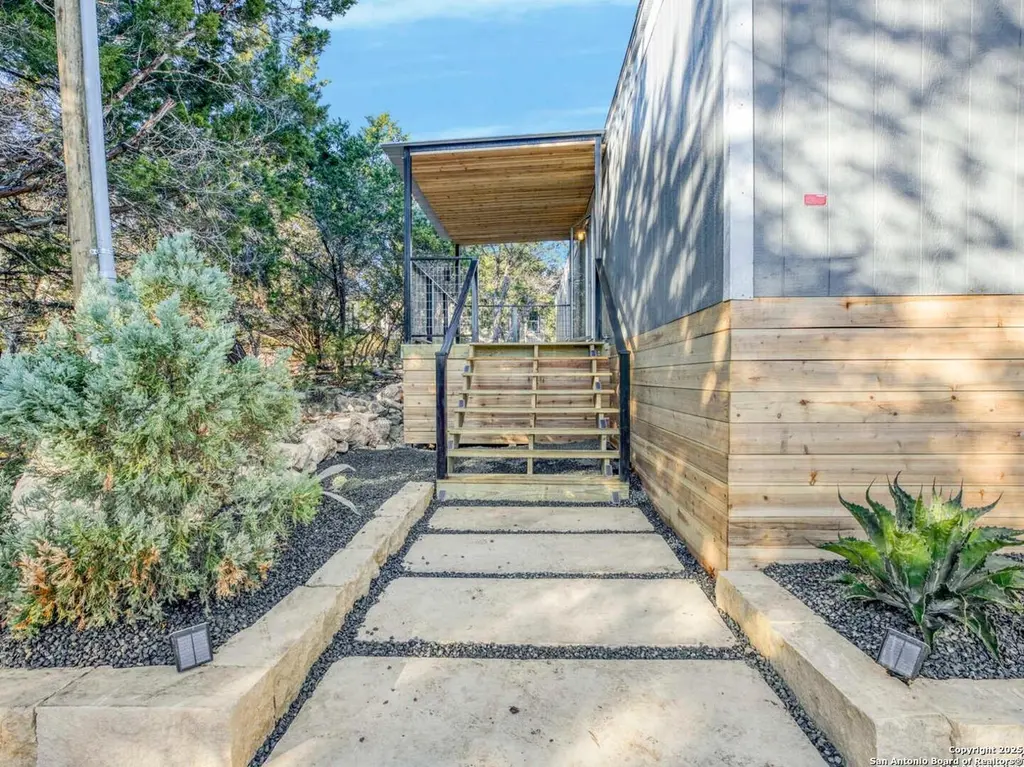
Welcome to 1230 Greenbriar Drive-your brand-new 2025 single-wide manufactured home located in the desirable Tanglewood Shores community of Canyon Lake, TX. This stylish 2-bedroom, 2-bath residence features a well-designed split floor plan that offers comfort, privacy, and modern living throughout. Nestled on approximately 1/4 of an acre, the property provides ample outdoor space for relaxation, gatherings, or adding your personal touch. Inside, you'll find beautiful new finishes, including sleek black appliances and a newly installed HVAC unit for year-round comfort. The open-concept layout creates an inviting flow between the living, dining, and kitchen areas-perfect for everyday living or weekend retreats. Whether you're looking for a full-time residence, a weekend getaway near Canyon Lake, or an investment property, this move-in ready home offers exceptional value in a peaceful Hill Country setting. Don't miss the opportunity to make this brand-new home yours!
Key facts
- Black appliances
- Move-in ready
- Split floor plan
Tags
Neighborhood map
What this means for you Summary
Snapshot
- This is a 2-bed/2.0-bath land listed at $185k.
Deal economics
- At list price, monthly cash flow is $-43 ($-514/yr) — negative.
- To cash-flow at today's rent, offer at most $177k (4.1% below list).
- To meet the 1% rule (rent ≥ 1% of price), the offer needs to be $137k (26.0% below list).
- Recommended offer: $137k (26.0% below list) — sets the bar for 1% rule.
- Cap rate 6.0% vs local median 2.2% in Canyon Lake — top-decile yield for the area; either an underpriced asset or a hidden risk that comps aren't pricing in. Stress-test before assuming the spread holds.
Location & tenants
- Location reads 67/100 on livability (#534 in TX) — a middle-class / working-renter tenant base. Strengths: employment A+, housing A+, cost of living A; Watch: amenities F, commute F, health & safety F.
- Comal ISD (rural): math 57% / reading 59% proficiency, ranked #58 of 826 in TX (top 7%) — acceptable for families but not a draw, mixed tenant base, ~2y average lease.
- Zoned schools: Rebecca Creek El (math 55% / reading 52%, grade C, #686 of 4,322 statewide, top 16%, 605 students, 51% FRL); Mt Valley Middle (math 55% / reading 51%, grade C+, #281 of 1,662 statewide, top 18%, 808 students, 49% FRL); Canyon Lake H S (math 46% / reading 56%, grade D+, #482 of 1,632 statewide, top 30%, 1,038 students, 37% FRL) — zoned schools average 46% FRL vs 31% district-wide (15 pts higher); higher-poverty schools than district average — tighter screening recommended.
- Market conditions: Rents soft (-1.2%/yr); 1029 active listings in the ZIP; solid renter incomes; 3,420 units permitted in Comal County in 2024 (1,164 in 5+ unit buildings).
Forward outlook
- Local home prices are declining (-3.0%/yr); year-one equity from $1k of loan paydown is wiped out by about $6k of value loss. Plan a longer hold.
- Comal County population projected at +70% by 2050 — long-run rental-demand tailwind backs the buy-and-hold thesis.
Negotiation context
- It's been on market 88 days — a 6% lower offer ($174k) is reasonable based on typical stale-listing flexibility.
- 5 sale attempts since 13y ago with the ask held roughly flat each time — persistent listings suggest the price (not the market) is what's stuck; bring a comps-based counter.
Risks & watch-outs
- Climate carrying-cost: major wind risk, 73% chance of damaging wind over 30y; extreme-heat days projected 7→22/yr by 2055 (HVAC capex compounding) — expect insurance premiums to compound above CPI over the hold.
Questions for the listing agent
- What do current leases actually rent for vs. the listed asking? Can we see a recent rent roll and the last 12 months of T-12 income?
- It's been on market 88 days. Have you received any prior offers? Is the seller open to a 26% concession, seller financing, or rate buy-down credit?
- What does the HOA fee cover, when was the last increase, and are there any pending special assessments or reserve-fund shortfalls?
- Why hasn't it sold? Are there any deal-killer items the seller is aware of (foundation, flood, title, zoning, code violations)?
- Is there a deadline driving the sale (1031 exchange, divorce, estate, relocation)? That informs how much negotiation room exists.
- The area grade is low — what's the realistic commute time and amenity access for the typical tenant pool here? Any planned neighborhood developments (good or bad) we should know about?
- What's the average days-on-market for RENTAL listings here right now (not sales)? A rising rental-DOM trend means longer vacancies and softer asking-rent achievability than the comps imply.
- What's the recent tenant-quality profile in this submarket — average credit score on applications, eviction rate, late-payment / NSF rate, and stable-employment percentage? A property-management company in the area should have these aggregated.
- How much new for-sale + rental construction is in the pipeline within 1–3 miles? Heavy new supply typically softens prices + rents 12–24 months out; constrained supply supports both.
Investment metrics
- 1% rule
- 0.74% ✗
- Cap rate
- 6.02%
- Cash-on-cash
- -0.99%
- DSCR
- 0.96
- GRM
- 11.3
CMA / ARV
- ARV (median comp)
- $258,511
- List price
- $185,000
- Delta
- -28.44%
- Verdict
- UNDERPRICED
- Comps
- 7 within 1.0 mi
Projected returns pro-forma
-3.0% appreciation · 0.0% rent growth · sell at horizon
- IRR
- -21.0%
- Equity multiple
- 0.29×
- Total profit
- $-36,791
- Equity at exit
- $27,584
- IRR
- -22.0%
- Equity multiple
- 0.01×
- Total profit
- $-51,356
- Equity at exit
- $15,995
Cash invested: $51,800 (down + closing). Projections, not guarantees.
Landlord ↔ Tenant lean methodology
- Overall (STATE)
- 87 Strongly Landlord-Friendly
- State Texas
- 87 Strongly Landlord-Friendly · R+5
- County
- — inherits STATE
- City
- — inherits STATE
ZIP-level market 78133
- Home prices YoY
- -33.8%
- Rents YoY
- -1.2%
- Active inventory
- 1029
- Price-to-rent
- 11.3×
Monthly cashflow live
- Estimated rent
- $1,369 medium interval (Pro) →
- Mortgage (P&I)
- −$970
- Tax from tax record
- −$75 /mo · $904/yr
- Insurance
- −$77
- HOA
- −$2
- Vacancy / Maint / Mgmt
- −$288
- Net cashflow
- $-43
Break-even live
Sensitivity live
| Price | -10% $62 | -5% $10 | +0% $-43 | +5% $-95 | +10% $-148 |
|---|---|---|---|---|---|
| Rent | -10% $-151 | -5% $-97 | +0% $-43 | +5% $11 | +10% $65 |
| Rate | -1.0pp $50 | -0.5pp $4 | base $-43 | +0.5pp $-91 | +1.0pp $-140 |
UW: 25.0% down · 7.5% · 30yr · 1.5% tax · 5.0% vac · 8.0% maint · 8.0% mgmt
Financing live
Cash to close
- Down payment
- $46,250
- Closing costs
- $5,550
- Reserves months
- —
- Total cash needed
- —
Loan-product check · same deal, 3 products live
Conventional
25% down · 7.5% · 30yr
- Down + closing
- —
- Monthly P&I
- —
- Monthly cashflow
- —
- DSCR
- —
- Eligible?
- —
Personal DTI + credit; lowest rate.
DSCR
20% down · 8.5% · 30yr
- Down + closing
- —
- Monthly P&I
- —
- Monthly cashflow
- —
- DSCR
- —
- Eligible?
- —
No personal income docs; deal must DSCR.
Hard money
10% down · 12.0% · 12mo
- Down + closing
- —
- Monthly P&I
- —
- Monthly cashflow
- —
- DSCR
- —
- Eligible?
- —
Short-term bridge; refi at stabilization.
HOA detail
- Monthly dues
- $2 · $24/yr
Listing history 22 events
-
2026-06-01status $185,000 Pending 88 DOM
-
2026-05-31days on market $185,000 Active Option 88 DOM
-
2026-04-16price $1,400
-
2026-03-04$185,000 New 983-char remark
Show marketing remark (983 chars)
Welcome to 1230 Greenbriar Drive-your brand-new 2025 single-wide manufactured home located in the desirable Tanglewood Shores community of Canyon Lake, TX. This stylish 2-bedroom, 2-bath residence features a well-designed split floor plan that offers comfort, privacy, and modern living throughout. Nestled on approximately 1/4 of an acre, the property provides ample outdoor space for relaxation, gatherings, or adding your personal touch. Inside, you'll find beautiful new finishes, including sleek black appliances and a newly installed HVAC unit for year-round comfort. The open-concept layout creates an inviting flow between the living, dining, and kitchen areas-perfect for everyday living or weekend retreats. Whether you're looking for a full-time residence, a weekend getaway near Canyon Lake, or an investment property, this move-in ready home offers exceptional value in a peaceful Hill Country setting. Don't miss the opportunity to make this brand-new home yours!
-
2026-03-02$2,000
-
2026-03-01historical
-
2025-11-29$185,000 New
-
2025-02-26soldstatus Sold
-
2025-02-26soldstatus
-
2025-02-10status Pending
-
2025-01-29price $18,000
-
2025-01-16price $20,000
-
2025-01-11price $22,500
-
2024-12-20price $25,000
-
2024-11-23price $30,000
-
2024-09-25price $47,000
-
2024-08-27price $48,000
-
2024-08-09$50,000 New
-
2015-02-23soldstatus
-
2015-02-20soldstatus
-
2013-02-10$5,000
-
2009-12-09soldstatus
ⓘ Source: listings_history table (triggers on properties + properties_extension) + one-shot
backfill from property_details.listing_events for pre-trigger history.
Tax reassessment forecast TX · Resets to sale price
- Current annual tax
- $904 · $75/mo
- Projected year-2 tax
- $3,386 · $282/mo
- Expected delta
- +$2,482/yr (+$207/mo · 274.7%)
ⓘ Screening estimate from a state-policy table — verify with the county assessor before closing.
Climate risk First Street
- Flood 1/10 Low FEMA zone X (unshaded) · 0% chance over 30 yrs
- Wildfire 4/10 Moderate
- Heat 7/10 Severe 7 d/yr ≥107°F today · 22 d/yr by 30 yrs out
- Wind 6/10 Major 73% chance of damaging wind over 30 yrs
- Air quality 2/10 Low 0 unhealthy d/yr today · 1 by 30 yrs out
Nearby sold comps map
Loading sold comps map…
Walkable amenities ~0.75 mi
Loading nearby amenities…
Taxation est. · year 1
- Rental income
- $16,431
- − Mortgage interest
- −$10,363
- − Property taxes
- −$904
- − Insurance
- −$925
- − Repairs & maintenance
- −$1,315
- − Management
- −$1,315
- − HOA
- −$24
- − Depreciation
- −$5,382
- Taxable loss
- −$3,795
- Est. tax savings @ 24.0%
- +$911
- After-tax cash flow
- $397/yr
For passive investors: Depreciation is non-cash, so a rental often shows a tax loss while cash-flowing — sheltering income. Rental losses are passive: they offset passive income freely, and up to $25,000/yr can offset ordinary (W-2) income if you actively participate and your MAGI is under $100k (phasing out to $0 by $150k); unused losses carry forward. On sale, claimed depreciation is recaptured at up to 25%, and gains may owe capital-gains tax (a 1031 exchange can defer both). Figures are a year-1 estimate at your 24.0% rate — not tax advice; consult a CPA.
Schools (NCES district)
- District
- Comal ISD
- NCES district ID
- 4814730
- Math proficiency
- 57% ▼ -9.00%
- Reading proficiency
- 59% ▼ -2.00%
- Median HH income
- $74,792
- Composite
- 51.79/100
- National rank
- #1671
- State rank
- #58 of 826 in TX
Livability — Canyon Lake
- Score
- 67/100
- State rank
- #534
- US rank
- #10441
Category grades
Schools grade is shown separately in the Schools card above.
Census & demographics
- Census place
- Canyon Lake, TX
- County
- Comal County · 206,262 people
- City population
- 42,159
- Metro
- San Antonio-New Braunfels, TX
- Population (ZIP)
- 21,959
- Household income
- $83,853
- Rent vs Own
- Severe rent burden
- 402.0
Population outlook (Comal County) Hauer SSP2
- Today (2025)
- 175,637 people
- By 2030
- 199,911 · +13.8%
- By 2040
- 249,436 · +42.0%
- By 2050
- 299,430 · +70.5%
- By 2075
- 423,857 · +141.3%
- By 2100
- 512,048 · +191.5%
Race, ethnicity, and origin ACS 2023
- Neighborhood character
- Predominantly White (74%)
- Race & ethnicity
- White 74% Hispanic / Latino 20% Two or more races 10% Black 2%
- Hispanic origin (detail)
- Mexican 15%
- Common ancestry
- Lithuanian 3% Romanian 3% Italian 3%
- Foreign-born
- 4% · Canada
- Languages at home
- 91% English-only · Spanish 7%
Political lean MEDSL · Comal
- 2024 margin
- Solid R (+45.5) · D 26.8% · R 72.2%
- 2008→2024 swing
- +1.9pp toward D · 2008: -47.4pp · 2024: -45.5pp
- All cycles
- 2024: R+45.5 2020: R+42.7 2016: R+50.1 2012: R+54.1 2008: R+47.4
Not yet ingested
- Civics
- —
Market trends
- HPI YoY
- ▼ -111.36%
- Current HPI
- 218.4633
- Rent YoY
- ▼ -1.20%
- Metro
- San Antonio-New Braunfels, TX
- State GDP YoY
- ▲ 3.95%
- F500 in state
- 110
Industry mix (Fortune 500 HQ in TX)
| Industry | F500 HQs | Revenue |
|---|---|---|
| Energy | 16 | $1,198B |
|
||
| Technology | 5 | $198B |
|
||
| Engineering / Construction | 4 | $72B |
|
||
| Energy Services | 3 | $60B |
|
||
| Utilities | 3 | $41B |
|
||
| Healthcare | 2 | $330B |
|
||
Price history
-72.0% since first listed20 events — show timeline
- 2026-04-16 Price Changed $1,400 SABOR
- 2026-03-04 Listed $185,000 LERA
- 2026-03-02 Listed for Rent $2,000 SABOR
- 2026-03-01 Listing Removed — LERA
- 2025-11-29 Listed $185,000 LERA
- 2025-02-26 Sold (MLS) — LERA
- 2025-02-26 Sold (Public Records) — Public Records
- 2025-02-10 Pending — LERA
- 2025-01-29 Price Changed $18,000 LERA
- 2025-01-16 Price Changed $20,000 LERA
- 2025-01-11 Price Changed $22,500 LERA
- 2024-12-20 Price Changed $25,000 LERA
- 2024-11-23 Price Changed $30,000 LERA
- 2024-09-25 Price Changed $47,000 LERA
- 2024-08-27 Price Changed $48,000 LERA
- 2024-08-09 Listed $50,000 LERA
- 2015-02-23 Sold (Public Records) — Public Records
- 2015-02-20 Sold (MLS) — Unlock MLS
- 2013-02-10 Listed $5,000 Unlock MLS
- 2009-12-09 Sold (Public Records) — Public Records
Property tax history
+15.9%/yrLatest (2026): $904 · +53.7% YoY. Source: county tax records.
Cash-flow waterfall
monthlySold comps — $/sqft
last 12 mo · ≤1 miLoading sold comps…