 Duplex
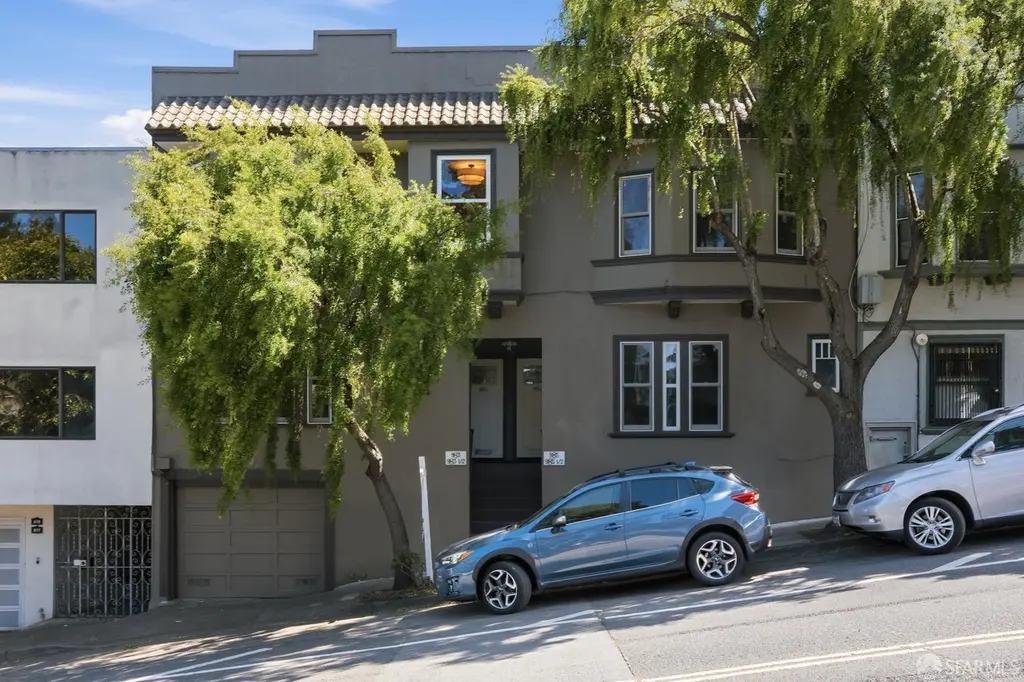
983-985 14th St · San Francisco, CA
Flood risk 1/10 · Minimal
- FEMA flood zone
- X (unshaded)
- Chance of flooding over 30 yrs
- 0.0%
- Est. flood insurance / yr
- $507 – $1,088
Fire risk 1/10 · Minimal
- Est. fire insurance / yr
- $659 – $1,223
Heat risk 2/10 · Minimal
- Hot days now (above 76°F)
- 7 days/yr
- Hot days in 30 yrs
- 17 days/yr
Wind risk 1/10 · Minimal
- Chance of severe wind over 30 yrs
- —
Air-quality risk 8/10 · Major
- Unhealthy air days now
- 15 days/yr
- Unhealthy air days in 30 yrs
- 15 days/yr
Risk factors via First Street. Map © Google.
Why this score? — see what drove the C+ grade
The composite is a weighted blend of 9 inputs, each scored 0–100. Each bar is that input's sub-score; the figure is the points it added to the 100-point composite (weight × sub-score).
- Cash flow +12.8/30.0
- ARV discount +12.7/15.0
- Appreciation +9.8/10.0
- Rent growth +5.0/5.0
- Schools +5.0/10.0
- Condition / age +4.0/5.0
- DSCR +3.8/10.0
- Livability +3.8/5.0
- 1% rule +3.6/10.0
$1,998,000
🖨 Deal sheet 📄 Offer letter ✓ Due diligence
Multi-family units
County records classify this as Multi-Family (2-4 Unit). Listing-text estimate: 2 units. confirmed
Listing remarks
Nestled in the sought-after Duboce Triangle neighborhood, this inviting four-unit building presents a rare opportunity to own a versatile San Francisco property. Two units will be delivered vacant, offering flexibility for an owner-occupant or investor alike. One upper-level unit features two bedrooms and abundant natural light, while the second upper unit offers a bright one-bedroom layout. The remaining two tenant-occupied units provide valuable supplemental income. Recently updated, the building seamlessly blends modern conveniences with classic San Francisco charm, showcasing warm woodwork, period moldings, and timeless architectural details throughout. Each unit enjoys access to shared
Key facts
- Shared laundry
- Close to duboce park
- Shared rear decks
Tags
Property features AI
Finance
- Other: Unit layout described as: upper left, lower left, upper right, lower right
- Financial info: Four-unit building with 2 units currently leased and 2 units vacant
- HOA & community: No association fee
Exterior
- Parking: Detached garage with 4 spaces (side-by-side)
- Home design: Residential income property (quadruplex); Three or more levels; Built in 1906
- Construction: Original construction year 1906
- Exterior features: Lot approximately 1,988 sq ft; One building; No specific lot features listed
Interior
- Bedrooms: Six bedrooms total (across units)
- Flooring: Linoleum; Tile; Wood
- Bathrooms: Four full bathrooms total
- Heating & cooling: Wall furnace (heating)
- Interior features: Wall furnace heating; Laundry in common area
- Laundry & utility: Common area laundry
Neighborhood map
What this means for you Summary
Snapshot
- This is a 2 × 3-bed/?-bath units multifamily listed at $2.00M. Condition is rated good.
Deal economics
- At list price, monthly cash flow is $-172 ($-2k/yr) — negative. Per door: $-86/mo.
- To cash-flow at today's rent, offer at most $1.97M (1.2% below list).
- To meet the 1% rule (rent ≥ 1% of price), the offer needs to be $1.73M (13.6% below list).
- Recommended offer: $1.73M (13.6% below list) — sets the bar for 1% rule.
- Cap rate 6.2% vs local median 2.1% in San Francisco — top-decile yield for the area; either an underpriced asset or a hidden risk that comps aren't pricing in. Stress-test before assuming the spread holds.
Location & tenants
- Location reads 76/100 on livability (#90 in CA, #3,143 nationally) — a middle-class / working-renter tenant base. Strengths: amenities A+, commute A+, employment A+; Watch: crime F, cost of living F.
- San Francisco Unified (urban): math 50% / reading 56% proficiency, ranked #322 of 1,400 in CA (top 23%) — acceptable for families but not a draw, mixed tenant base, ~2y average lease.
- Market conditions: Rents rising fast (+14.4%/yr); 116 active listings in the ZIP; 1 comparable units currently listed for rent nearby; high-income renter base; 750 units permitted in San Francisco County in 2024 (688 in 5+ unit buildings).
- At $17,260/mo this rent would consume 101% of the median local household income ($204k/yr) (locally 1336% of renters already pay >50% of income on rent) — very limited rent-growth headroom before tenants either downsize or default.
Forward outlook
- In year one you build about $204k of equity ($14k loan paydown + $190k appreciation (9.5% local appreciation)).
- San Francisco County population projected at +39% by 2050 — long-run rental-demand tailwind backs the buy-and-hold thesis.
- By year 2, paydown + projected appreciation supports a ~$327k cash-out refi (75% LTV) — recoverable capital for the next deal without selling this one.
Negotiation context
- Only 13 days on market — expect competitive offers; lowballing is unlikely to land.
Risks & watch-outs
- Watch-outs: built in 1906 — expect roof / HVAC / electrical / plumbing capex.
Questions for the listing agent
- What do current leases actually rent for vs. the listed asking? Can we see a recent rent roll and the last 12 months of T-12 income?
- Can we see the unit-by-unit rent roll, current vacancy, and any below-market leases? What's the average tenancy length?
- What capital expenditures (roof, boiler, parking lot, exteriors) have been made in the last 5 years, and what's planned in the next 2?
- Built in 1906 — when were the roof, HVAC, electrical panel, plumbing, and water heater last replaced?
- Is there a deadline driving the sale (1031 exchange, divorce, estate, relocation)? That informs how much negotiation room exists.
- Schools are B-rated — typically a magnet for longer-tenancy family renters. What's the average tenant stay here, and is there a school-zone premium baked into asking?
- Crime grade is F in this area — have there been break-ins, vandalism, or insurance claims at this property in the last 3 years? What carrier currently insures it and at what premium?
- What's the average days-on-market for RENTAL listings here right now (not sales)? A rising rental-DOM trend means longer vacancies and softer asking-rent achievability than the comps imply.
- What's the recent tenant-quality profile in this submarket — average credit score on applications, eviction rate, late-payment / NSF rate, and stable-employment percentage? A property-management company in the area should have these aggregated.
- How much new apartment / multifamily construction is in the pipeline within 1–3 miles? Heavy new supply (>2% of stock underway) typically softens rents 12–24 months out; light construction supports rent growth.
Investment metrics
- 1% rule
- 0.86% ✗
- Cap rate
- 6.19%
- Cash-on-cash
- -0.37%
- DSCR
- 0.98
- GRM
- 9.6
CMA / ARV
- ARV (median comp)
- $2,261,376
- List price
- $1,998,000
- Delta
- -11.65%
- Verdict
- UNDERPRICED
- Comps
- 20 within 1.0 mi
Show comp detail 12 sales within ~0.75 mi
| Address | Dist | Beds/Ba | Sqft | Sold | Price | $/sf | Match |
|---|---|---|---|---|---|---|---|
| 983-985 14th St | 0.00mi | 6/4.0 | 3,625 (0%) | 0mo | $2,650,000 | $731 | 100 |
| 280-282 Roosevelt Way | 0.34mi | 6/5.0 | 3,400 (-6%) | 2mo | $2,600,000 | $765 | 68 |
| 230-234 Pierce St | 0.36mi | 7/— (+1) | 3,930 (+8%) | 3mo | $2,750,000 | $700 | 62 |
| 436 Oak St | 0.70mi | 6/3.0 | 3,611 (-0%) | 1mo | $3,363,000 | $931 | 62 |
| 789-793 Page St | 0.37mi | 7/3.0 (+1) | 3,825 (+6%) | 9mo | $2,100,000 | $549 | 57 |
| 287-291 Page St | 0.69mi | 5/3.0 (-1) | 3,518 (-3%) | 0mo | $3,674,550 | $1,044 | 54 |
| 152 Central Ave | 0.52mi | 7/— (+1) | 4,000 (+10%) | 4mo | $1,500,000 | $375 | 50 |
| 149 Eureka St | 0.53mi | 5/— (-1) | 4,108 (+13%) | 6mo | $1,750,000 | $426 | 43 |
| 412-414 Central Ave | 0.65mi | 5/2.0 (-1) | 3,390 (-6%) | 6mo | $1,700,000 | $501 | 41 |
| 418 Central Ave | 0.65mi | 6/3.0 | 4,081 (+13%) | 9mo | $1,600,000 | $392 | 37 |
| 482-484 Belvedere St | 0.73mi | 5/4.0 (-1) | 3,085 (-15%) | 2mo | $5,300,000 | $1,718 | 35 |
| 1176-1178 Fulton St | 0.70mi | 7/2.0 (+1) | 4,038 (+11%) | 2mo | $4,000,000 | $991 | 33 |
Match score weights: distance 35% · size 25% · config 20% · recency 20%. Top-matched comps best support the ARV.
Projected returns pro-forma
9.51% appreciation · 8.0% rent growth · sell at horizon
- IRR
- 24.7%
- Equity multiple
- 2.97×
- Total profit
- $1,101,568
- Equity at exit
- $1,728,578
- IRR
- 23.4%
- Equity multiple
- 7.19×
- Total profit
- $3,462,924
- Equity at exit
- $3,654,314
Cash invested: $559,440 (down + closing). Projections, not guarantees.
Landlord ↔ Tenant lean methodology
- Overall (CITY)
- 0 Strongly Tenant-Friendly
- State California
- 18 Strongly Tenant-Friendly · D+13
- County
- — inherits STATE
- City San Francisco
- 0 Strongly Tenant-Friendly · D+57
ZIP-level market 94114
- Home prices YoY
- 4.4%
- Rents YoY
- 14.4%
- Active inventory
- 116
- Price-to-rent
- 19.3×
Monthly cashflow live
- Estimated rent
- $17,260 high interval (Pro) →
- Mortgage (P&I)
- −$10,478
- Tax est. 1.5%
- −$2,498 /mo · $29,970/yr
- Insurance
- −$832
- HOA
- −$0
- Vacancy / Maint / Mgmt
- −$3,625
- Net cashflow
- $-172
Break-even live
2-unit breakdown (identical units grouped — click to expand)
| Units | Beds | Baths | Est. rent |
|---|---|---|---|
| 2× units | 3 | — | $17,260 |
| #1 | 3 | — | $8,630 |
| #2 | 3 | — | $8,630 |
| Total (2 units) | $17,260 | ||
UW: 25.0% down · 7.5% · 30yr · 1.5% tax · 5.0% vac · 8.0% maint · 8.0% mgmt
Financing live
Cash to close
- Down payment
- $499,500
- Closing costs
- $59,940
- Reserves months
- —
- Total cash needed
- —
Loan-product check · same deal, 3 products live
Conventional
25% down · 7.5% · 30yr
- Down + closing
- —
- Monthly P&I
- —
- Monthly cashflow
- —
- DSCR
- —
- Eligible?
- —
Personal DTI + credit; lowest rate.
DSCR
20% down · 8.5% · 30yr
- Down + closing
- —
- Monthly P&I
- —
- Monthly cashflow
- —
- DSCR
- —
- Eligible?
- —
No personal income docs; deal must DSCR.
Hard money
10% down · 12.0% · 12mo
- Down + closing
- —
- Monthly P&I
- —
- Monthly cashflow
- —
- DSCR
- —
- Eligible?
- —
Short-term bridge; refi at stabilization.
Rent comps 1 comps
| Address | Beds | Baths | Sqft | Rent | $/sqft | DOM | Units | Dist |
|---|---|---|---|---|---|---|---|---|
| 701 Castro St San Francisco, CA | 5.0 | 4.0 | 3300 | $22,995 | $6.97 | 18d | 1 | 0.65mi |
Listing history 1 events
-
2026-05-08$1,998,000 Active 1118-char remark
ⓘ Source: listings_history table (triggers on properties + properties_extension) + one-shot
backfill from property_details.listing_events for pre-trigger history.
Climate risk First Street
- Flood 1/10 Low FEMA zone X (unshaded) · 0% chance over 30 yrs
- Wildfire 1/10 Low
- Heat 2/10 Low 7 d/yr ≥76°F today · 17 d/yr by 30 yrs out
- Wind 1/10 Low
- Air quality 8/10 Severe 15 unhealthy d/yr today · 15 by 30 yrs out
Nearby sold comps map
Loading sold comps map…
Walkable amenities ~0.75 mi
Loading nearby amenities…
Taxation est. · year 1
- Rental income
- $207,120
- − Mortgage interest
- −$111,919
- − Property taxes
- −$29,970
- − Insurance
- −$9,990
- − Repairs & maintenance
- −$16,570
- − Management
- −$16,570
- − Depreciation
- −$58,124
- Taxable loss
- −$36,022
- Est. tax savings @ 24.0%
- +$8,645
- After-tax cash flow
- $6,577/yr
For passive investors: Depreciation is non-cash, so a rental often shows a tax loss while cash-flowing — sheltering income. Rental losses are passive: they offset passive income freely, and up to $25,000/yr can offset ordinary (W-2) income if you actively participate and your MAGI is under $100k (phasing out to $0 by $150k); unused losses carry forward. On sale, claimed depreciation is recaptured at up to 25%, and gains may owe capital-gains tax (a 1031 exchange can defer both). Figures are a year-1 estimate at your 24.0% rate — not tax advice; consult a CPA.
Condition & rehab AI · 12 photos
This four-unit building in the Duboce Triangle neighborhood is in good condition with minimal repairs needed. The property offers a great opportunity for investors or owner-occupants with its versatile layout and modern updates.
Value-add opportunities
- Resale Paint the exterior — A fresh coat of paint can enhance the curb appeal and make the property more attractive to potential buyers.
- Both Replace the carpet in the stairs — Replacing the carpet with a more modern and durable material can improve the overall look and feel of the home, benefiting both resale and rental value.
- Both Install new flooring in the bathrooms — Upgrading the flooring in the bathrooms can make the space more appealing and functional, benefiting both resale and rental value.
- Both Upgrade the kitchen appliances — Modernizing the kitchen appliances can make the space more functional and appealing, benefiting both resale and rental value.
- Both Install new windows — Upgrading the windows can improve energy efficiency and increase the home's curb appeal, benefiting both resale and rental value.
Renovation cost estimate screening
Value-add ROI direction
- Resale Paint the exterior — A fresh coat of paint can enhance the curb appeal and make the property more attractive to potential buyers. ↑
- Both Replace the carpet in the stairs — Replacing the carpet with a more modern and durable material can improve the overall look and feel of the home, benefiting both resale and rental value. ↑
- Both Install new flooring in the bathrooms — Upgrading the flooring in the bathrooms can make the space more appealing and functional, benefiting both resale and rental value. ↑
- Both Upgrade the kitchen appliances — Modernizing the kitchen appliances can make the space more functional and appealing, benefiting both resale and rental value. ↑
- Both Install new windows — Upgrading the windows can improve energy efficiency and increase the home's curb appeal, benefiting both resale and rental value. ↑
ⓘ Cost ranges are severity-bucket heuristics (US national rule-of-thumb). Get contractor quotes + a written scope before underwriting a rehab budget.
Schools (NCES district)
- District
- San Francisco Unified
- NCES district ID
- 0634410
- Math proficiency
- 50% ▬ 0.00%
- Reading proficiency
- 56% ▲ 1.00%
- Median HH income
- $81,249
- Composite
- 50.14/100
- National rank
- #4088
- State rank
- #322 of 1400 in CA
Livability — San Francisco
- Score
- 76/100
- State rank
- #90
- US rank
- #3143
Category grades
Schools grade is shown separately in the Schools card above.
Census & demographics
- Census place
- San Francisco, CA
- County
- San Francisco County · 827,552 people
- City population
- 827,552
- Metro
- San Francisco-Oakland-Berkeley, CA
- Population (ZIP)
- 33,020
- Household income
- $204,134
- Rent vs Own
- Severe rent burden
- 1336.0
Population outlook (San Francisco County) Hauer SSP2
- Today (2025)
- 1,030,936 people
- By 2030
- 1,110,409 · +7.7%
- By 2040
- 1,270,010 · +23.2%
- By 2050
- 1,435,001 · +39.2%
- By 2075
- 1,779,074 · +72.6%
- By 2100
- 1,966,767 · +90.8%
Race, ethnicity, and origin ACS 2023
- Neighborhood character
- Predominantly White (65%)
- Race & ethnicity
- White 65% Asian 14% Two or more races 12% Hispanic / Latino 10% Black 2%
- Hispanic origin (detail)
- Mexican 5%
- Common ancestry
- Lithuanian 4% Italian 4% Romanian 3%
- Foreign-born
- 20% · Canada, China, Vietnam
- Languages at home
- 77% English-only · Spanish 6% Chinese 4% Other Indo-European 4%
Political lean MEDSL · San Francisco
- 2024 margin
- Solid D (+64.8) · D 80.3% · R 15.5% · Other 4.1%
- 2008→2024 swing
- -5.7pp toward R · 2008: 70.5pp · 2024: 64.8pp
- All cycles
- 2024: D+64.8 2020: D+72.5 2016: D+76.1 2012: D+70.2 2008: D+70.5
Not yet ingested
- Civics
- —
Market trends
- HPI YoY
- ▲ 9.51%
- Current HPI
- 223.6988
- Rent YoY
- ▲ 14.40%
- Metro
- San Francisco-Oakland-Berkeley, CA
- State GDP YoY
- ▲ 3.21%
- F500 in state
- 116
Industry mix (Fortune 500 HQ in CA)
| Industry | F500 HQs | Revenue |
|---|---|---|
| Technology | 27 | $1,492B |
|
||
| Financial Services | 3 | $174B |
|
||
| Retail | 3 | $44B |
|
||
| Insurance | 3 | $26B |
|
||
| Media / Entertainment | 2 | $115B |
|
||
| Pharmaceuticals / Biotech | 2 | $62B |
|
||
Price history
+32.6% since first listed3 events — show timeline
- 2026-06-11 Sold (MLS) $2,650,000 San Francisco MLS
- 2026-05-21 Pending — San Francisco MLS
- 2026-05-08 Listed $1,998,000 San Francisco MLS
Cash-flow waterfall
monthlySold comps — $/sqft
last 12 mo · ≤1 miLoading sold comps…