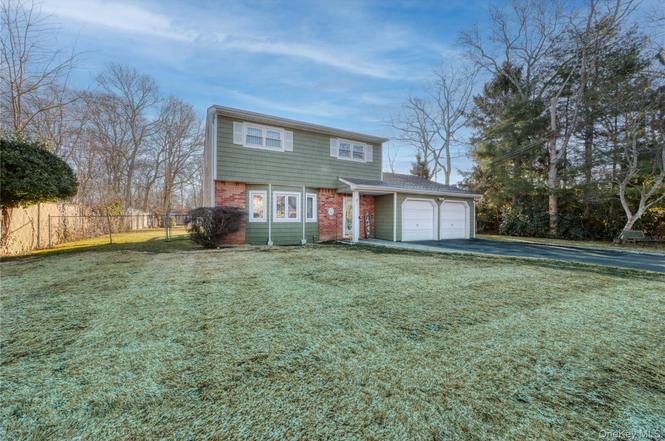
225 Whittier Dr · Mastic Beach, NY
Flood risk 1/10 · Minimal
- FEMA flood zone
- X (unshaded)
- Chance of flooding over 30 yrs
- 0.0%
- Est. flood insurance / yr
- $473 – $860
Fire risk 2/10 · Minimal
- Est. fire insurance / yr
- $691 – $1,283
Heat risk 4/10 · Minor
- Hot days now (above 91°F)
- 7 days/yr
- Hot days in 30 yrs
- 19 days/yr
Wind risk 8/10 · Major
- Chance of severe wind over 30 yrs
- 80.0%
Air-quality risk 4/10 · Minor
- Unhealthy air days now
- 3 days/yr
- Unhealthy air days in 30 yrs
- 5 days/yr
Risk factors via First Street. Map © Google.
Why this score? — see what drove the D+ grade
The composite is a weighted blend of 9 inputs, each scored 0–100. Each bar is that input's sub-score; the figure is the points it added to the 100-point composite (weight × sub-score).
- ARV discount +12.9/15.0
- Appreciation +10.0/10.0
- Cash flow +7.4/30.0
- Schools +4.7/10.0
- Livability +3.1/5.0
- Rent growth +2.5/5.0
- Condition / age +2.5/5.0
- 1% rule +2.0/10.0
- DSCR +1.6/10.0
$539,000
🖨 Deal sheet 📄 Offer letter ✓ Due diligence
Listing remarks
Charming 3-bedroom, 1.5-bath Colonial situated on just shy of 1/2-acre property in Mastic Beach. This home features a living room, dining room, eat-in kitchen, and den, offering a functional layout with great living space. Updates include a newer roof, central air conditioning, siding, and private driveway. The property also features an 11-zone in-ground sprinkler system (IGS) and a spacious yard with plenty of room for outdoor enjoyment. Conveniently located close to shopping, restaurants, parks, and major roadways.
Key facts
- 0.42 acre lot
- 2 garage spots
- Built 1975
Property features AI
Exterior
- Parking: Private parking (total 4 spaces); Driveway; Garage (2 spaces); Off-street parking
- Security: Smoke detector(s)
- Utilities: Electricity connected (PSEG); Water connected; Cesspool sewer; Cable available; Phone available; Public trash collection
- Home design: Single family residence; Two-story
- Construction: Property condition: Actual; Full attic; No basement
- Exterior features: Chain link fencing; Shed(s); Smoke detectors; Back yard; Front yard; Level lot; Sprinklers in front; Sprinklers in rear
Interior
- Kitchen: Dishwasher; Microwave; Range; Refrigerator
- Bedrooms: Two levels (total rooms: 7)
- Flooring: Carpet; Ceramic tile
- Bathrooms: 1 full bathroom; 1 half bathroom
- Heating & cooling: Oil heating; Central air conditioning
- Interior features: Ceiling fans; Eat-in kitchen; Entrance foyer; Formal dining room; Storage; Washer/dryer hookup
- Laundry & utility: Washer; Dryer; Washer/dryer hookup
Neighborhood map
What this means for you Summary
Snapshot
- This is a 3-bed/1.5-bath single-family listed at $539k.
Deal economics
- At list price, monthly cash flow is $-689 ($-8k/yr) — negative.
- To cash-flow at today's rent, offer at most $417k (22.6% below list).
- To meet the 1% rule (rent ≥ 1% of price), the offer needs to be $377k (30.0% below list).
- Recommended offer: $377k (30.0% below list) — sets the bar for 1% rule.
Location & tenants
- Location reads 61/100 on livability (#936 in NY) — a middle-class / working-renter tenant base. Strengths: employment A+, housing A+; Watch: crime D, amenities F, commute F.
- William Floyd Union Free School District (suburban): math 48% / reading 57% proficiency, ranked #309 of 590 in NY (top 52%) — acceptable for families but not a draw, mixed tenant base, ~2y average lease.
- Zoned schools: Tangier Smith Elementary School (math 43% / reading 54%, grade D, #1,181 of 2,108 statewide, top 56%, 755 students, 61% FRL); William Paca Middle School (math 31% / reading 37%, grade F, #497 of 729 statewide, top 69%, 1,009 students, 59% FRL); William Floyd High School (math 65% / reading 87%, grade A-, #616 of 1,100 statewide, top 57%, 3,013 students, 54% FRL) — zoned schools average 58% FRL vs 43% district-wide (15 pts higher); higher-poverty schools than district average — tighter screening recommended.
- Market conditions: 133 active listings in the ZIP; 4 comparable units currently listed for rent nearby; rentals leasing fast (median 2d on market — plan ~1-2 weeks tenant-placement turnaround); 1,366 units permitted in Suffolk County in 2024 (216 in 5+ unit buildings).
Forward outlook
- In year one you build about $58k of equity ($4k loan paydown + $54k appreciation (10.0% local appreciation)).
- Suffolk County population projected to shrink 5% by 2050 — rents likely to lag national; underwrite the cash flow, not the appreciation.
- By year 2, paydown + projected appreciation supports a ~$93k cash-out refi (75% LTV) — recoverable capital for the next deal without selling this one.
Negotiation context
- It's been on market 32 days — a 3% lower offer ($523k) is reasonable based on typical stale-listing flexibility.
Risks & watch-outs
- Climate carrying-cost: severe wind risk, 80% chance of damaging wind over 30y — expect insurance premiums to compound above CPI over the hold.
Questions for the listing agent
- What do current leases actually rent for vs. the listed asking? Can we see a recent rent roll and the last 12 months of T-12 income?
- It's been on market 32 days. Have you received any prior offers? Is the seller open to a 30% concession, seller financing, or rate buy-down credit?
- Built in 1975 — when were the roof, HVAC, electrical panel, plumbing, and water heater last replaced?
- Is there a deadline driving the sale (1031 exchange, divorce, estate, relocation)? That informs how much negotiation room exists.
- Schools are D-rated, which usually means shorter tenancies and higher turnover. Who's the typical renter profile here, and what's been the actual vacancy rate?
- Crime grade is D in this area — have there been break-ins, vandalism, or insurance claims at this property in the last 3 years? What carrier currently insures it and at what premium?
- The area grade is low — what's the realistic commute time and amenity access for the typical tenant pool here? Any planned neighborhood developments (good or bad) we should know about?
- What's the average days-on-market for RENTAL listings here right now (not sales)? A rising rental-DOM trend means longer vacancies and softer asking-rent achievability than the comps imply.
- What's the recent tenant-quality profile in this submarket — average credit score on applications, eviction rate, late-payment / NSF rate, and stable-employment percentage? A property-management company in the area should have these aggregated.
- How much new for-sale + rental construction is in the pipeline within 1–3 miles? Heavy new supply typically softens prices + rents 12–24 months out; constrained supply supports both.
Investment metrics
- 1% rule
- 0.70% ✗
- Cap rate
- 4.76%
- Cash-on-cash
- -5.47%
- DSCR
- 0.76
- GRM
- 11.9
CMA / ARV
- ARV (on-the-fly)
- $612,238
- Comps found
- 12
Show comp detail 12 sales within ~0.75 mi
| Address | Dist | Beds/Ba | Sqft | Sold | Price | $/sf | Match |
|---|---|---|---|---|---|---|---|
| 268 Beaver Dr | 0.22mi | 3/2.0 | 1,500 (-8%) | 7mo | $490,000 | $327 | 68 |
| 206 Longfellow Dr | 0.09mi | 4/2.0 (+1) | 1,750 (+7%) | 13mo | $560,000 | $320 | 67 |
| 316 Whittier Dr | 0.44mi | 3/3.0 | 1,600 (-2%) | 9mo | $560,000 | $350 | 62 |
| 23 Washington Ave | 0.53mi | 3/2.0 | 1,600 (-2%) | 11mo | $525,000 | $328 | 60 |
| 200 Orchid Dr | 0.13mi | 3/2.0 | 1,396 (-15%) | 13mo | $535,000 | $383 | 57 |
| 42 Biltmore Dr | 0.72mi | 3/2.0 | 1,726 (+5%) | 1mo | $645,000 | $374 | 55 |
| 290 Cypress Dr | 0.28mi | 4/2.5 (+1) | 1,808 (+10%) | 10mo | $570,000 | $315 | 52 |
| 49 Barclay Rd | 0.73mi | 4/2.5 (+1) | 1,591 (-3%) | 1mo | $630,000 | $396 | 51 |
| 189 Beaver Dr | 0.54mi | 4/1.5 (+1) | 1,470 (-10%) | 3mo | $560,000 | $381 | 50 |
| 5 Baker Rd | 0.59mi | 3/1.5 | 1,428 (-13%) | 3mo | $540,000 | $378 | 48 |
| 79A Alder Dr | 0.44mi | 3/2.0 | 1,416 (-14%) | 11mo | $545,000 | $385 | 46 |
| 30 Washington Ave | 0.52mi | 3/2.5 | 1,808 (+10%) | 13mo | $550,000 | $304 | 43 |
Match score weights: distance 35% · size 25% · config 20% · recency 20%. Top-matched comps best support the ARV.
Projected returns pro-forma
10.0% appreciation · 3.0% rent growth · sell at horizon
- IRR
- 20.4%
- Equity multiple
- 2.65×
- Total profit
- $249,722
- Equity at exit
- $485,574
- IRR
- 18.6%
- Equity multiple
- 6.10×
- Total profit
- $769,920
- Equity at exit
- $1,047,158
Cash invested: $150,920 (down + closing). Projections, not guarantees.
Landlord ↔ Tenant lean methodology
- Overall (STATE)
- 15 Strongly Tenant-Friendly
- State New York
- 15 Strongly Tenant-Friendly · D+10
- County
- — inherits STATE
- City
- — inherits STATE
ZIP-level market 11951
- Home prices YoY
- 4.3%
- Active inventory
- 133
- Price-to-rent
- 11.9×
Monthly cashflow live
- Estimated rent
- $3,772 medium interval (Pro) →
- Mortgage (P&I)
- −$2,827
- Tax from tax record
- −$617 /mo · $7,408/yr
- Insurance
- −$225
- HOA
- −$0
- Vacancy / Maint / Mgmt
- −$792
- Net cashflow
- $-689
Break-even live
UW: 25.0% down · 7.5% · 30yr · 1.5% tax · 5.0% vac · 8.0% maint · 8.0% mgmt
Financing live
Cash to close
- Down payment
- $134,750
- Closing costs
- $16,170
- Reserves months
- —
- Total cash needed
- —
Loan-product check · same deal, 3 products live
Conventional
25% down · 7.5% · 30yr
- Down + closing
- —
- Monthly P&I
- —
- Monthly cashflow
- —
- DSCR
- —
- Eligible?
- —
Personal DTI + credit; lowest rate.
DSCR
20% down · 8.5% · 30yr
- Down + closing
- —
- Monthly P&I
- —
- Monthly cashflow
- —
- DSCR
- —
- Eligible?
- —
No personal income docs; deal must DSCR.
Hard money
10% down · 12.0% · 12mo
- Down + closing
- —
- Monthly P&I
- —
- Monthly cashflow
- —
- DSCR
- —
- Eligible?
- —
Short-term bridge; refi at stabilization.
Rent comps 4 comps
| Address | Beds | Baths | Sqft | Rent | $/sqft | DOM | Units | Dist |
|---|---|---|---|---|---|---|---|---|
| 192 Cypress Dr Mastic Beach, NY | 4.0 | 2.0 | 1404 | $3,800 | $2.71 | 44d | 1 | 0.33mi |
| 149 Washington Dr Mastic Beach, NY | 3.0 | 1.0 | 1152 | $3,400 | $2.95 | 1d | 1 | 0.59mi |
| 126 Flower Rd Shirley, NY | 4.0 | 1.0 | 1756 | $4,100 | $2.33 | 1d | 1 | 1.38mi |
| 165 Lynbrook Dr Mastic Beach, NY | 3.0 | 2.0 | 1520 | $4,000 | $2.63 | 1d | 1 | 1.42mi |
Listing history 3 events
-
2026-04-15status Pending
-
2026-03-14$539,000 Active
-
2026-03-11historical $539,000
ⓘ Source: listings_history table (triggers on properties + properties_extension) + one-shot
backfill from property_details.listing_events for pre-trigger history.
Tax reassessment forecast NY · Partial reset (capped growth)
- Current annual tax
- $7,408 · $617/mo
- Projected year-2 tax
- $8,259 · $688/mo
- Expected delta
- +$850/yr (+$71/mo · 11.5%)
ⓘ Screening estimate from a state-policy table — verify with the county assessor before closing.
Climate risk First Street
- Flood 1/10 Low FEMA zone X (unshaded) · 0% chance over 30 yrs
- Wildfire 2/10 Low
- Heat 4/10 Moderate 7 d/yr ≥91°F today · 19 d/yr by 30 yrs out
- Wind 8/10 Severe 80% chance of damaging wind over 30 yrs
- Air quality 4/10 Moderate 3 unhealthy d/yr today · 5 by 30 yrs out
Nearby sold comps map
Loading sold comps map…
Walkable amenities ~0.75 mi
Loading nearby amenities…
Taxation est. · year 1
- Rental income
- $45,265
- − Mortgage interest
- −$30,192
- − Property taxes
- −$7,408
- − Insurance
- −$2,695
- − Repairs & maintenance
- −$3,621
- − Management
- −$3,621
- − Depreciation
- −$15,680
- Taxable loss
- −$17,953
- Est. tax savings @ 24.0%
- +$4,309
- After-tax cash flow
- $-3,954/yr
For passive investors: Depreciation is non-cash, so a rental often shows a tax loss while cash-flowing — sheltering income. Rental losses are passive: they offset passive income freely, and up to $25,000/yr can offset ordinary (W-2) income if you actively participate and your MAGI is under $100k (phasing out to $0 by $150k); unused losses carry forward. On sale, claimed depreciation is recaptured at up to 25%, and gains may owe capital-gains tax (a 1031 exchange can defer both). Figures are a year-1 estimate at your 24.0% rate — not tax advice; consult a CPA.
Schools (NCES district)
- District
- William Floyd Union Free School District
- NCES district ID
- 3618690
- Math proficiency
- 48% ▲ 3.00%
- Reading proficiency
- 57% ▲ 11.00%
- Median HH income
- $70,564
- Composite
- 46.79/100
- National rank
- #2383
- State rank
- #309 of 590 in NY
Livability — Mastic Beach
- Score
- 61/100
- State rank
- #936
- US rank
- #18216
Category grades
Schools grade is shown separately in the Schools card above.
Census & demographics
- Census place
- Mastic Beach, NY
- City population
- 15,830
- Population (ZIP)
- 15,830
Population outlook (Suffolk County) Hauer SSP2
- Today (2025)
- 1,505,262 people
- By 2030
- 1,498,318 · -0.5%
- By 2040
- 1,471,101 · -2.3%
- By 2050
- 1,424,848 · -5.3%
- By 2075
- 1,337,157 · -11.2%
- By 2100
- 1,217,720 · -19.1%
Race, ethnicity, and origin ACS 2023
- Neighborhood character
- Predominantly White (68%)
- Race & ethnicity
- White 68% Hispanic / Latino 17% Two or more races 9% Black 6% Asian 2%
- Hispanic origin (detail)
- Mexican 1% Puerto Rican 6% Cuban 2%
- Common ancestry
- Lithuanian 3% Romanian 2% Italian 2%
- Foreign-born
- 7% · Canada, Vietnam
- Languages at home
- 84% English-only · Spanish 10% Other Indo-European 3% Chinese 1%
Political lean MEDSL · Suffolk
- 2024 margin
- Lean R (+10.0) · D 45.0% · R 55.0%
- 2008→2024 swing
- -16.0pp toward R · 2008: 6.0pp · 2024: -10.0pp
- All cycles
- 2024: R+10.0 2020: R+0.0 2016: R+8.2 2012: D+2.9 2008: D+6.0
Not yet ingested
- Civics
- —
Market trends
- HPI YoY
- ▲ 34.46%
- Current HPI
- 829.86
- Rent YoY
- —
- Metro
- —
- State GDP YoY
- ▲ 2.60%
- F500 in state
- 92
Industry mix (Fortune 500 HQ in NY)
| Industry | F500 HQs | Revenue |
|---|---|---|
| Financial Services | 10 | $950B |
|
||
| Consumer Goods | 9 | $162B |
|
||
| Insurance | 4 | $225B |
|
||
| Telecommunications | 2 | $144B |
|
||
| Pharmaceuticals | 2 | $112B |
|
||
| Media / Entertainment | 2 | $69B |
|
||
Price history
+0.0% since first listed3 events — show timeline
- 2026-04-15 Pending — OneKey® MLS as Distributed by MLS Grid
- 2026-03-14 Listed $539,000 OneKey® MLS as Distributed by MLS Grid
- 2026-03-11 Coming Soon $539,000 OneKey® MLS as Distributed by MLS Grid
Property tax history
+1.6%/yrLatest (2025): $7,408 · +0.0% YoY. Source: county tax records.
Cash-flow waterfall
monthlySold comps — $/sqft
last 12 mo · ≤1 miLoading sold comps…