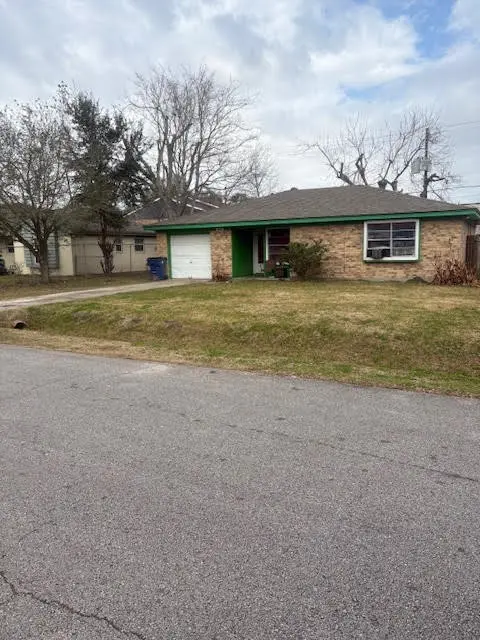
8510 Shiloh Dr · Texas City, TX
Flood risk 4/10 · Minor
- FEMA flood zone
- X (unshaded)
- Chance of flooding over 30 yrs
- 0.22%
- Est. flood insurance / yr
- $507 – $1,088
Fire risk 2/10 · Minimal
- Est. fire insurance / yr
- $1,222 – $2,270
Heat risk 10/10 · Severe
- Hot days now (above 110°F)
- 7 days/yr
- Hot days in 30 yrs
- 27 days/yr
Wind risk 10/10 · Severe
- Chance of severe wind over 30 yrs
- 99.0%
Air-quality risk 3/10 · Minor
- Unhealthy air days now
- 2 days/yr
- Unhealthy air days in 30 yrs
- 2 days/yr
Risk factors via First Street. Map © Google.
Why this score? — see what drove the C- grade
The composite is a weighted blend of 9 inputs, each scored 0–100. Each bar is that input's sub-score; the figure is the points it added to the 100-point composite (weight × sub-score).
- Cash flow +15.4/30.0
- ARV discount +15.0/15.0
- 1% rule +6.1/10.0
- DSCR +4.7/10.0
- Rent growth +3.7/5.0
- Livability +3.1/5.0
- Condition / age +2.5/5.0
- Schools +2.4/10.0
- Appreciation +0.0/10.0
$129,000
🖨 Deal sheet 📄 Offer letter ✓ Due diligence
Listing remarks MLS
Great Opportunity to own in an established neighborhood with strong upside potential! This home is perfect for a buyer looking to build equity or an investor seeking their next project. Home offers solid structure with the opportunity for cosmetic updates and improvements to maximize value. Ideal for Cash or Conventional buyers ready to take advantage of a value-add opportunity. Seller is reviewing all offers as they are received- submit highest and best.
Key facts
- 6,551 sq ft lot
- Garage
- Built 1970
Tags
Neighborhood map
What this means for you Summary
Snapshot
- This is a 3-bed/1.5-bath single-family listed at $129k.
Deal economics
- At list price, monthly cash flow is $51 ($607/yr) — positive.
- The deal already cash-flows at list — no discount required.
- Meets the 1% rule at list price ($1k rent vs $129k).
- Recommended offer: $117k (9.0% below list) — sets the bar for market timing.
- Cap rate 6.8% vs local median 4.3% in Texas City — top-decile yield for the area; either an underpriced asset or a hidden risk that comps aren't pricing in. Stress-test before assuming the spread holds.
Location & tenants
- Location reads 62/100 on livability (#907 in TX) — a middle-class / working-renter tenant base. Strengths: cost of living A+, housing A+; Watch: crime D+, schools F, amenities F.
- Texas City ISD (suburban): math 28% / reading 29% proficiency, ranked #655 of 826 in TX (top 79%) — low school quality limits family demand, transient renter base, plan for 1-2y turnover; 66% free/reduced lunch — lower-income household profile, screen leases tightly.
- Market conditions: Rents rising fast (+4.7%/yr); 240 active listings in the ZIP; 5 comparable units currently listed for rent nearby; rentals lingering (median 44d on market — plan ~5-8 weeks vacancy on turnover, expect pricing pressure); 60% of comp listings sitting > 30 days — soft ceiling on asking rent; 3,258 units permitted in Galveston County in 2024 (0 in 5+ unit buildings).
Forward outlook
- Local home prices are declining (-3.0%/yr); year-one equity from $892 of loan paydown is wiped out by about $4k of value loss. Plan a longer hold.
- Galveston County population projected at +43% by 2050 — long-run rental-demand tailwind backs the buy-and-hold thesis.
Negotiation context
- It's been on market 97 days — a 9% lower offer ($117k) is reasonable based on typical stale-listing flexibility.
Risks & watch-outs
- Watch-outs: property tax is 3.3% of price.
- Climate carrying-cost: severe wind risk, 99% chance of damaging wind over 30y; extreme-heat days projected 7→27/yr by 2055 (HVAC capex compounding) — expect insurance premiums to compound above CPI over the hold.
Questions for the listing agent
- It's been on market 97 days. Have you received any prior offers? Is the seller open to a 9% concession, seller financing, or rate buy-down credit?
- Built in 1970 — when were the roof, HVAC, electrical panel, plumbing, and water heater last replaced?
- Property tax is high relative to price — has the assessment been appealed recently, and will the sale trigger a re-assessment?
- Why hasn't it sold? Are there any deal-killer items the seller is aware of (foundation, flood, title, zoning, code violations)?
- Is there a deadline driving the sale (1031 exchange, divorce, estate, relocation)? That informs how much negotiation room exists.
- Schools are F-rated, which usually means shorter tenancies and higher turnover. Who's the typical renter profile here, and what's been the actual vacancy rate?
- Crime grade is D in this area — have there been break-ins, vandalism, or insurance claims at this property in the last 3 years? What carrier currently insures it and at what premium?
- What's the average days-on-market for RENTAL listings here right now (not sales)? A rising rental-DOM trend means longer vacancies and softer asking-rent achievability than the comps imply.
- What's the recent tenant-quality profile in this submarket — average credit score on applications, eviction rate, late-payment / NSF rate, and stable-employment percentage? A property-management company in the area should have these aggregated.
- How much new for-sale + rental construction is in the pipeline within 1–3 miles? Heavy new supply typically softens prices + rents 12–24 months out; constrained supply supports both.
Investment metrics
- 1% rule
- 1.11% ✓
- Cap rate
- 6.76%
- Cash-on-cash
- 1.68%
- DSCR
- 1.07
- GRM
- 7.5
CMA / ARV
- ARV (median comp)
- $165,541
- List price
- $129,000
- Delta
- -22.07%
- Verdict
- UNDERPRICED
- Comps
- 20 within 1.0 mi
Show comp detail 12 sales within ~0.75 mi
| Address | Dist | Beds/Ba | Sqft | Sold | Price | $/sf | Match |
|---|---|---|---|---|---|---|---|
| 8510 Shiloh Dr | 0.00mi | 3/1.5 | 1,129 (0%) | 1mo | $129,000 | $114 | 99 |
| 1314 N Noble Rd | 0.08mi | 3/1.5 | 1,144 (+1%) | 12mo | $140,000 | $122 | 84 |
| 1213 N Natchez Dr | 0.16mi | 3/2.0 | 1,174 (+4%) | 3mo | $194,900 | $166 | 82 |
| 1118 N Noble Rd | 0.18mi | 3/2.0 | 1,102 (-2%) | 6mo | $199,700 | $181 | 81 |
| 1122 N Natchez Dr | 0.18mi | 3/1.5 | 1,180 (+4%) | 5mo | $98,000 | $83 | 80 |
| 1113 N Noble Rd | 0.19mi | 3/1.5 | 1,059 (-6%) | 3mo | $150,000 | $142 | 78 |
| 617 N Noble Rd | 0.52mi | 3/1.5 | 1,200 (+6%) | 0mo | $220,000 | $183 | 65 |
| 1302 Appomattox Dr | 0.14mi | 4/2.0 (+1) | 1,224 (+8%) | 11mo | $60,000 | $49 | 63 |
| 7615 Stella Marina Way | 0.68mi | 3/2.0 | 1,234 (+9%) | 9mo | $239,895 | $194 | 44 |
| 2010 Redfish Dr | 0.49mi | 3/2.0 | 1,264 (+12%) | 17mo | $225,000 | $178 | 41 |
| 9205 Vicksburg Ave | 0.64mi | 4/2.0 (+1) | 1,280 (+13%) | 5mo | $189,970 | $148 | 36 |
| 2216 Redfish Dr | 0.59mi | 3/2.0 | 1,294 (+15%) | 18mo | $220,000 | $170 | 31 |
Match score weights: distance 35% · size 25% · config 20% · recency 20%. Top-matched comps best support the ARV.
Projected returns pro-forma
-3.0% appreciation · 4.67% rent growth · sell at horizon
- IRR
- -11.3%
- Equity multiple
- 0.58×
- Total profit
- $-15,096
- Equity at exit
- $19,234
- IRR
- 0.7%
- Equity multiple
- 1.05×
- Total profit
- $1,955
- Equity at exit
- $11,154
Cash invested: $36,120 (down + closing). Projections, not guarantees.
Landlord ↔ Tenant lean methodology
- Overall (STATE)
- 87 Strongly Landlord-Friendly
- State Texas
- 87 Strongly Landlord-Friendly · R+5
- County
- — inherits STATE
- City
- — inherits STATE
ZIP-level market 77591
- Home prices YoY
- -5.6%
- Rents YoY
- 4.7%
- Active inventory
- 240
- Price-to-rent
- 7.5×
Monthly cashflow live
- Estimated rent
- $1,432 high interval (Pro) →
- Mortgage (P&I)
- −$676
- Tax from tax record
- −$351 /mo · $4,210/yr
- Insurance
- −$54
- HOA
- −$0
- Vacancy / Maint / Mgmt
- −$301
- Net cashflow
- $51
Break-even live
UW: 25.0% down · 7.5% · 30yr · 1.5% tax · 5.0% vac · 8.0% maint · 8.0% mgmt
Financing live
Cash to close
- Down payment
- $32,250
- Closing costs
- $3,870
- Reserves months
- —
- Total cash needed
- —
Loan-product check · same deal, 3 products live
Conventional
25% down · 7.5% · 30yr
- Down + closing
- —
- Monthly P&I
- —
- Monthly cashflow
- —
- DSCR
- —
- Eligible?
- —
Personal DTI + credit; lowest rate.
DSCR
20% down · 8.5% · 30yr
- Down + closing
- —
- Monthly P&I
- —
- Monthly cashflow
- —
- DSCR
- —
- Eligible?
- —
No personal income docs; deal must DSCR.
Hard money
10% down · 12.0% · 12mo
- Down + closing
- —
- Monthly P&I
- —
- Monthly cashflow
- —
- DSCR
- —
- Eligible?
- —
Short-term bridge; refi at stabilization.
Rent comps 5 comps
| Address | Beds | Baths | Sqft | Rent | $/sqft | DOM | Units | Dist |
|---|---|---|---|---|---|---|---|---|
| 8807 Emmett F Lowry Expy Texas City, TX | 2.0 | 2.0 | 987 | $1,105 | $1.12 | 43d | 1 | 0.19mi |
| 7561 Medical Center Dr Texas City, TX | 2.0 | 2.0 | 892 | $1,113 | $1.25 | 43d | 1 | 0.73mi |
| 9001 Glacier Ave Texas City, TX | 2.0 | 2.0 | 1062 | $1,180 | $1.11 | 15d | 4 | 0.84mi |
| 7510 Hummingbird Ln Texas City, TX | 3.0 | 1.5 | 1200 | $1,550 | $1.29 | 2d | 1 | 1.28mi |
| 6607 Memorial Dr Texas City, TX | 2.0 | 1.0 | 936 | $1,200 | $1.28 | 43d | 1 | 1.32mi |
Listing history 5 events
-
2026-05-14price $129,000 460-char remark
Show marketing remark (460 chars)
Great Opportunity to own in an established neighborhood with strong upside potential! This home is perfect for a buyer looking to build equity or an investor seeking their next project. Home offers solid structure with the opportunity for cosmetic updates and improvements to maximize value. Ideal for Cash or Conventional buyers ready to take advantage of a value-add opportunity. Seller is reviewing all offers as they are received- submit highest and best.
-
2026-05-11price $149,000 460-char remark
Show marketing remark (460 chars)
Great Opportunity to own in an established neighborhood with strong upside potential! This home is perfect for a buyer looking to build equity or an investor seeking their next project. Home offers solid structure with the opportunity for cosmetic updates and improvements to maximize value. Ideal for Cash or Conventional buyers ready to take advantage of a value-add opportunity. Seller is reviewing all offers as they are received- submit highest and best.
-
2026-03-17price $159,000 460-char remark
Show marketing remark (460 chars)
Great Opportunity to own in an established neighborhood with strong upside potential! This home is perfect for a buyer looking to build equity or an investor seeking their next project. Home offers solid structure with the opportunity for cosmetic updates and improvements to maximize value. Ideal for Cash or Conventional buyers ready to take advantage of a value-add opportunity. Seller is reviewing all offers as they are received- submit highest and best.
-
2026-03-06price $169,500 460-char remark
Show marketing remark (460 chars)
Great Opportunity to own in an established neighborhood with strong upside potential! This home is perfect for a buyer looking to build equity or an investor seeking their next project. Home offers solid structure with the opportunity for cosmetic updates and improvements to maximize value. Ideal for Cash or Conventional buyers ready to take advantage of a value-add opportunity. Seller is reviewing all offers as they are received- submit highest and best.
-
2026-02-13$179,000 Active 460-char remark
Show marketing remark (460 chars)
Great Opportunity to own in an established neighborhood with strong upside potential! This home is perfect for a buyer looking to build equity or an investor seeking their next project. Home offers solid structure with the opportunity for cosmetic updates and improvements to maximize value. Ideal for Cash or Conventional buyers ready to take advantage of a value-add opportunity. Seller is reviewing all offers as they are received- submit highest and best.
ⓘ Source: listings_history table (triggers on properties + properties_extension) + one-shot
backfill from property_details.listing_events for pre-trigger history.
Tax reassessment forecast TX · Resets to sale price
- Current annual tax
- $4,210 · $351/mo
- Projected year-2 tax
- $4,210 · $351/mo
- Expected delta
- $0/yr ($0/mo · 0.0%)
ⓘ Screening estimate from a state-policy table — verify with the county assessor before closing.
Climate risk First Street
- Flood 4/10 Moderate FEMA zone X (unshaded) · 22% chance over 30 yrs
- Wildfire 2/10 Low
- Heat 10/10 Extreme 7 d/yr ≥110°F today · 27 d/yr by 30 yrs out
- Wind 10/10 Extreme 99% chance of damaging wind over 30 yrs
- Air quality 3/10 Moderate 2 unhealthy d/yr today · 2 by 30 yrs out
Nearby sold comps map
Loading sold comps map…
Walkable amenities ~0.75 mi
Loading nearby amenities…
Taxation est. · year 1
- Rental income
- $17,190
- − Mortgage interest
- −$7,226
- − Property taxes
- −$4,210
- − Insurance
- −$645
- − Repairs & maintenance
- −$1,375
- − Management
- −$1,375
- − Depreciation
- −$3,753
- Taxable loss
- −$1,394
- Est. tax savings @ 24.0%
- +$335
- After-tax cash flow
- $942/yr
For passive investors: Depreciation is non-cash, so a rental often shows a tax loss while cash-flowing — sheltering income. Rental losses are passive: they offset passive income freely, and up to $25,000/yr can offset ordinary (W-2) income if you actively participate and your MAGI is under $100k (phasing out to $0 by $150k); unused losses carry forward. On sale, claimed depreciation is recaptured at up to 25%, and gains may owe capital-gains tax (a 1031 exchange can defer both). Figures are a year-1 estimate at your 24.0% rate — not tax advice; consult a CPA.
Schools (NCES district)
- District
- Texas City ISD
- NCES district ID
- 4842510
- Math proficiency
- 28% ▼ -10.00%
- Reading proficiency
- 29% ▼ -4.00%
- Median HH income
- $44,875
- Composite
- 24.47/100
- National rank
- #7664
- State rank
- #655 of 826 in TX
Livability — Texas City
- Score
- 62/100
- State rank
- #907
- US rank
- #16268
Category grades
Schools grade is shown separately in the Schools card above.
Census & demographics
- Census place
- Texas City, TX
- County
- Galveston County · 357,330 people
- City population
- 49,936
- Metro
- Houston-The Woodlands-Sugar Land, TX
- Population (ZIP)
- 18,294
- Household income
- $68,593
- Rent vs Own
- Severe rent burden
- 718.0
Population outlook (Galveston County) Hauer SSP2
- Today (2025)
- 390,640 people
- By 2030
- 425,226 · +8.9%
- By 2040
- 493,765 · +26.4%
- By 2050
- 559,698 · +43.3%
- By 2075
- 719,260 · +84.1%
- By 2100
- 819,628 · +109.8%
Race, ethnicity, and origin ACS 2023
- Neighborhood character
- Diverse neighborhood (Simpson 0.65)
- Race & ethnicity
- Black 50% White 26% Hispanic / Latino 19% Two or more races 9% Asian 2%
- Hispanic origin (detail)
- Mexican 15%
- Common ancestry
- Lithuanian 2% Romanian 1% Slovak 1%
- Foreign-born
- 7% · Canada, China
- Languages at home
- 88% English-only · Spanish 9% Other Indo-European 1% Chinese 1%
Political lean MEDSL · Galveston
- 2024 margin
- Strong R (+27.4) · D 35.7% · R 63.1% · Other 1.2%
- 2008→2024 swing
- -7.9pp toward R · 2008: -19.5pp · 2024: -27.4pp
- All cycles
- 2024: R+27.4 2020: R+22.6 2016: R+22.6 2012: R+26.9 2008: R+19.5
Not yet ingested
- Civics
- —
Market trends
- HPI YoY
- ▼ -14.63%
- Current HPI
- 247.1905
- Rent YoY
- ▲ 4.67%
- Metro
- Houston-The Woodlands-Sugar Land, TX
- State GDP YoY
- ▲ 3.95%
- F500 in state
- 110
Industry mix (Fortune 500 HQ in TX)
| Industry | F500 HQs | Revenue |
|---|---|---|
| Energy | 16 | $1,198B |
|
||
| Technology | 5 | $198B |
|
||
| Engineering / Construction | 4 | $72B |
|
||
| Energy Services | 3 | $60B |
|
||
| Utilities | 3 | $41B |
|
||
| Healthcare | 2 | $330B |
|
||
Price history
-27.9% since first listed5 events — show timeline
- 2026-05-14 Price Changed $129,000 HARMLS
- 2026-05-11 Price Changed $149,000 HARMLS
- 2026-03-17 Price Changed $159,000 HARMLS
- 2026-03-06 Price Changed $169,500 HARMLS
- 2026-02-13 Listed $179,000 HARMLS
Property tax history
+9.7%/yrLatest (2025): $4,210 · -0.6% YoY. Source: county tax records.
Cash-flow waterfall
monthlySold comps — $/sqft
last 12 mo · ≤1 miLoading sold comps…