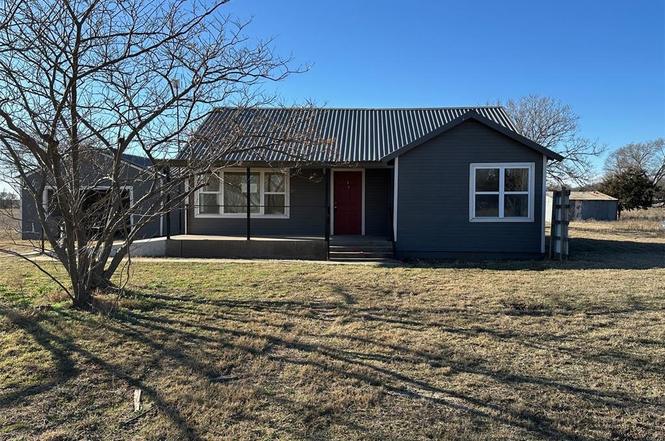
17262 E 1150 Rd · Sweetwater, OK
Flood risk 1/10 · Minimal
- FEMA flood zone
- X
- Chance of flooding over 30 yrs
- 0.0%
- Est. flood insurance / yr
- $507 – $1,088
Fire risk 7/10 · Major
- Est. fire insurance / yr
- $2,463 – $4,575
Heat risk 6/10 · Moderate
- Hot days now (above 105°F)
- 7 days/yr
- Hot days in 30 yrs
- 18 days/yr
Wind risk 2/10 · Minimal
- Chance of severe wind over 30 yrs
- 4.0%
Air-quality risk 1/10 · Minimal
- Unhealthy air days now
- 0 days/yr
- Unhealthy air days in 30 yrs
- 0 days/yr
Risk factors via First Street. Map © Google.
Why this score? — see what drove the C+ grade
The composite is a weighted blend of 9 inputs, each scored 0–100. Each bar is that input's sub-score; the figure is the points it added to the 100-point composite (weight × sub-score).
- Cash flow +24.7/30.0
- DSCR +8.0/10.0
- ARV discount +7.5/15.0
- 1% rule +6.4/10.0
- Appreciation +5.0/10.0
- Schools +3.1/10.0
- Livability +2.9/5.0
- Rent growth +2.5/5.0
- Condition / age +2.5/5.0
$86,300
🖨 Deal sheet 📄 Offer letter ✓ Due diligence
Listing remarks
Auction Dates: 5/25/2026 - 5/27/2026 This property is now under auction terms Secluded farmhouse located south of Sweetwater. Recently updated and ready to move into. All HUD properties are sold AS-IS. HUD case #421-628588 PROPERTY SOLD AS-IS
Key facts
- Recently updated
- Secluded farmhouse
- 3.45 acre lot
Tags
Property features AI
Finance
- Other: REO / Bank owned; Listed as active; Living area reported as 1,200 (appraisal source)
- Financial info: Not assumable; Does not apply for loan qualification
- HOA & community: No mandatory association dues
Exterior
- Parking: 2-car garage
- Home design: Single-family residence; One level; Residential property; Existing property
- Construction: Frame construction; Metal roof; Combination foundation; Built (existing)
- Exterior features: Rural lot; Approximately 3.45 acres
Interior
- Kitchen: Range
- Bedrooms: 2 bedrooms
- Bathrooms: 1 full bath; 1 half bath
- Interior features: One living area; No fireplace; Below-ground storm shelter; Outbuildings on the property; Covered porch; Covered patio
- Laundry & utility: Combination foundation (utility access implied)
Neighborhood map
What this means for you Summary
Snapshot
- This is a 2-bed/1.0-bath single-family listed at $86k.
Deal economics
- At list price, monthly cash flow is $180 ($2k/yr) — positive.
- The deal already cash-flows at list — no discount required.
- Meets the 1% rule at list price ($983 rent vs $86k).
- Recommended offer: $76k (12.0% below list) — sets the bar for market timing.
Location & tenants
- Location reads 58/100 on livability (#443 in OK) — a working-class tenant base; expect higher turnover. Strengths: cost of living A+; Watch: crime D+, employment D, amenities F.
- Sweetwater (rural): math 35% / reading 30% proficiency, ranked #211 of 513 in OK (top 41%) — families likely to look elsewhere, expect single-tenant / working-renter base with shorter leases; 62% free/reduced lunch — lower-income household profile, screen leases tightly.
- Zoned schools: Sweetwater Es (math 24% / reading 24%, grade F, #354 of 845 statewide, top 47%, 85 students, 0% FRL); Sweetwater Hs (math 24% / reading 24%, grade F, #150 of 447 statewide, top 48%, 37 students, 0% FRL) — zoned schools average 0% FRL vs 62% district-wide (62 pts lower); this property's tenant base skews higher-income than the district average.
- Market conditions: 4 active listings in the ZIP; 16 units permitted in Beckham County in 2024 (0 in 5+ unit buildings).
Forward outlook
- In year one you build about $3k of equity ($597 loan paydown + $3k appreciation (3.0% local appreciation)).
- Beckham County population projected at +35% by 2050 — long-run rental-demand tailwind backs the buy-and-hold thesis.
- At projected returns (3.0% appreciation + 3.0% rent growth), your $24k cash investment doubles in ~5 years — after that, you're playing with house money.
- By year 10, paydown + projected appreciation supports a ~$31k cash-out refi (75% LTV) — recoverable capital for the next deal without selling this one.
Negotiation context
- It's been on market 400 days — a 12% lower offer ($76k) is reasonable based on typical stale-listing flexibility.
- 3 sale attempts; this cycle's ask has dropped $78k (47%) from the opening price — seller is motivated, your offer sets the floor, not the list.
Risks & watch-outs
- Watch-outs: built in 1950 — expect roof / HVAC / electrical / plumbing capex.
- Climate carrying-cost: major wildfire risk; extreme-heat days projected 7→18/yr by 2055 (HVAC capex compounding) — expect insurance premiums to compound above CPI over the hold.
Questions for the listing agent
- It's been on market 400 days. Have you received any prior offers? Is the seller open to a 12% concession, seller financing, or rate buy-down credit?
- Built in 1950 — when were the roof, HVAC, electrical panel, plumbing, and water heater last replaced?
- Why hasn't it sold? Are there any deal-killer items the seller is aware of (foundation, flood, title, zoning, code violations)?
- Is there a deadline driving the sale (1031 exchange, divorce, estate, relocation)? That informs how much negotiation room exists.
- Schools are D-rated, which usually means shorter tenancies and higher turnover. Who's the typical renter profile here, and what's been the actual vacancy rate?
- Crime grade is D in this area — have there been break-ins, vandalism, or insurance claims at this property in the last 3 years? What carrier currently insures it and at what premium?
- What's the average days-on-market for RENTAL listings here right now (not sales)? A rising rental-DOM trend means longer vacancies and softer asking-rent achievability than the comps imply.
- What's the recent tenant-quality profile in this submarket — average credit score on applications, eviction rate, late-payment / NSF rate, and stable-employment percentage? A property-management company in the area should have these aggregated.
- How much new for-sale + rental construction is in the pipeline within 1–3 miles? Heavy new supply typically softens prices + rents 12–24 months out; constrained supply supports both.
Investment metrics
- 1% rule
- 1.14% ✓
- Cap rate
- 8.80%
- Cash-on-cash
- 8.96%
- DSCR
- 1.40
- GRM
- 7.3
CMA / ARV
No comps found within radius.
Projected returns pro-forma
3.0% appreciation · 3.0% rent growth · sell at horizon
- IRR
- 15.9%
- Equity multiple
- 1.91×
- Total profit
- $21,905
- Equity at exit
- $38,804
- IRR
- 17.5%
- Equity multiple
- 3.56×
- Total profit
- $61,905
- Equity at exit
- $59,802
Cash invested: $24,164 (down + closing). Projections, not guarantees.
Landlord ↔ Tenant lean methodology
- Overall (STATE)
- 83 Strongly Landlord-Friendly
- State Oklahoma
- 83 Strongly Landlord-Friendly · R+20
- County
- — inherits STATE
- City
- — inherits STATE
ZIP-level market 73666
- Active inventory
- 4
- Price-to-rent
- 7.3×
Monthly cashflow live
- Estimated rent
- $983 medium interval (Pro) →
- Mortgage (P&I)
- −$453
- Tax est. 1.5%
- −$108 /mo · $1,294/yr
- Insurance
- −$36
- HOA
- −$0
- Vacancy / Maint / Mgmt
- −$207
- Net cashflow
- $180
Break-even live
UW: 25.0% down · 7.5% · 30yr · 1.5% tax · 5.0% vac · 8.0% maint · 8.0% mgmt
Financing live
Cash to close
- Down payment
- $21,575
- Closing costs
- $2,589
- Reserves months
- —
- Total cash needed
- —
Loan-product check · same deal, 3 products live
Conventional
25% down · 7.5% · 30yr
- Down + closing
- —
- Monthly P&I
- —
- Monthly cashflow
- —
- DSCR
- —
- Eligible?
- —
Personal DTI + credit; lowest rate.
DSCR
20% down · 8.5% · 30yr
- Down + closing
- —
- Monthly P&I
- —
- Monthly cashflow
- —
- DSCR
- —
- Eligible?
- —
No personal income docs; deal must DSCR.
Hard money
10% down · 12.0% · 12mo
- Down + closing
- —
- Monthly P&I
- —
- Monthly cashflow
- —
- DSCR
- —
- Eligible?
- —
Short-term bridge; refi at stabilization.
Listing history 27 events
-
2026-06-18days on market $86,300 Active 400 DOM
-
2026-06-17days on market $86,300 Active 399 DOM
-
2026-06-16days on market $86,300 Active 398 DOM
-
2026-06-15days on market $86,300 Active 397 DOM
-
2026-06-13days on market $86,300 Active 395 DOM
-
2026-06-12days on market $86,300 Active 394 DOM
-
2026-06-09days on market $86,300 Active 391 DOM
-
2026-06-08days on market $86,300 Active 390 DOM
-
2026-06-08days on market $86,300 Active 389 DOM
-
2026-06-05days on market $86,300 Active 387 DOM
-
2026-06-04days on market $86,300 Active 385 DOM
-
2026-06-02days on market $86,300 Active 384 DOM
-
2026-06-01days on market $86,300 Active 383 DOM
-
2026-05-31days on market $86,300 Active 382 DOM
-
2026-04-16status Active
-
2026-04-16price $86,300
-
2026-03-10status Pending
-
2025-12-17price $86,250
-
2025-09-18price $118,080
-
2025-08-12price $131,200
-
2025-07-11price $144,320
-
2025-07-05status Active
-
2025-06-09status Pending
-
2025-03-12$164,000 Active
-
2022-09-02soldstatus $137,000
-
2006-03-10soldstatus $10,000
-
1993-01-29soldstatus $12,000
ⓘ Source: listings_history table (triggers on properties + properties_extension) + one-shot
backfill from property_details.listing_events for pre-trigger history.
Climate risk First Street
- Flood 1/10 Low FEMA zone X · 0% chance over 30 yrs
- Wildfire 7/10 Severe
- Heat 6/10 Major 7 d/yr ≥105°F today · 18 d/yr by 30 yrs out
- Wind 2/10 Low 4% chance of damaging wind over 30 yrs
- Air quality 1/10 Low 0 unhealthy d/yr today · 0 by 30 yrs out
Nearby sold comps map
Loading sold comps map…
Walkable amenities ~0.75 mi
Loading nearby amenities…
Taxation est. · year 1
- Rental income
- $11,801
- − Mortgage interest
- −$4,834
- − Property taxes
- −$1,294
- − Insurance
- −$432
- − Repairs & maintenance
- −$944
- − Management
- −$944
- − Depreciation
- −$2,511
- Taxable income
- $842
- Est. tax owed @ 24.0%
- −$202
- After-tax cash flow
- $1,964/yr
For passive investors: Depreciation is non-cash, so a rental often shows a tax loss while cash-flowing — sheltering income. Rental losses are passive: they offset passive income freely, and up to $25,000/yr can offset ordinary (W-2) income if you actively participate and your MAGI is under $100k (phasing out to $0 by $150k); unused losses carry forward. On sale, claimed depreciation is recaptured at up to 25%, and gains may owe capital-gains tax (a 1031 exchange can defer both). Figures are a year-1 estimate at your 24.0% rate — not tax advice; consult a CPA.
Schools (NCES district)
- District
- Sweetwater
- NCES district ID
- 4029310
- Math proficiency
- 35% ▼ -5.00%
- Reading proficiency
- 30% ▬ 0.00%
- Median HH income
- $47,880
- Composite
- 30.81/100
- National rank
- #11382
- State rank
- #211 of 513 in OK
Livability — Sweetwater
- Score
- 58/100
- State rank
- #443
- US rank
- #21292
Category grades
Schools grade is shown separately in the Schools card above.
Census & demographics
- City population
- 345
- Population (ZIP)
- 345
Population outlook (Beckham County) Hauer SSP2
- Today (2025)
- 26,564 people
- By 2030
- 28,217 · +6.2%
- By 2040
- 31,865 · +20.0%
- By 2050
- 35,862 · +35.0%
- By 2075
- 47,189 · +77.6%
- By 2100
- 55,622 · +109.4%
Race, ethnicity, and origin ACS 2023
- Neighborhood character
- Predominantly White (93%)
- Race & ethnicity
- White 93% Two or more races 6% Native American 1%
- Common ancestry
- Slovak 6% Serbian 3% Lithuanian 2%
Political lean MEDSL · Beckham
- 2024 margin
- Solid R (+70.1) · D 14.2% · R 84.3% · Other 1.4%
- 2008→2024 swing
- -14.0pp toward R · 2008: -56.1pp · 2024: -70.1pp
- All cycles
- 2024: R+70.1 2020: R+72.0 2016: R+70.8 2012: R+59.1 2008: R+56.1
Not yet ingested
- Civics
- —
Market trends
- HPI YoY
- —
- Current HPI
- —
- Rent YoY
- —
- Metro
- —
- State GDP YoY
- ▲ 1.55%
- F500 in state
- 6
Industry mix (Fortune 500 HQ in OK)
| Industry | F500 HQs | Revenue |
|---|---|---|
| Energy | 3 | $48B |
|
||
Price history
+619.2% since first listed13 events — show timeline
- 2026-04-16 Relisted — MLSOK
- 2026-04-16 Price Changed $86,300 MLSOK
- 2026-03-10 Pending — MLSOK
- 2025-12-17 Price Changed $86,250 MLSOK
- 2025-09-18 Price Changed $118,080 MLSOK
- 2025-08-12 Price Changed $131,200 MLSOK
- 2025-07-11 Price Changed $144,320 MLSOK
- 2025-07-05 Relisted — MLSOK
- 2025-06-09 Pending — MLSOK
- 2025-03-12 Listed $164,000 MLSOK
- 2022-09-02 Sold (Public Records) $137,000 Public Records
- 2006-03-10 Sold (Public Records) $10,000 Public Records
- 1993-01-29 Sold (Public Records) $12,000 Public Records
Property tax history
-2.9%/yrLatest (2025): $24 · +0.0% YoY. Source: county tax records.
Cash-flow waterfall
monthlySold comps — $/sqft
last 12 mo · ≤1 miLoading sold comps…