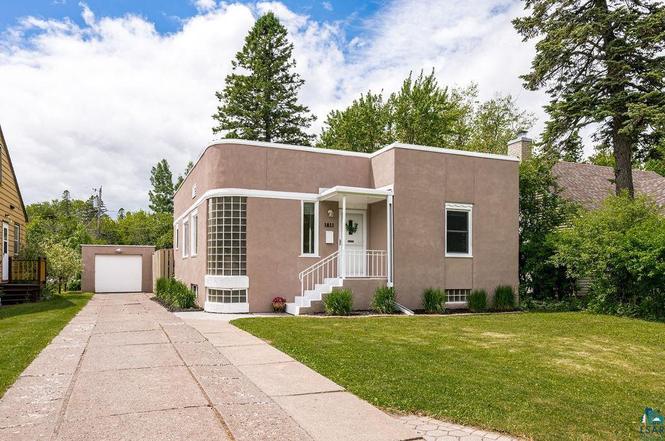
1811 Vermilion Rd · Duluth, MN
Flood risk 1/10 · Minimal
- FEMA flood zone
- X
- Chance of flooding over 30 yrs
- 0.0%
- Est. flood insurance / yr
- $473 – $860
Fire risk 1/10 · Minimal
- Est. fire insurance / yr
- $888 – $1,650
Heat risk 1/10 · Minimal
- Hot days now (above 89°F)
- 7 days/yr
- Hot days in 30 yrs
- 12 days/yr
Wind risk 1/10 · Minimal
- Chance of severe wind over 30 yrs
- —
Air-quality risk 2/10 · Minimal
- Unhealthy air days now
- 0 days/yr
- Unhealthy air days in 30 yrs
- 1 days/yr
Risk factors via First Street. Map © Google.
Why this score? — see what drove the D- grade
The composite is a weighted blend of 9 inputs, each scored 0–100. Each bar is that input's sub-score; the figure is the points it added to the 100-point composite (weight × sub-score).
- Cash flow +14.8/30.0
- DSCR +4.5/10.0
- Schools +4.2/10.0
- Livability +4.1/5.0
- 1% rule +3.6/10.0
- Rent growth +2.5/5.0
- Condition / age +2.5/5.0
- ARV discount +0.0/15.0
- Appreciation +0.0/10.0
$375,000
🖨 Deal sheet (PDF) 📄 Offer letter ✓ Due diligence
Listing remarks MLS
Welcome to a mid-century modern home located in friendly, quiet Hunters Park. Built by owners of Duluth's iconic European Bakery, this unique home has an open floor plan, flat roof, and mid-century modern woodwork. Quality is present throughout this three bedroom, two bathroom home; beautiful hardwood floors on the main level; the kitchen has quartz counter tops, original cabinets, and stainless steel appliances. Both bathrooms have heated floors and a jacuzzi tub on the main level. The basement has been completely redone this year with a new subway tile shower, a newly carpeted family room, a clean laundry room. A sauna has been wired and plumbed and just needs outer shell, seating and a stove. The backyard has a deck that looks out over a private, fenced backyard. Perfect if you have a dog. And since there are no deer in the yard, there is a raised-bed garden with a bed of asparagus, rhubarb, hopps, and grapes. From here you can walk a block and be hiking in Tischer Creek or a block more and be at Mount Royal or Duluth Yoga. This house is ideally located to access the best of Duluth.
Key facts
- Open floor plan
- Quartz countertops
- Hardwood floors
Tags
Property features AI
Finance
- Other: Residential property
Exterior
- Parking: Detached concrete garage with 1 car space
- Utilities: Public water; Public sewer
- Home design: Single-family detached residence; One story
- Construction: Stucco construction; Flat roof; Built above grade with additional below-grade finished area
- Exterior features: Deck; City street frontage; Lot approximately 50 x 190 (0.22 acres)
Interior
- Kitchen: Cooktop; Range; Dishwasher; Disposal; Exhaust fan; Refrigerator
- Bedrooms: Primary bedroom located downstairs
- Flooring: Hardwood flooring; Tile flooring
- Bathrooms: 1 full bathroom; 1 half bathroom
- Heating & cooling: Radiant heating (oil); No central cooling
- Interior features: Ceiling fans; Primary bedroom on main level; Full unfinished basement
- Laundry & utility: Washer hookup; Dryer
Neighborhood map
What this means for you Summary
Snapshot
- This is a 3-bed/2.0-bath single-family listed at $375k.
Deal economics
- At list price, monthly cash flow is $104 ($1k/yr) — positive.
- The deal already cash-flows at list — no discount required.
- To meet the 1% rule (rent ≥ 1% of price), the offer needs to be $323k (13.8% below list).
- Recommended offer: $323k (13.8% below list) — sets the bar for 1% rule.
- Cap rate 6.6% vs local median 4.9% in Duluth — top-decile yield for the area; either an underpriced asset or a hidden risk that comps aren't pricing in. Stress-test before assuming the spread holds.
Location & tenants
- Location reads 82/100 on livability (#36 in MN, #1,060 nationally) — a professional / high-income tenant draw. Strengths: commute A+, cost of living A+, housing A+; Watch: amenities F.
- Duluth Public School District (urban): math 44% / reading 55% proficiency, ranked #132 of 301 in MN (top 44%) — families likely to look elsewhere, expect single-tenant / working-renter base with shorter leases.
- Zoned schools: Congdon Elementary (math 71% / reading 76%, grade A, #41 of 857 statewide, top 5%, 452 students, 20% FRL); Ordean East Middle School (math 45% / reading 61%, grade C+, #53 of 258 statewide, top 22%, 989 students, 26% FRL); East High School (math 42% / reading 73%, grade C, #59 of 471 statewide, top 13%, 1,494 students, 23% FRL) — zoned schools average 23% FRL vs 39% district-wide (16 pts lower); this property's tenant base skews higher-income than the district average.
- Market conditions: 109 active listings in the ZIP; 2 comparable units currently listed for rent nearby; solid renter incomes; 639 units permitted in St. Louis County in 2024 (338 in 5+ unit buildings).
- This rent runs 37% of the median local income ($106k/yr) — at the standard rent-burdened threshold; future hikes will face affordability resistance.
Forward outlook
- Local home prices are declining (-3.0%/yr); year-one equity from $3k of loan paydown is wiped out by about $11k of value loss. Plan a longer hold.
Negotiation context
- Only 3 days on market — expect competitive offers; lowballing is unlikely to land.
- 12 sale attempts since 19y ago with the ask held roughly flat each time — persistent listings suggest the price (not the market) is what's stuck; bring a comps-based counter.
- Current owner paid $272k; 38% above their basis — modest negotiation headroom, anchor on the comps not their cost.
Risks & watch-outs
- Watch-outs: built in 1941 — expect roof / HVAC / electrical / plumbing capex.
Questions for the listing agent
- Built in 1941 — when were the roof, HVAC, electrical panel, plumbing, and water heater last replaced?
- Is there a deadline driving the sale (1031 exchange, divorce, estate, relocation)? That informs how much negotiation room exists.
- Schools are B-rated — typically a magnet for longer-tenancy family renters. What's the average tenant stay here, and is there a school-zone premium baked into asking?
- The area grade is low — what's the realistic commute time and amenity access for the typical tenant pool here? Any planned neighborhood developments (good or bad) we should know about?
- What's the average days-on-market for RENTAL listings here right now (not sales)? A rising rental-DOM trend means longer vacancies and softer asking-rent achievability than the comps imply.
- What's the recent tenant-quality profile in this submarket — average credit score on applications, eviction rate, late-payment / NSF rate, and stable-employment percentage? A property-management company in the area should have these aggregated.
- How much new for-sale + rental construction is in the pipeline within 1–3 miles? Heavy new supply typically softens prices + rents 12–24 months out; constrained supply supports both.
Investment metrics
- 1% rule
- 0.86% ✗
- Cap rate
- 6.62%
- Cash-on-cash
- 1.19%
- DSCR
- 1.05
- GRM
- 9.7
CMA / ARV
- ARV (on-the-fly)
- $304,842
- Comps found
- 2
Show comp detail 2 sales within ~0.75 mi
| Address | Dist | Beds/Ba | Sqft | Sold | Price | $/sf | Match |
|---|---|---|---|---|---|---|---|
| 111 Snively Rd | 0.33mi | 3/1.0 | 1,141 (+6%) | 22mo | $275,000 | $241 | 54 |
| 219 Mygatt Ave | 0.65mi | 2/1.0 (-1) | 1,152 (+7%) | 11mo | $325,000 | $282 | 40 |
Match score weights: distance 35% · size 25% · config 20% · recency 20%. Top-matched comps best support the ARV.
Projected returns pro-forma
-3.0% appreciation · 3.0% rent growth · sell at horizon
- IRR
- -14.4%
- Equity multiple
- 0.48×
- Total profit
- $-54,198
- Equity at exit
- $55,914
- IRR
- -5.7%
- Equity multiple
- 0.63×
- Total profit
- $-38,840
- Equity at exit
- $32,423
Cash invested: $105,000 (down + closing). Projections, not guarantees.
Landlord ↔ Tenant lean methodology
- Overall (STATE)
- 46 Balanced
- State Minnesota
- 46 Balanced · D+2
- County
- — inherits STATE
- City
- — inherits STATE
ZIP-level market 55803
- Active inventory
- 109
- Price-to-rent
- 9.7×
Monthly cashflow live
- Estimated rent
- $3,234 medium interval (Pro) →
- Mortgage (P&I)
- −$1,967
- Tax from tax record
- −$328 /mo · $3,940/yr
- Insurance
- −$156
- HOA
- −$0
- Vacancy / Maint / Mgmt
- −$679
- Net cashflow
- $104
Break-even live
Sensitivity live
| Price | -10% $316 | -5% $210 | +0% $104 | +5% $-2 | +10% $-109 |
|---|---|---|---|---|---|
| Rent | -10% $-152 | -5% $-24 | +0% $104 | +5% $231 | +10% $359 |
| Rate | -1.0pp $293 | -0.5pp $199 | base $104 | +0.5pp $7 | +1.0pp $-92 |
UW: 25.0% down · 7.5% · 30yr · 1.5% tax · 5.0% vac · 8.0% maint · 8.0% mgmt
Financing live
Cash to close
- Down payment
- $93,750
- Closing costs
- $11,250
- Reserves months
- —
- Total cash needed
- —
Loan-product check · same deal, 3 products live
Conventional
25% down · 7.5% · 30yr
- Down + closing
- —
- Monthly P&I
- —
- Monthly cashflow
- —
- DSCR
- —
- Eligible?
- —
Personal DTI + credit; lowest rate.
DSCR
20% down · 8.5% · 30yr
- Down + closing
- —
- Monthly P&I
- —
- Monthly cashflow
- —
- DSCR
- —
- Eligible?
- —
No personal income docs; deal must DSCR.
Hard money
10% down · 12.0% · 12mo
- Down + closing
- —
- Monthly P&I
- —
- Monthly cashflow
- —
- DSCR
- —
- Eligible?
- —
Short-term bridge; refi at stabilization.
Rent comps 2 comps
| Address | Beds | Baths | Sqft | Rent | $/sqft | DOM | Units | Dist |
|---|---|---|---|---|---|---|---|---|
| 3780 London Rd Duluth, MN | 1.0–3.0 | 1.0–2.0 | 1312 | $3,485 | $2.66 | 15d | 1 | 1.16mi |
| 2120 London Rd Duluth, MN | 2.0 | 1.0–2.0 | 1086 | $4,111 | $3.78 | 15d | 13 | 1.33mi |
Listing history 5 events
-
2026-06-19status $375,000 Pending 3 DOM
-
2026-06-18days on market $375,000 Active 3 DOM
-
2026-06-17days on market $375,000 Active 2 DOM
-
2026-06-15remarks 699-char remark
-
2026-06-15$375,000 Active 1 DOM
ⓘ Source: listings_history table (triggers on properties + properties_extension) + one-shot
backfill from property_details.listing_events for pre-trigger history.
Tax reassessment forecast MN · Partial reset (capped growth)
- Current annual tax
- $3,940 · $328/mo
- Projected year-2 tax
- $4,070 · $339/mo
- Expected delta
- +$130/yr (+$11/mo · 3.3%)
ⓘ Screening estimate from a state-policy table — verify with the county assessor before closing.
Climate risk First Street
- Flood 1/10 Low FEMA zone X · 0% chance over 30 yrs
- Wildfire 1/10 Low
- Heat 1/10 Low 7 d/yr ≥89°F today · 12 d/yr by 30 yrs out
- Wind 1/10 Low
- Air quality 2/10 Low 0 unhealthy d/yr today · 1 by 30 yrs out
Nearby sold comps map
Loading sold comps map…
Walkable amenities ~0.75 mi
Loading nearby amenities…
Taxation est. · year 1
- Rental income
- $38,808
- − Mortgage interest
- −$21,006
- − Property taxes
- −$3,940
- − Insurance
- −$1,875
- − Repairs & maintenance
- −$3,105
- − Management
- −$3,105
- − Depreciation
- −$10,909
- Taxable loss
- −$5,131
- Est. tax savings @ 24.0%
- +$1,232
- After-tax cash flow
- $2,476/yr
For passive investors: Depreciation is non-cash, so a rental often shows a tax loss while cash-flowing — sheltering income. Rental losses are passive: they offset passive income freely, and up to $25,000/yr can offset ordinary (W-2) income if you actively participate and your MAGI is under $100k (phasing out to $0 by $150k); unused losses carry forward. On sale, claimed depreciation is recaptured at up to 25%, and gains may owe capital-gains tax (a 1031 exchange can defer both). Figures are a year-1 estimate at your 24.0% rate — not tax advice; consult a CPA.
Schools (NCES district)
- District
- Duluth Public School District
- NCES district ID
- 2711040
- Math proficiency
- 44% ▼ -10.00%
- Reading proficiency
- 55% ▼ -6.00%
- Median HH income
- $45,692
- Composite
- 41.92/100
- National rank
- #3360
- State rank
- #132 of 301 in MN
Livability — Duluth
- Score
- 82/100
- State rank
- #36
- US rank
- #1060
Category grades
Schools grade is shown separately in the Schools card above.
Census & demographics
- Census place
- Duluth, MN
- County
- Saint Louis County · 115,152 people
- City population
- 71,097
- Metro
- Duluth, MN-WI
- Population (ZIP)
- 17,662
- Household income
- $105,888
- Rent vs Own
- Severe rent burden
- 322.0
Population outlook (St. Louis County) Hauer SSP2
- Today (2025)
- 202,411 people
- By 2030
- 203,234 · +0.4%
- By 2040
- 202,520 · +0.1%
- By 2050
- 200,853 · -0.8%
- By 2075
- 200,943 · -0.7%
- By 2100
- 192,058 · -5.1%
Race, ethnicity, and origin ACS 2023
- Neighborhood character
- Predominantly White (96%)
- Race & ethnicity
- White 96% Two or more races 2%
- Common ancestry
- Portuguese 16% Romanian 7% Lithuanian 3%
- Foreign-born
- 2% · China, Canada
- Languages at home
- 97% English-only · Chinese 1%
Political lean MEDSL · St. Louis
- 2024 margin
- D (+13.7) · D 55.9% · R 42.2% · Other 1.8%
- 2008→2024 swing
- -18.8pp toward R · 2008: 32.5pp · 2024: 13.7pp
- All cycles
- 2024: D+13.7 2020: D+15.6 2016: D+11.8 2012: D+29.6 2008: D+32.5
Not yet ingested
- Civics
- —
Market trends
- HPI YoY
- ▼ -363.34%
- Current HPI
- 197.6712
- Rent YoY
- —
- Metro
- Duluth, MN-WI
- State GDP YoY
- ▲ 2.41%
- F500 in state
- 34
Industry mix (Fortune 500 HQ in MN)
| Industry | F500 HQs | Revenue |
|---|---|---|
| Healthcare | 2 | $407B |
|
||
| Retail | 2 | $150B |
|
||
| Consumer Goods | 2 | $32B |
|
||
| Industrial Machinery | 2 | $6B |
|
||
| Agriculture | 1 | $40B |
|
||
| Healthcare / Medical Devices | 1 | $32B |
|
||
Price history
+184.2% since first listed28 events — show timeline
- 2026-06-15 Listed $375,000 LSAR
- 2020-07-01 Sold (Public Records) $272,000 Public Records
- 2020-06-26 Sold (MLS) $272,000 LSAR
- 2020-05-22 Listed $264,900 LSAR
- 2014-10-20 Sold (Public Records) $171,000 Public Records
- 2014-09-29 Sold (MLS) $171,000 LSAR
- 2014-09-29 Sold (MLS) $171,000 RASM
- 2014-09-29 Sold (MLS) $171,000 NORTHSTARMLS as Distributed by MLS Grid
- 2014-08-29 Pending — NORTHSTARMLS as Distributed by MLS Grid
- 2014-08-22 Contingent — NORTHSTARMLS as Distributed by MLS Grid
- 2014-08-15 Listed $167,900 NORTHSTARMLS as Distributed by MLS Grid
- 2014-08-14 Listed $167,900 LSAR
- 2014-08-14 Listed $167,900 RASM
- 2013-06-12 Sold (Public Records) $155,000 Public Records
- 2013-06-07 Sold (MLS) $155,000 NORTHSTARMLS as Distributed by MLS Grid
- 2013-04-09 Listed $159,900 NORTHSTARMLS as Distributed by MLS Grid
- 2011-03-09 Listed $164,900 NORTHSTARMLS as Distributed by MLS Grid
- 2010-06-03 Listing Removed — NORTHSTARMLS as Distributed by MLS Grid
- 2010-02-12 Listed $184,900 NORTHSTARMLS as Distributed by MLS Grid
- 2010-02-12 Listed $184,900 NORTHSTARMLS as Distributed by MLS Grid
- 2010-02-07 Listing Removed — NORTHSTARMLS as Distributed by MLS Grid
- 2009-05-07 Listed $184,900 NORTHSTARMLS as Distributed by MLS Grid
- 2009-05-07 Listed $184,900 NORTHSTARMLS as Distributed by MLS Grid
- 2007-08-27 Sold (Public Records) $185,000 Public Records
- 2007-08-10 Sold (MLS) $185,000 NORTHSTARMLS as Distributed by MLS Grid
- 2007-07-15 Listing Removed — NORTHSTARMLS as Distributed by MLS Grid
- 2007-07-11 Listed $185,000 NORTHSTARMLS as Distributed by MLS Grid
- 2001-08-28 Sold (Public Records) $131,936 Public Records
Property tax history
+5.4%/yrLatest (2026): $3,940 · +4.5% YoY. Source: county tax records.
Cash-flow waterfall
monthlySold comps — $/sqft
last 12 mo · ≤1 miLoading sold comps…