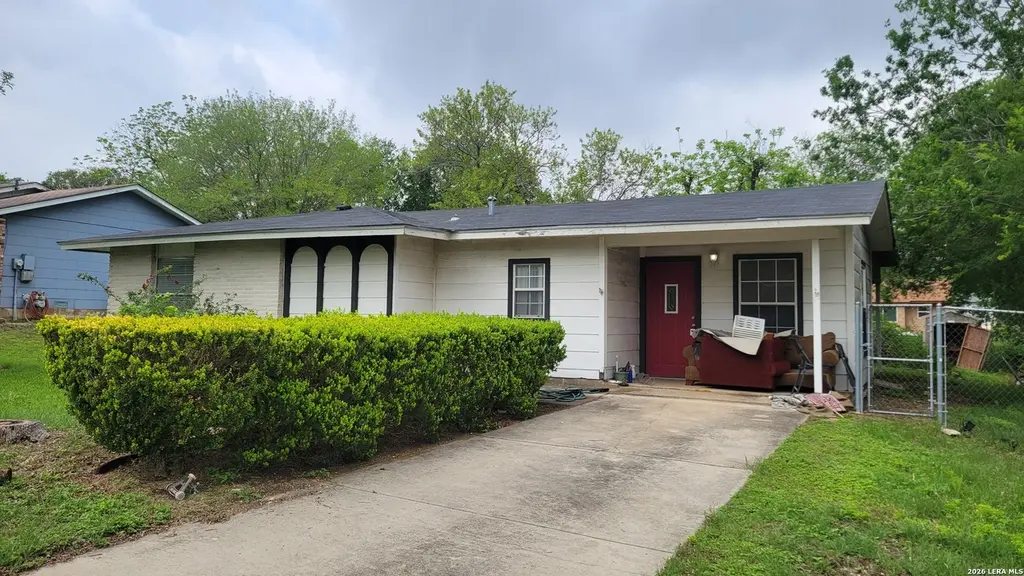
12017 Forest Nook Ct · Live Oak, TX
Flood risk 1/10 · Minimal
- FEMA flood zone
- X (unshaded)
- Chance of flooding over 30 yrs
- 0.0%
- Est. flood insurance / yr
- $507 – $1,088
Fire risk 2/10 · Minimal
- Est. fire insurance / yr
- $1,222 – $2,270
Heat risk 8/10 · Major
- Hot days now (above 108°F)
- 7 days/yr
- Hot days in 30 yrs
- 21 days/yr
Wind risk 8/10 · Major
- Chance of severe wind over 30 yrs
- 80.0%
Air-quality risk 1/10 · Minimal
- Unhealthy air days now
- 0 days/yr
- Unhealthy air days in 30 yrs
- 0 days/yr
Risk factors via First Street. Map © Google.
Why this score? — see what drove the C grade
The composite is a weighted blend of 9 inputs, each scored 0–100. Each bar is that input's sub-score; the figure is the points it added to the 100-point composite (weight × sub-score).
- Cash flow +19.3/30.0
- ARV discount +15.0/15.0
- 1% rule +6.7/10.0
- DSCR +6.1/10.0
- Livability +3.7/5.0
- Rent growth +2.5/5.0
- Condition / age +2.5/5.0
- Schools +2.4/10.0
- Appreciation +0.0/10.0
$139,999
🖨 Deal sheet (PDF) 📄 Offer letter ✓ Due diligence
Listing remarks
This 4-bedroom, 1-bathroom house is a standout opportunity for homeowners looking to build equity or investors seeking a high-potential rental. Tucked away in the highly sought-after Live Oak area, this home sits on a spacious lot and is in need of cosmetics.
Key facts
- 8,407 sq ft lot
- Built 1969
- Listed 40 days
Property features AI
Finance
- HOA & community: Located in Live Oak Village
Exterior
- Utilities: Public water system; Public sewer system
- Home design: Pre-owned property; Approximately 57 years old
- Construction: Slab foundation; Composition roof
- Exterior features: Siding exterior with one side masonry
Interior
- Kitchen: Kitchen about 10 x 10
- Bedrooms: Master bedroom about 10 x 10; Bedroom 2 about 8 x 10; Bedroom 3 about 8 x 10; Bedroom 4 about 8 x 10
- Flooring: Other (see remarks)
- Bathrooms: 1 full bathroom
- Heating & cooling: Central heating; Natural gas heat; Central air conditioning
- Interior features: Ceiling fans; Gas water heater; Some window coverings remain; One living area
- Laundry & utility: Laundry on the main level
Neighborhood map
What this means for you Summary
Snapshot
- This is a 3-bed/2.0-bath single-family listed at $140k.
Deal economics
- At list price, monthly cash flow is $154 ($2k/yr) — positive.
- The deal already cash-flows at list — no discount required.
- Meets the 1% rule at list price ($2k rent vs $140k).
- Recommended offer: $136k (3.0% below list) — sets the bar for market timing.
- Cap rate 7.6% vs local median 3.7% in Live Oak — top-decile yield for the area; either an underpriced asset or a hidden risk that comps aren't pricing in. Stress-test before assuming the spread holds.
Location & tenants
- Location reads 73/100 on livability (#211 in TX) — a middle-class / working-renter tenant base. Strengths: cost of living A+, housing A+; Watch: health & safety D+, amenities F, commute F.
- Judson ISD (suburban): math 21% / reading 33% proficiency, ranked #660 of 826 in TX (top 80%) — low school quality limits family demand, transient renter base, plan for 1-2y turnover.
- Zoned schools: Ed Franz El (math 17% / reading 27%, grade F, #3,333 of 4,322 statewide, top 80%, 386 students, 70% FRL); Kitty Hawk Middle (math 21% / reading 34%, grade F, #1,156 of 1,662 statewide, top 71%, 1,237 students, 60% FRL); Judson H S (math 19% / reading 38%, grade F, #1,157 of 1,632 statewide, top 72%, 2,666 students, 62% FRL).
- Market conditions: Rents soft (-0.1%/yr); 308 active listings in the ZIP; 40 comparable units currently listed for rent nearby; rentals at typical pace (median 20d on market — plan ~3-4 weeks tenant-placement turnaround); solid renter incomes; 8,308 units permitted in Bexar County in 2024 (2,506 in 5+ unit buildings).
Forward outlook
- Local home prices are declining (-3.0%/yr); year-one equity from $968 of loan paydown is wiped out by about $4k of value loss. Plan a longer hold.
- Bexar County population projected at +50% by 2050 — long-run rental-demand tailwind backs the buy-and-hold thesis.
Negotiation context
- It's been on market 41 days — a 3% lower offer ($136k) is reasonable based on typical stale-listing flexibility.
Risks & watch-outs
- Watch-outs: property tax is 3.0% of price.
- Climate carrying-cost: severe wind risk, 80% chance of damaging wind over 30y; extreme-heat days projected 7→21/yr by 2055 (HVAC capex compounding) — expect insurance premiums to compound above CPI over the hold.
Questions for the listing agent
- It's been on market 41 days. Have you received any prior offers? Is the seller open to a 3% concession, seller financing, or rate buy-down credit?
- Built in 1969 — when were the roof, HVAC, electrical panel, plumbing, and water heater last replaced?
- Property tax is high relative to price — has the assessment been appealed recently, and will the sale trigger a re-assessment?
- Is there a deadline driving the sale (1031 exchange, divorce, estate, relocation)? That informs how much negotiation room exists.
- Schools are A-rated — typically a magnet for longer-tenancy family renters. What's the average tenant stay here, and is there a school-zone premium baked into asking?
- What's the average days-on-market for RENTAL listings here right now (not sales)? A rising rental-DOM trend means longer vacancies and softer asking-rent achievability than the comps imply.
- What's the recent tenant-quality profile in this submarket — average credit score on applications, eviction rate, late-payment / NSF rate, and stable-employment percentage? A property-management company in the area should have these aggregated.
- How much new for-sale + rental construction is in the pipeline within 1–3 miles? Heavy new supply typically softens prices + rents 12–24 months out; constrained supply supports both.
Investment metrics
- 1% rule
- 1.17% ✓
- Cap rate
- 7.61%
- Cash-on-cash
- 4.71%
- DSCR
- 1.21
- GRM
- 7.1
CMA / ARV
- ARV (median comp)
- $215,055
- List price
- $139,999
- Delta
- -34.90%
- Verdict
- UNDERPRICED
- Comps
- 20 within 1.0 mi
Show comp detail 12 sales within ~0.75 mi
| Address | Dist | Beds/Ba | Sqft | Sold | Price | $/sf | Match |
|---|---|---|---|---|---|---|---|
| 11914 Welcome | 0.14mi | 4/2.0 (+1) | 1,272 (+0%) | 3mo | $179,000 | $141 | 86 |
| 11817 Splintered Oak | 0.12mi | 3/2.0 | 1,353 (+7%) | 4mo | $199,999 | $148 | 80 |
| 210 Lost Frst | 0.12mi | 3/2.0 | 1,189 (-6%) | 4mo | $175,000 | $147 | 80 |
| 12004 Prairie Oak | 0.09mi | 3/2.0 | 1,358 (+7%) | 5mo | $240,000 | $177 | 80 |
| 7522 Wishing Oaks | 0.39mi | 3/2.0 | 1,288 (+2%) | 3mo | $245,000 | $190 | 77 |
| 7913 Dry Cyn | 0.33mi | 3/2.0 | 1,422 (+12%) | 0mo | $215,000 | $151 | 64 |
| 7622 Gnarled Oak Trl | 0.49mi | 3/2.0 | 1,196 (-6%) | 5mo | $221,500 | $185 | 64 |
| 12401 Trailing Oaks | 0.29mi | 4/2.0 (+1) | 1,144 (-10%) | 4mo | $210,000 | $184 | 62 |
| 117 Lost Frst | 0.35mi | 3/2.0 | 1,426 (+12%) | 4mo | $224,000 | $157 | 60 |
| 331 Shin Oak | 0.66mi | 3/2.0 | 1,338 (+6%) | 1mo | $199,000 | $149 | 59 |
| 7409 Sage Oak | 0.56mi | 4/2.0 (+1) | 1,402 (+11%) | 4mo | $250,000 | $178 | 48 |
| 323 Cherrywood | 0.73mi | 3/2.0 | 1,410 (+11%) | 4mo | $257,900 | $183 | 44 |
Match score weights: distance 35% · size 25% · config 20% · recency 20%. Top-matched comps best support the ARV.
Projected returns pro-forma
-3.0% appreciation · 0.0% rent growth · sell at horizon
- IRR
- -12.9%
- Equity multiple
- 0.55×
- Total profit
- $-17,559
- Equity at exit
- $20,874
- IRR
- -10.3%
- Equity multiple
- 0.47×
- Total profit
- $-20,714
- Equity at exit
- $12,105
Cash invested: $39,200 (down + closing). Projections, not guarantees.
Landlord ↔ Tenant lean methodology
- Overall (STATE)
- 87 Strongly Landlord-Friendly
- State Texas
- 87 Strongly Landlord-Friendly · R+5
- County
- — inherits STATE
- City
- — inherits STATE
ZIP-level market 78233
- Home prices YoY
- -31.0%
- Rents YoY
- -0.1%
- Active inventory
- 308
- Price-to-rent
- 7.1×
Monthly cashflow live
- Estimated rent
- $1,641 high interval (Pro) →
- Mortgage (P&I)
- −$734
- Tax from tax record
- −$350 /mo · $4,199/yr
- Insurance
- −$58
- HOA
- −$0
- Vacancy / Maint / Mgmt
- −$345
- Net cashflow
- $154
Break-even live
Sensitivity live
| Price | -10% $233 | -5% $194 | +0% $154 | +5% $114 | +10% $75 |
|---|---|---|---|---|---|
| Rent | -10% $24 | -5% $89 | +0% $154 | +5% $219 | +10% $284 |
| Rate | -1.0pp $224 | -0.5pp $190 | base $154 | +0.5pp $118 | +1.0pp $81 |
UW: 25.0% down · 7.5% · 30yr · 1.5% tax · 5.0% vac · 8.0% maint · 8.0% mgmt
Financing live
Cash to close
- Down payment
- $35,000
- Closing costs
- $4,200
- Reserves months
- —
- Total cash needed
- —
Loan-product check · same deal, 3 products live
Conventional
25% down · 7.5% · 30yr
- Down + closing
- —
- Monthly P&I
- —
- Monthly cashflow
- —
- DSCR
- —
- Eligible?
- —
Personal DTI + credit; lowest rate.
DSCR
20% down · 8.5% · 30yr
- Down + closing
- —
- Monthly P&I
- —
- Monthly cashflow
- —
- DSCR
- —
- Eligible?
- —
No personal income docs; deal must DSCR.
Hard money
10% down · 12.0% · 12mo
- Down + closing
- —
- Monthly P&I
- —
- Monthly cashflow
- —
- DSCR
- —
- Eligible?
- —
Short-term bridge; refi at stabilization.
Rent comps 40 comps
| Address | Beds | Baths | Sqft | Rent | $/sqft | DOM | Units | Dist |
|---|---|---|---|---|---|---|---|---|
| 12005 Prairie Oak St San Antonio, TX | 3.0 | 2.0 | 1279 | $1,495 | $1.17 | 45d | 1 | 0.10mi |
| 161 Lost Forest St San Antonio, TX | 3.0 | 1.0 | 984 | $1,395 | $1.42 | 6d | 1 | 0.19mi |
| 164 Lost Forest St San Antonio, TX | 3.0 | 2.0 | 1624 | $2,200 | $1.35 | 25d | 1 | 0.19mi |
| 7917 Oak Forest Dr Live Oak, TX | 3.0 | 2.0 | 1133 | $1,645 | $1.45 | 25d | 1 | 0.23mi |
| 11702 Welcome Dr Unit Labs Live Oak, TX | 4.0 | 2.0 | 1107 | $1,695 | $1.53 | 23d | 1 | 0.32mi |
| 7607 Sage Oak St Live Oak, TX | 3.0 | 1.0 | 1013 | $1,200 | $1.18 | 6d | 1 | 0.36mi |
| 12602 Moss Hollow St San Antonio, TX | 4.0 | 2.0 | 1740 | $1,675 | $0.96 | 45d | 1 | 0.40mi |
| 7729 Narrow Pass St Live Oak, TX | 3.0 | 2.0 | 1331 | $2,000 | $1.50 | 25d | 1 | 0.52mi |
| 7810 Lazy Forest St Live Oak, TX | 3.0 | 2.0 | 1140 | $1,695 | $1.49 | 12d | 1 | 0.54mi |
| 406 Greycliff Dr San Antonio, TX | 3.0 | 2.0 | 1600 | $1,800 | $1.12 | 16d | 1 | 0.59mi |
| 11205 Champion Oak Live Oak, TX | 3.0 | 2.0 | 1316 | $1,650 | $1.25 | 4d | 1 | 0.59mi |
| 7236 Rimwood St San Antonio, TX | 3.0 | 2.0 | 1250 | $1,395 | $1.12 | 45d | 1 | 0.65mi |
| 12810 Weeping Oak Trl Live Oak, TX | 3.0 | 2.0 | 1322 | $1,475 | $1.12 | 45d | 1 | 0.67mi |
| 8130 Shin Oak Dr Live Oak, TX | 1.0–3.0 | 1.0–2.0 | 1000 | $2,115 | $2.12 | 0d | 18 | 0.68mi |
| 7222 Rimwood St Live Oak, TX | 3.0 | 2.0 | 1250 | $1,350 | $1.08 | 45d | 1 | 0.69mi |
| 7220 Rimwood Live Oak, TX | 3.0 | 2.0 | 1239 | $1,450 | $1.17 | 25d | 1 | 0.70mi |
| 7329 Leading Oaks St Live Oak, TX | 3.0 | 2.0 | 1236 | $1,750 | $1.42 | 25d | 1 | 0.70mi |
| 7214 Rimwood Live Oak, TX | 3.0 | 2.0 | 1239 | $1,500 | $1.21 | 25d | 1 | 0.71mi |
| 7208 Savannah Brks Live Oak, TX | 3.0 | 2.5 | 1344 | $1,450 | $1.08 | 21d | 1 | 0.74mi |
| 7216 Savannah Brks Live Oak, TX | 3.0 | 2.5 | 1344 | $1,450 | $1.08 | 14d | 1 | 0.74mi |
| 7220 Savannah Brks Live Oak, TX | 3.0 | 2.5 | 1344 | $1,475 | $1.10 | 25d | 1 | 0.74mi |
| 7503 Savannah Brks Unit 7503 Live Oak, TX | 3.0 | 2.5 | 1300 | $1,600 | $1.23 | 16d | 1 | 0.75mi |
| 8101 Shin Oak Dr Unit 3294 Live Oak, TX | 3.0 | 2.0 | 1420 | $1,848 | $1.30 | 0d | 1 | 0.76mi |
| 8101 Shin Oak Dr Unit 710 Live Oak, TX | 2.0 | 2.0 | 1110 | $1,400 | $1.26 | 0d | 1 | 0.76mi |
| 7708 Brunning Ct Live Oak, TX | 3.0 | 2.0 | 1717 | $2,000 | $1.16 | 14d | 1 | 0.77mi |
| 11025 White Sands Live Oak, TX | 3.0 | 2.0 | 1316 | $1,650 | $1.25 | 6d | 1 | 0.78mi |
| 7822 Savannah Brks Live Oak, TX | 3.0 | 2.5 | 1344 | $1,375 | $1.02 | 4d | 1 | 0.79mi |
| 13316 Reid Mdws Live Oak, TX | 3.0 | 2.5 | 1340 | $1,395 | $1.04 | 45d | 1 | 0.83mi |
| 7828 Pat Booker Rd Live Oak, TX | 1.0–3.0 | 1.0–2.0 | 1000 | $1,873 | $1.87 | 0d | 52 | 0.86mi |
| 12900 E Loop 1604 N Universal City, TX | 1.0–3.0 | 1.0–2.0 | 903 | $1,765 | $1.95 | 5d | 12 | 0.88mi |
| 615 Amistad Blvd Unit NA Universal City, TX | 3.0 | 2.0 | 1679 | $2,200 | $1.31 | 19d | 1 | 0.91mi |
| 165 Palisades Dr Universal City, TX | 1.0–2.0 | 1.0–2.0 | 711 | $1,110 | $1.56 | 0d | 26 | 0.94mi |
| 7855 Kitty Hawk Rd Unit 710 Converse, TX | 2.0 | 2.0 | 948 | $1,169 | $1.23 | 0d | 1 | 0.97mi |
| 162 Amistad Blvd Universal City, TX | 3.0 | 2.0 | 1668 | $1,525 | $0.91 | 25d | 1 | 0.99mi |
| 7855 Kitty Hawk Rd Converse, TX | 1.0–2.0 | 1.0–2.0 | 875 | $1,425 | $1.63 | 22d | 17 | 0.99mi |
| 10743 Mustang Rdg Converse, TX | 4.0 | 2.0 | 1858 | $2,010 | $1.08 | 6d | 1 | 1.03mi |
| 13003 Toepperwein Rd San Antonio, TX | 3.0–4.0 | 2.0 | 1643 | $2,448 | $1.49 | 5d | 18 | 1.10mi |
| 2910 Pat Booker Rd Universal City, TX | 3.0 | 2.0 | 1088 | $1,389 | $1.28 | 45d | 1 | 1.16mi |
| 8243 Lone Shadow Trl Converse, TX | 4.0 | 2.0 | 1442 | $1,674 | $1.16 | 22d | 1 | 1.17mi |
| 10319 Outlaw Bnd Converse, TX | 3.0 | 2.0 | 1396 | $1,700 | $1.22 | 19d | 1 | 1.17mi |
Listing history 16 events
-
2026-06-18days on market $139,999 Active 41 DOM
-
2026-06-17days on market $139,999 Active 40 DOM
-
2026-06-16days on market $139,999 Active 39 DOM
-
2026-06-15days on market $139,999 Active 38 DOM
-
2026-06-13days on market $139,999 Active 36 DOM
-
2026-06-09days on market $139,999 Active 32 DOM
-
2026-06-08days on market $139,999 Active 31 DOM
-
2026-06-07days on market $139,999 Active 30 DOM
-
2026-06-04days on market $139,999 Active 27 DOM
-
2026-06-03days on market $139,999 Active 26 DOM
-
2026-06-02days on market $139,999 Active 25 DOM
-
2026-06-01days on market $139,999 Active 24 DOM
-
2026-05-31days on market $139,999 Active 23 DOM
-
2026-05-08$139,999 New 259-char remark
-
2026-03-16soldstatus
-
1986-06-01soldstatus
ⓘ Source: listings_history table (triggers on properties + properties_extension) + one-shot
backfill from property_details.listing_events for pre-trigger history.
Tax reassessment forecast TX · Resets to sale price
- Current annual tax
- $4,199 · $350/mo
- Projected year-2 tax
- $4,199 · $350/mo
- Expected delta
- $0/yr ($0/mo · 0.0%)
ⓘ Screening estimate from a state-policy table — verify with the county assessor before closing.
Climate risk First Street
- Flood 1/10 Low FEMA zone X (unshaded) · 0% chance over 30 yrs
- Wildfire 2/10 Low
- Heat 8/10 Severe 7 d/yr ≥108°F today · 21 d/yr by 30 yrs out
- Wind 8/10 Severe 80% chance of damaging wind over 30 yrs
- Air quality 1/10 Low 0 unhealthy d/yr today · 0 by 30 yrs out
Nearby sold comps map
Loading sold comps map…
Walkable amenities ~0.75 mi
Loading nearby amenities…
Taxation est. · year 1
- Rental income
- $19,691
- − Mortgage interest
- −$7,842
- − Property taxes
- −$4,199
- − Insurance
- −$700
- − Repairs & maintenance
- −$1,575
- − Management
- −$1,575
- − Depreciation
- −$4,073
- Taxable loss
- −$273
- Est. tax savings @ 24.0%
- +$66
- After-tax cash flow
- $1,913/yr
For passive investors: Depreciation is non-cash, so a rental often shows a tax loss while cash-flowing — sheltering income. Rental losses are passive: they offset passive income freely, and up to $25,000/yr can offset ordinary (W-2) income if you actively participate and your MAGI is under $100k (phasing out to $0 by $150k); unused losses carry forward. On sale, claimed depreciation is recaptured at up to 25%, and gains may owe capital-gains tax (a 1031 exchange can defer both). Figures are a year-1 estimate at your 24.0% rate — not tax advice; consult a CPA.
Schools (NCES district)
- District
- Judson ISD
- NCES district ID
- 4824990
- Math proficiency
- 21% ▼ -21.00%
- Reading proficiency
- 33% ▼ -7.00%
- Median HH income
- $57,542
- Composite
- 24.39/100
- National rank
- #7689
- State rank
- #660 of 826 in TX
Livability — Live Oak
- Score
- 73/100
- State rank
- #211
- US rank
- #5260
Category grades
Schools grade is shown separately in the Schools card above.
Census & demographics
- Census place
- Live Oak, TX
- County
- Bexar County · 1,990,555 people
- Metro
- San Antonio-New Braunfels, TX
- Population (ZIP)
- 48,911
- Household income
- $76,421
- Rent vs Own
- Severe rent burden
- 1635.0
Population outlook (Bexar County) Hauer SSP2
- Today (2025)
- 2,336,851 people
- By 2030
- 2,560,728 · +9.6%
- By 2040
- 3,020,569 · +29.3%
- By 2050
- 3,493,522 · +49.5%
- By 2075
- 4,668,459 · +99.8%
- By 2100
- 5,533,242 · +136.8%
Race, ethnicity, and origin ACS 2023
- Neighborhood character
- Diverse neighborhood (Simpson 0.62)
- Race & ethnicity
- Hispanic / Latino 52% White 31% Two or more races 23% Black 11% Asian 3% Native American 1%
- Hispanic origin (detail)
- Mexican 42% Puerto Rican 3%
- Common ancestry
- Romanian 1% Lithuanian 1% Italian 1%
- Foreign-born
- 12% · Canada, South Korea, Vietnam
- Languages at home
- 69% English-only · Spanish 27% Korean 1% Other Asian/Pacific 1%
Political lean MEDSL · Bexar
- 2024 margin
- Lean D (+9.8) · D 54.3% · R 44.6% · Other 1.1%
- 2008→2024 swing
- +4.2pp toward D · 2008: 5.6pp · 2024: 9.8pp
- All cycles
- 2024: D+9.8 2020: D+18.2 2016: D+13.5 2012: D+4.6 2008: D+5.6
Not yet ingested
- Civics
- —
Market trends
- HPI YoY
- ▼ -123.27%
- Current HPI
- 274.943
- Rent YoY
- ▼ -0.06%
- Metro
- San Antonio-New Braunfels, TX
- State GDP YoY
- ▲ 3.95%
- F500 in state
- 110
Industry mix (Fortune 500 HQ in TX)
| Industry | F500 HQs | Revenue |
|---|---|---|
| Energy | 16 | $1,198B |
|
||
| Technology | 5 | $198B |
|
||
| Engineering / Construction | 4 | $72B |
|
||
| Energy Services | 3 | $60B |
|
||
| Utilities | 3 | $41B |
|
||
| Healthcare | 2 | $330B |
|
||
Price history
3 events — show timeline
- 2026-05-08 Listed $139,999 LERA
- 2026-03-16 Sold (Public Records) — Public Records
- 1986-06-01 Sold (Public Records) — Public Records
Property tax history
+11.8%/yrLatest (2025): $4,199 · -3.7% YoY. Source: county tax records.
Cash-flow waterfall
monthlySold comps — $/sqft
last 12 mo · ≤1 miLoading sold comps…