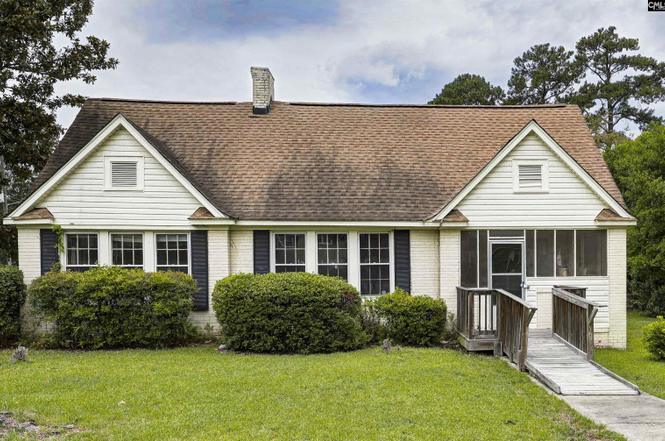
1125 Hancock St · Columbia, SC
Flood risk 1/10 · Minimal
- FEMA flood zone
- X (unshaded)
- Chance of flooding over 30 yrs
- 0.0%
- Est. flood insurance / yr
- $507 – $1,088
Fire risk 3/10 · Minor
- Est. fire insurance / yr
- $783 – $1,453
Heat risk 7/10 · Major
- Hot days now (above 109°F)
- 7 days/yr
- Hot days in 30 yrs
- 16 days/yr
Wind risk 6/10 · Moderate
- Chance of severe wind over 30 yrs
- 68.0%
Air-quality risk 3/10 · Minor
- Unhealthy air days now
- 2 days/yr
- Unhealthy air days in 30 yrs
- 2 days/yr
Risk factors via First Street. Map © Google.
Why this score? — see what drove the C+ grade
The composite is a weighted blend of 9 inputs, each scored 0–100. Each bar is that input's sub-score; the figure is the points it added to the 100-point composite (weight × sub-score).
- Cash flow +22.6/30.0
- ARV discount +15.0/15.0
- DSCR +7.2/10.0
- 1% rule +4.8/10.0
- Rent growth +4.2/5.0
- Livability +3.9/5.0
- Schools +2.6/10.0
- Condition / age +2.5/5.0
- Appreciation +0.0/10.0
$215,000
🖨 Deal sheet (PDF) 📄 Offer letter ✓ Due diligence
Listing remarks
With a little TLC this can be your forever home or a great investment property. This 4 BR 2 BA all brick home sits on a huge corner lot. It features a formal living and dining room, an office or flex room, a den/ great room, 2 BR downstairs and 2 BR upstairs. Lots of potential for storage upstairs and in the basement. YES, there's an unfinished basement. Outside there's a storage shed/ workshop attached to the house, a huge deck and . 38 ac corner lot fenced in yard. The home has fresh paint, new ceiling fans, new cooktop waiting to be installed. All it needs is a little more TLC to be a really nice home. This home is perfect for someone looking to be downtown, house several students or the
Key facts
- Unfinished basement
- Storage shed
- Huge deck
Tags
Property features AI
Finance
- Other: Cable TV available
Exterior
- Parking: Attached carport; Four parking spaces
- Utilities: Public water; Septic sewer
- Home design: 1.5-story home; Brick exterior above foundation
- Construction: Crawlspace and slab foundation
- Exterior features: Covered front porch; Deck; Rear chain-link fencing
Interior
- Kitchen: Formica countertops; Stained wood cabinets; Vinyl flooring; Counter cooktop (gas)
- Bedrooms: Main-level primary bedroom with shared bath, ceiling fan and private closet; Main-level second bedroom with shared bath, ceiling fan and private closet; Second-level third bedroom with shared bath, ceiling fan and private closet; Second-level fourth bedroom with shared bath, ceiling fan and private closet
- Flooring: Hardwood floors in formal living and dining areas; Laminate flooring in great room; Other flooring in formal dining area; Vinyl flooring in kitchen
- Bathrooms: Two full bathrooms
- Heating & cooling: Central heating; Central cooling
- Interior features: Ceiling fans throughout; Smoke detector; Attic access; Basement (unfinished lower level); Two wood-burning fireplaces
- Laundry & utility: Washer and dryer on main level; Laundry in heated space; Electric water heater
Neighborhood map
What this means for you Summary
Snapshot
- This is a 3-bed/1.0-bath single-family listed at $215k.
Deal economics
- At list price, monthly cash flow is $364 ($4k/yr) — positive.
- The deal already cash-flows at list — no discount required.
- To meet the 1% rule (rent ≥ 1% of price), the offer needs to be $210k (2.4% below list).
- Recommended offer: $210k (2.4% below list) — sets the bar for 1% rule.
- Cap rate 8.3% vs local median 5.0% in Columbia — top-decile yield for the area; either an underpriced asset or a hidden risk that comps aren't pricing in. Stress-test before assuming the spread holds.
Location & tenants
- Location reads 78/100 on livability (#18 in SC, #2,436 nationally) — a middle-class / working-renter tenant base. Strengths: amenities A+, commute A+, cost of living A+; Watch: employment D, crime F.
- Richland 01 (urban): math 26% / reading 36% proficiency, ranked #54 of 80 in SC (top 68%) — families likely to look elsewhere, expect single-tenant / working-renter base with shorter leases; 64% free/reduced lunch — lower-income household profile, screen leases tightly.
- Zoned schools: South Kilbourne Elementary (math 12% / reading 17%, grade F, #553 of 597 statewide, top 95%, 296 students, 100% FRL); Dreher High (math 47% / reading 92%, grade B, #60 of 196 statewide, top 32%, 1,150 students, 100% FRL) — zoned schools average 100% FRL vs 64% district-wide (36 pts higher); higher-poverty schools than district average — tighter screening recommended.
- Market conditions: Rents rising fast (+7.0%/yr); 150 active listings in the ZIP; 18 comparable units currently listed for rent nearby; rentals at typical pace (median 25d on market — plan ~3-4 weeks tenant-placement turnaround); 3,472 units permitted in Richland County in 2024 (1,096 in 5+ unit buildings).
- This rent runs 39% of the median local income ($64k/yr) — at the standard rent-burdened threshold; future hikes will face affordability resistance.
Forward outlook
- Local home prices are declining (-3.0%/yr); year-one equity from $1k of loan paydown is wiped out by about $6k of value loss. Plan a longer hold.
- Richland County population projected at +30% by 2050 — long-run rental-demand tailwind backs the buy-and-hold thesis.
- At projected returns (-3.0% appreciation + 7.0% rent growth), your $60k cash investment doubles in ~9 years — after that, you're playing with house money.
Negotiation context
- Only 4 days on market — expect competitive offers; lowballing is unlikely to land.
Risks & watch-outs
- Watch-outs: built in 1951 — expect roof / HVAC / electrical / plumbing capex.
- Climate carrying-cost: major wind risk, 68% chance of damaging wind over 30y; extreme-heat days projected 7→16/yr by 2055 (HVAC capex compounding) — expect insurance premiums to compound above CPI over the hold.
Questions for the listing agent
- Built in 1951 — when were the roof, HVAC, electrical panel, plumbing, and water heater last replaced?
- Is there a deadline driving the sale (1031 exchange, divorce, estate, relocation)? That informs how much negotiation room exists.
- Schools are D-rated, which usually means shorter tenancies and higher turnover. Who's the typical renter profile here, and what's been the actual vacancy rate?
- Crime grade is F in this area — have there been break-ins, vandalism, or insurance claims at this property in the last 3 years? What carrier currently insures it and at what premium?
- What's the average days-on-market for RENTAL listings here right now (not sales)? A rising rental-DOM trend means longer vacancies and softer asking-rent achievability than the comps imply.
- What's the recent tenant-quality profile in this submarket — average credit score on applications, eviction rate, late-payment / NSF rate, and stable-employment percentage? A property-management company in the area should have these aggregated.
- How much new for-sale + rental construction is in the pipeline within 1–3 miles? Heavy new supply typically softens prices + rents 12–24 months out; constrained supply supports both.
Investment metrics
- 1% rule
- 0.98% ✗
- Cap rate
- 8.32%
- Cash-on-cash
- 7.26%
- DSCR
- 1.32
- GRM
- 8.5
CMA / ARV
- ARV (on-the-fly)
- $283,544
- Comps found
- 1
Show comp detail 1 sale within ~0.75 mi
| Address | Dist | Beds/Ba | Sqft | Sold | Price | $/sf | Match |
|---|---|---|---|---|---|---|---|
| 1012 Suber St | 0.16mi | 3/2.0 | 1,389 (-10%) | 18mo | $255,000 | $184 | 57 |
Match score weights: distance 35% · size 25% · config 20% · recency 20%. Top-matched comps best support the ARV.
Projected returns pro-forma
-3.0% appreciation · 6.95% rent growth · sell at horizon
- IRR
- -1.3%
- Equity multiple
- 0.95×
- Total profit
- $-3,074
- Equity at exit
- $32,057
- IRR
- 11.9%
- Equity multiple
- 2.09×
- Total profit
- $65,412
- Equity at exit
- $18,589
Cash invested: $60,200 (down + closing). Projections, not guarantees.
Landlord ↔ Tenant lean methodology
- Overall (STATE)
- 90 Strongly Landlord-Friendly
- State South Carolina
- 90 Strongly Landlord-Friendly · R+6
- County
- — inherits STATE
- City
- — inherits STATE
ZIP-level market 29205
- Rents YoY
- 7.0%
- Active inventory
- 150
- Price-to-rent
- 8.5×
Monthly cashflow live
- Estimated rent
- $2,098 high interval (Pro) →
- Mortgage (P&I)
- −$1,127
- Tax from tax record
- −$76 /mo · $913/yr
- Insurance
- −$90
- HOA
- −$0
- Vacancy / Maint / Mgmt
- −$441
- Net cashflow
- $364
Break-even live
Sensitivity live
| Price | -10% $486 | -5% $425 | +0% $364 | +5% $303 | +10% $242 |
|---|---|---|---|---|---|
| Rent | -10% $198 | -5% $281 | +0% $364 | +5% $447 | +10% $530 |
| Rate | -1.0pp $472 | -0.5pp $419 | base $364 | +0.5pp $308 | +1.0pp $252 |
UW: 25.0% down · 7.5% · 30yr · 1.5% tax · 5.0% vac · 8.0% maint · 8.0% mgmt
Financing live
Cash to close
- Down payment
- $53,750
- Closing costs
- $6,450
- Reserves months
- —
- Total cash needed
- —
Loan-product check · same deal, 3 products live
Conventional
25% down · 7.5% · 30yr
- Down + closing
- —
- Monthly P&I
- —
- Monthly cashflow
- —
- DSCR
- —
- Eligible?
- —
Personal DTI + credit; lowest rate.
DSCR
20% down · 8.5% · 30yr
- Down + closing
- —
- Monthly P&I
- —
- Monthly cashflow
- —
- DSCR
- —
- Eligible?
- —
No personal income docs; deal must DSCR.
Hard money
10% down · 12.0% · 12mo
- Down + closing
- —
- Monthly P&I
- —
- Monthly cashflow
- —
- DSCR
- —
- Eligible?
- —
Short-term bridge; refi at stabilization.
Rent comps 18 comps
| Address | Beds | Baths | Sqft | Rent | $/sqft | DOM | Units | Dist |
|---|---|---|---|---|---|---|---|---|
| 914 Chevis St Columbia, SC | 3.0 | 2.0 | 1280 | $2,100 | $1.64 | 24d | 1 | 0.27mi |
| 828 Suber St Unit E Columbia, SC | 2.0 | 1.0 | 1100 | $995 | $0.90 | 12d | 1 | 0.31mi |
| 3425 Manor Ave Columbia, SC | 3.0 | 2.0 | 1200 | $2,100 | $1.75 | 12d | 1 | 0.48mi |
| 3800 Overbrook Dr Columbia, SC | 4.0 | 2.0 | 1800 | $2,400 | $1.33 | 24d | 1 | 0.50mi |
| 524 S Beltline Blvd Columbia, SC | 2.0 | 1.0 | 1050 | $1,300 | $1.24 | 24d | 1 | 0.66mi |
| 3925 Rosewood Dr Columbia, SC | 4.0 | 2.0 | 1683 | $4,800 | $2.85 | 24d | 1 | 0.85mi |
| 501 Pelham Dr Columbia, SC | 1.0–2.0 | 1.0–2.0 | 805 | $1,625 | $2.02 | 3d | 24 | 0.95mi |
| 317 Beltline Blvd Unit 1 Columbia, SC | 3.0 | 1.0 | 1150 | $1,200 | $1.04 | 24d | 1 | 0.99mi |
| 102 Burdock Cir Columbia, SC | 4.0 | 2.0 | 1451 | $1,550 | $1.07 | 22d | 1 | 1.07mi |
| 19 Graymont Cir Unit NA Columbia, SC | 3.0 | 2.0 | 1250 | $2,400 | $1.92 | 24d | 1 | 1.07mi |
| 1 Graymont Cir Columbia, SC | 3.0 | 2.5 | 1400 | $2,175 | $1.55 | 24d | 1 | 1.07mi |
| 3125 Heyward St Unit A Columbia, SC | 3.0 | 1.0 | 1200 | $2,400 | $2.00 | 24d | 1 | 1.11mi |
| 3125 Heyward St Unit B Columbia, SC | 2.0 | 1.0 | 1100 | $1,600 | $1.45 | 24d | 1 | 1.11mi |
| 2218 Holt Dr Columbia, SC | 4.0 | 3.5 | 1400 | $2,400 | $1.71 | 24d | 1 | 1.12mi |
| 114 Easy St Columbia, SC | 2.0 | 2.0 | 1100 | $1,500 | $1.36 | 12d | 1 | 1.12mi |
| 318 S Woodrow St Columbia, SC | 2.0 | 1.0 | 1103 | $1,700 | $1.54 | 24d | 1 | 1.29mi |
| 316 S Woodrow St Columbia, SC | 4.0 | 2.0 | 2206 | $4,000 | $1.81 | 24d | 1 | 1.29mi |
| 405 S Edisto Ave Columbia, SC | 3.0 | 1.0 | 1450 | $2,200 | $1.52 | 24d | 1 | 1.44mi |
Listing history 3 events
-
2026-06-21days on market $215,000 Active 4 DOM
-
2026-06-17remarks 699-char remark
-
2026-06-17$215,000 Active 1 DOM
ⓘ Source: listings_history table (triggers on properties + properties_extension) + one-shot
backfill from property_details.listing_events for pre-trigger history.
Tax reassessment forecast SC · Resets to sale price
- Current annual tax
- $913 · $76/mo
- Projected year-2 tax
- $1,226 · $102/mo
- Expected delta
- +$312/yr (+$26/mo · 34.2%)
ⓘ Screening estimate from a state-policy table — verify with the county assessor before closing.
Climate risk First Street
- Flood 1/10 Low FEMA zone X (unshaded) · 0% chance over 30 yrs
- Wildfire 3/10 Moderate
- Heat 7/10 Severe 7 d/yr ≥109°F today · 16 d/yr by 30 yrs out
- Wind 6/10 Major 68% chance of damaging wind over 30 yrs
- Air quality 3/10 Moderate 2 unhealthy d/yr today · 2 by 30 yrs out
Nearby sold comps map
Loading sold comps map…
Walkable amenities ~0.75 mi
Loading nearby amenities…
Taxation est. · year 1
- Rental income
- $25,172
- − Mortgage interest
- −$12,043
- − Property taxes
- −$913
- − Insurance
- −$1,075
- − Repairs & maintenance
- −$2,014
- − Management
- −$2,014
- − Depreciation
- −$6,255
- Taxable income
- $859
- Est. tax owed @ 24.0%
- −$206
- After-tax cash flow
- $4,162/yr
For passive investors: Depreciation is non-cash, so a rental often shows a tax loss while cash-flowing — sheltering income. Rental losses are passive: they offset passive income freely, and up to $25,000/yr can offset ordinary (W-2) income if you actively participate and your MAGI is under $100k (phasing out to $0 by $150k); unused losses carry forward. On sale, claimed depreciation is recaptured at up to 25%, and gains may owe capital-gains tax (a 1031 exchange can defer both). Figures are a year-1 estimate at your 24.0% rate — not tax advice; consult a CPA.
Schools (NCES district)
- District
- Richland 01
- NCES district ID
- 4503360
- Math proficiency
- 26% ▼ -7.00%
- Reading proficiency
- 36% ▼ -5.00%
- Median HH income
- $38,931
- Composite
- 25.94/100
- National rank
- #7335
- State rank
- #54 of 80 in SC
Livability — Columbia
- Score
- 78/100
- State rank
- #18
- US rank
- #2436
Category grades
Schools grade is shown separately in the Schools card above.
Census & demographics
- Census place
- Columbia, SC
- County
- Richland County · 389,530 people
- City population
- 335,994
- Metro
- Columbia, SC
- Population (ZIP)
- 22,223
- Household income
- $64,231
- Rent vs Own
- Severe rent burden
- 1372.0
Population outlook (Richland County) Hauer SSP2
- Today (2025)
- 459,667 people
- By 2030
- 487,524 · +6.1%
- By 2040
- 542,035 · +17.9%
- By 2050
- 595,371 · +29.5%
- By 2075
- 732,998 · +59.5%
- By 2100
- 820,415 · +78.5%
Race, ethnicity, and origin ACS 2023
- Neighborhood character
- Predominantly White (73%)
- Race & ethnicity
- White 73% Black 16% Two or more races 6% Hispanic / Latino 5% Asian 3%
- Common ancestry
- Serbian 6% Slovak 4% Lithuanian 3%
- Foreign-born
- 4% · Canada, China
- Languages at home
- 93% English-only · Spanish 3% German/W. Germanic 1% Chinese 1%
Political lean MEDSL · Richland
- 2024 margin
- Solid D (+34.6) · D 66.4% · R 31.8% · Other 1.8%
- 2008→2024 swing
- +5.7pp toward D · 2008: 28.9pp · 2024: 34.6pp
- All cycles
- 2024: D+34.6 2020: D+38.3 2016: D+32.9 2012: D+33.3 2008: D+28.9
Not yet ingested
- Civics
- —
Market trends
- HPI YoY
- ▼ -457.47%
- Current HPI
- 230.5538
- Rent YoY
- ▲ 6.95%
- Metro
- Columbia, SC
- State GDP YoY
- ▲ 4.51%
- F500 in state
- 2
Industry mix (Fortune 500 HQ in SC)
| Industry | F500 HQs | Revenue |
|---|---|---|
| Packaging | 1 | $7B |
|
||
Price history
1 event — show timeline
- 2026-06-17 Listed $215,000 Consolidated MLS
Property tax history
-1.1%/yrLatest (2025): $913 · +14.8% YoY. Source: county tax records.
Cash-flow waterfall
monthlySold comps — $/sqft
last 12 mo · ≤1 miLoading sold comps…