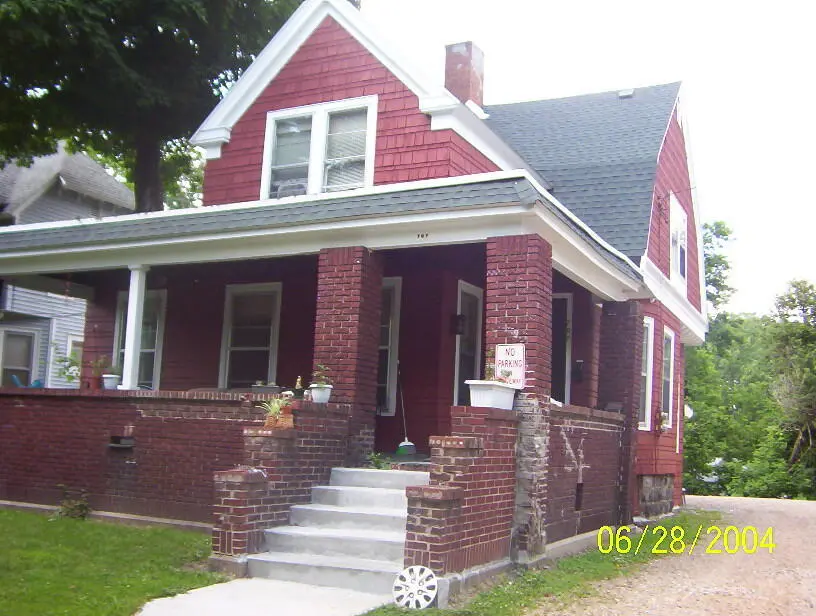
707 E Stockbridge Ave · Kalamazoo, MI
Flood risk 1/10 · Minimal
- FEMA flood zone
- X (unshaded)
- Chance of flooding over 30 yrs
- 0.0%
- Est. flood insurance / yr
- $507 – $1,088
Fire risk 1/10 · Minimal
- Est. fire insurance / yr
- $784 – $1,456
Heat risk 3/10 · Minor
- Hot days now (above 100°F)
- 7 days/yr
- Hot days in 30 yrs
- 16 days/yr
Wind risk 2/10 · Minimal
- Chance of severe wind over 30 yrs
- —
Air-quality risk 2/10 · Minimal
- Unhealthy air days now
- 1 days/yr
- Unhealthy air days in 30 yrs
- 2 days/yr
Risk factors via First Street. Map © Google.
Why this score? — see what drove the A- grade
The composite is a weighted blend of 9 inputs, each scored 0–100. Each bar is that input's sub-score; the figure is the points it added to the 100-point composite (weight × sub-score).
- Cash flow +30.0/30.0
- ARV discount +15.0/15.0
- 1% rule +10.0/10.0
- DSCR +10.0/10.0
- Schools +4.7/10.0
- Rent growth +4.1/5.0
- Livability +3.8/5.0
- Condition / age +2.5/5.0
- Appreciation +0.0/10.0
$110,000
🖨 Deal sheet (PDF) 📄 Offer letter ✓ Due diligence
Key facts
- 7,405 sq ft lot
- 3 parking spots
- Built 1906
Neighborhood map
What this means for you Summary
Snapshot
- This is a 4-bed/2.0-bath single-family listed at $110k.
Deal economics
- At list price, monthly cash flow is $607 ($7k/yr) — positive.
- The deal already cash-flows at list — no discount required.
- Meets the 1% rule at list price ($2k rent vs $110k).
- Cap rate 12.9% vs local median 4.2% in Kalamazoo — top-decile yield for the area; either an underpriced asset or a hidden risk that comps aren't pricing in. Stress-test before assuming the spread holds.
Location & tenants
- Location reads 76/100 on livability (#141 in MI, #3,492 nationally) — a middle-class / working-renter tenant base. Strengths: commute A+, cost of living A+, housing A+; Watch: crime F, employment D-.
- Kalamazoo Public Schools (urban): math 43% / reading 72% proficiency, ranked #71 of 540 in MI (top 13%) — acceptable for families but not a draw, mixed tenant base, ~2y average lease; 66% free/reduced lunch — lower-income household profile, screen leases tightly.
- Zoned schools: El Sol Elementary (351 students, 71% FRL); Maple Street Magnet School For The Arts (math 75% / reading 75%, grade A, #8 of 493 statewide, top 3%, 860 students, 59% FRL); Loy Norrix High School (math 47% / reading 82%, grade B-, #46 of 713 statewide, top 7%, 1,771 students, 68% FRL) — zoned schools at 66% FRL track the district average.
- Zoned-school proficiency averages 70% at this address vs 58% district-wide (+12 pts) — the actual schools serving this property are materially stronger than the Kalamazoo Public Schools average implies; a family-tenant draw the district grade alone would hide.
- Market conditions: Rents rising fast (+6.4%/yr); 109 active listings in the ZIP; 1 comparable units currently listed for rent nearby; 339 units permitted in Kalamazoo County in 2024 (22 in 5+ unit buildings).
- This rent runs 37% of the median local income ($56k/yr) — at the standard rent-burdened threshold; future hikes will face affordability resistance.
Forward outlook
- Local home prices are declining (-3.0%/yr); year-one equity from $761 of loan paydown is wiped out by about $3k of value loss. Plan a longer hold.
- Kalamazoo County population projected at +18% by 2050 — long-run rental-demand tailwind backs the buy-and-hold thesis.
- At projected returns (-3.0% appreciation + 6.4% rent growth), your $31k cash investment doubles in ~5 years — after that, you're playing with house money.
Negotiation context
- Only 0 days on market — expect competitive offers; lowballing is unlikely to land.
- 6 sale attempts since 19y ago with the ask held roughly flat each time — persistent listings suggest the price (not the market) is what's stuck; bring a comps-based counter.
Risks & watch-outs
- Watch-outs: built in 1906 — expect roof / HVAC / electrical / plumbing capex.
Questions for the listing agent
- Built in 1906 — when were the roof, HVAC, electrical panel, plumbing, and water heater last replaced?
- Is there a deadline driving the sale (1031 exchange, divorce, estate, relocation)? That informs how much negotiation room exists.
- Crime grade is F in this area — have there been break-ins, vandalism, or insurance claims at this property in the last 3 years? What carrier currently insures it and at what premium?
- What's the average days-on-market for RENTAL listings here right now (not sales)? A rising rental-DOM trend means longer vacancies and softer asking-rent achievability than the comps imply.
- What's the recent tenant-quality profile in this submarket — average credit score on applications, eviction rate, late-payment / NSF rate, and stable-employment percentage? A property-management company in the area should have these aggregated.
- How much new for-sale + rental construction is in the pipeline within 1–3 miles? Heavy new supply typically softens prices + rents 12–24 months out; constrained supply supports both.
Investment metrics
- 1% rule
- 1.60% ✓
- Cap rate
- 12.92%
- Cash-on-cash
- 23.67%
- DSCR
- 2.05
- GRM
- 5.2
CMA / ARV
- ARV (on-the-fly)
- $137,972
- Comps found
- 11
Show comp detail 11 sales within ~0.75 mi
| Address | Dist | Beds/Ba | Sqft | Sold | Price | $/sf | Match |
|---|---|---|---|---|---|---|---|
| 1518 Fair St | 0.13mi | 4/1.5 | 1,922 (-5%) | 12mo | $200,000 | $104 | 74 |
| 1002 Egleston Ave | 0.26mi | 3/2.0 (-1) | 1,978 (-2%) | 8mo | $130,000 | $66 | 72 |
| 1109 Hays Park Ave | 0.37mi | 4/2.0 | 1,760 (-13%) | 7mo | $75,000 | $43 | 55 |
| 1122 Egleston Ave | 0.35mi | 4/2.5 | 1,800 (-11%) | 9mo | $150,000 | $83 | 55 |
| 1414 Portage St | 0.10mi | 3/2.0 (-1) | 1,774 (-13%) | 19mo | $70,000 | $39 | 54 |
| 508 Clinton Ave | 0.20mi | 5/2.0 (+1) | 2,310 (+14%) | 20mo | $73,000 | $32 | 46 |
| 920 Hays Park Ave | 0.30mi | 5/1.0 (+1) | 1,753 (-14%) | 11mo | $66,000 | $38 | 45 |
| 1326 Cameron St | 0.59mi | 5/2.0 (+1) | 2,146 (+6%) | 22mo | $145,000 | $68 | 40 |
| 1225 Franklin St | 0.75mi | 4/2.5 | 1,902 (-6%) | 22mo | $265,000 | $139 | 35 |
| 1816 High | 0.58mi | 3/1.5 (-1) | 1,742 (-14%) | 9mo | $143,000 | $82 | 34 |
| 301 Wall St | 0.75mi | 3/2.0 (-1) | 1,840 (-9%) | 18mo | $227,000 | $123 | 30 |
Match score weights: distance 35% · size 25% · config 20% · recency 20%. Top-matched comps best support the ARV.
Projected returns pro-forma
-3.0% appreciation · 6.41% rent growth · sell at horizon
- IRR
- 20.7%
- Equity multiple
- 1.88×
- Total profit
- $27,150
- Equity at exit
- $16,401
- IRR
- 31.1%
- Equity multiple
- 4.28×
- Total profit
- $101,111
- Equity at exit
- $9,511
Cash invested: $30,800 (down + closing). Projections, not guarantees.
Landlord ↔ Tenant lean methodology
- Overall (STATE)
- 62 Landlord-Friendly
- State Michigan
- 62 Landlord-Friendly · EVEN
- County
- — inherits STATE
- City
- — inherits STATE
ZIP-level market 49001
- Rents YoY
- 6.4%
- Active inventory
- 109
- Price-to-rent
- 5.2×
Monthly cashflow live
- Estimated rent
- $1,760 medium interval (Pro) →
- Mortgage (P&I)
- −$577
- Tax from tax record
- −$160 /mo · $1,920/yr
- Insurance
- −$46
- HOA
- −$0
- Vacancy / Maint / Mgmt
- −$370
- Net cashflow
- $607
Break-even live
Sensitivity live
| Price | -10% $670 | -5% $639 | +0% $607 | +5% $576 | +10% $545 |
|---|---|---|---|---|---|
| Rent | -10% $468 | -5% $538 | +0% $607 | +5% $677 | +10% $746 |
| Rate | -1.0pp $663 | -0.5pp $635 | base $607 | +0.5pp $579 | +1.0pp $550 |
UW: 25.0% down · 7.5% · 30yr · 1.5% tax · 5.0% vac · 8.0% maint · 8.0% mgmt
Financing live
Cash to close
- Down payment
- $27,500
- Closing costs
- $3,300
- Reserves months
- —
- Total cash needed
- —
Loan-product check · same deal, 3 products live
Conventional
25% down · 7.5% · 30yr
- Down + closing
- —
- Monthly P&I
- —
- Monthly cashflow
- —
- DSCR
- —
- Eligible?
- —
Personal DTI + credit; lowest rate.
DSCR
20% down · 8.5% · 30yr
- Down + closing
- —
- Monthly P&I
- —
- Monthly cashflow
- —
- DSCR
- —
- Eligible?
- —
No personal income docs; deal must DSCR.
Hard money
10% down · 12.0% · 12mo
- Down + closing
- —
- Monthly P&I
- —
- Monthly cashflow
- —
- DSCR
- —
- Eligible?
- —
Short-term bridge; refi at stabilization.
Rent comps 1 comps
| Address | Beds | Baths | Sqft | Rent | $/sqft | DOM | Units | Dist |
|---|---|---|---|---|---|---|---|---|
| 807 Central Park Cir Kalamazoo, MI | 1.0–3.0 | 1.0–2.0 | 1089 | $2,345 | $2.15 | 15d | 12 | 1.04mi |
Listing history 12 events
-
2026-05-14$110,000
-
2026-05-14historical
-
2026-05-14$110,000
-
2026-05-14historical
-
2014-09-25historical
-
2014-09-24historical
-
2008-11-12historical
-
2008-05-12$74,900
-
2008-05-12$74,900
-
2007-09-22historical
-
2007-03-22$89,900
-
2007-03-22$89,900
ⓘ Source: listings_history table (triggers on properties + properties_extension) + one-shot
backfill from property_details.listing_events for pre-trigger history.
Tax reassessment forecast MI · Partial reset (capped growth)
- Current annual tax
- $1,920 · $160/mo
- Projected year-2 tax
- $1,920 · $160/mo
- Expected delta
- $0/yr ($0/mo · 0.0%)
ⓘ Screening estimate from a state-policy table — verify with the county assessor before closing.
Climate risk First Street
- Flood 1/10 Low FEMA zone X (unshaded) · 0% chance over 30 yrs
- Wildfire 1/10 Low
- Heat 3/10 Moderate 7 d/yr ≥100°F today · 16 d/yr by 30 yrs out
- Wind 2/10 Low
- Air quality 2/10 Low 1 unhealthy d/yr today · 2 by 30 yrs out
Nearby sold comps map
Loading sold comps map…
Walkable amenities ~0.75 mi
Loading nearby amenities…
Taxation est. · year 1
- Rental income
- $21,116
- − Mortgage interest
- −$6,162
- − Property taxes
- −$1,920
- − Insurance
- −$550
- − Repairs & maintenance
- −$1,689
- − Management
- −$1,689
- − Depreciation
- −$3,200
- Taxable income
- $5,906
- Est. tax owed @ 24.0%
- −$1,417
- After-tax cash flow
- $5,872/yr
For passive investors: Depreciation is non-cash, so a rental often shows a tax loss while cash-flowing — sheltering income. Rental losses are passive: they offset passive income freely, and up to $25,000/yr can offset ordinary (W-2) income if you actively participate and your MAGI is under $100k (phasing out to $0 by $150k); unused losses carry forward. On sale, claimed depreciation is recaptured at up to 25%, and gains may owe capital-gains tax (a 1031 exchange can defer both). Figures are a year-1 estimate at your 24.0% rate — not tax advice; consult a CPA.
Schools (NCES district)
- District
- Kalamazoo Public Schools
- NCES district ID
- 2619950
- Math proficiency
- 43% ▲ 13.00%
- Reading proficiency
- 72% ▲ 33.00%
- Median HH income
- $35,291
- Composite
- 47.48/100
- National rank
- #2275
- State rank
- #71 of 540 in MI
Livability — Kalamazoo
- Score
- 76/100
- State rank
- #141
- US rank
- #3492
Category grades
Schools grade is shown separately in the Schools card above.
Census & demographics
- Census place
- Kalamazoo, MI
- County
- Kalamazoo County · 224,317 people
- City population
- 121,397
- Metro
- Kalamazoo-Portage, MI
- Population (ZIP)
- 20,946
- Household income
- $56,432
- Rent vs Own
- Severe rent burden
- 1184.0
Population outlook (Kalamazoo County) Hauer SSP2
- Today (2025)
- 280,982 people
- By 2030
- 292,068 · +3.9%
- By 2040
- 312,191 · +11.1%
- By 2050
- 331,196 · +17.9%
- By 2075
- 379,021 · +34.9%
- By 2100
- 396,579 · +41.1%
Race, ethnicity, and origin ACS 2023
- Neighborhood character
- Diverse neighborhood (Simpson 0.59)
- Race & ethnicity
- White 58% Black 22% Hispanic / Latino 15% Two or more races 5% Asian 2% Native American 1%
- Hispanic origin (detail)
- Mexican 13%
- Common ancestry
- Romanian 6% Iranian 4% Slovak 3%
- Foreign-born
- 9% · Canada
- Languages at home
- 84% English-only · Spanish 11% Arabic 2% Other Indo-European 1%
Political lean MEDSL · Kalamazoo
- 2024 margin
- D (+17.7) · D 58.0% · R 40.3% · Other 1.7%
- 2008→2024 swing
- -1.8pp toward R · 2008: 19.5pp · 2024: 17.7pp
- All cycles
- 2024: D+17.7 2020: D+18.7 2016: D+12.8 2012: D+13.3 2008: D+19.5
Not yet ingested
- Civics
- —
Market trends
- HPI YoY
- ▼ -264.90%
- Current HPI
- 206.9355
- Rent YoY
- ▲ 6.41%
- Metro
- Kalamazoo-Portage, MI
- State GDP YoY
- ▲ 1.37%
- F500 in state
- 28
Industry mix (Fortune 500 HQ in MI)
| Industry | F500 HQs | Revenue |
|---|---|---|
| Automotive Parts | 3 | $48B |
|
||
| Automotive | 2 | $372B |
|
||
| Chemicals | 1 | $45B |
|
||
| Automotive Retail | 1 | $29B |
|
||
| Healthcare / Medical Devices | 1 | $23B |
|
||
| Automotive Technology | 1 | $20B |
|
||
Price history
+22.4% since first listed12 events — show timeline
- 2026-05-14 Listing Removed — REALCOMP
- 2026-05-14 Listed $110,000 REALCOMP
- 2026-05-14 Listing Removed — MiRealSource-MiMLS
- 2026-05-14 Listed $110,000 MiRealSource-MiMLS
- 2014-09-25 Listing Removed — SW Michigan MLS
- 2014-09-24 Listing Removed — SW Michigan MLS
- 2008-11-12 Listing Removed — REALCOMP
- 2008-05-12 Listed $74,900 REALCOMP
- 2008-05-12 Listed $74,900 SW Michigan MLS
- 2007-09-22 Listing Removed — REALCOMP
- 2007-03-22 Listed $89,900 REALCOMP
- 2007-03-22 Listed $89,900 SW Michigan MLS
Property tax history
+10.0%/yrLatest (2025): $1,920 · +23.4% YoY. Source: county tax records.
Cash-flow waterfall
monthlySold comps — $/sqft
last 12 mo · ≤1 miLoading sold comps…