6000 E Brundage Ln #54 · East Niles, CA
Flood risk 1/10 · Minimal
- FEMA flood zone
- X (unshaded)
- Chance of flooding over 30 yrs
- 0.0%
- Est. flood insurance / yr
- $507 – $1,088
Fire risk 4/10 · Minor
- Est. fire insurance / yr
- $659 – $1,223
Heat risk 8/10 · Major
- Hot days now (above 105°F)
- 7 days/yr
- Hot days in 30 yrs
- 18 days/yr
Wind risk 1/10 · Minimal
- Chance of severe wind over 30 yrs
- —
Air-quality risk 10/10 · Severe
- Unhealthy air days now
- 34 days/yr
- Unhealthy air days in 30 yrs
- 40 days/yr
Risk factors via First Street. Map © Google.
Why this score? — see what drove the B+ grade
The composite is a weighted blend of 9 inputs, each scored 0–100. Each bar is that input's sub-score; the figure is the points it added to the 100-point composite (weight × sub-score).
- Cash flow +30.0/30.0
- ARV discount +15.0/15.0
- 1% rule +10.0/10.0
- DSCR +10.0/10.0
- Rent growth +3.9/5.0
- Schools +2.6/10.0
- Livability +2.5/5.0
- Condition / age +2.5/5.0
- Appreciation +0.0/10.0
$59,999
🖨 Deal sheet (PDF) 📄 Offer letter ✓ Due diligence
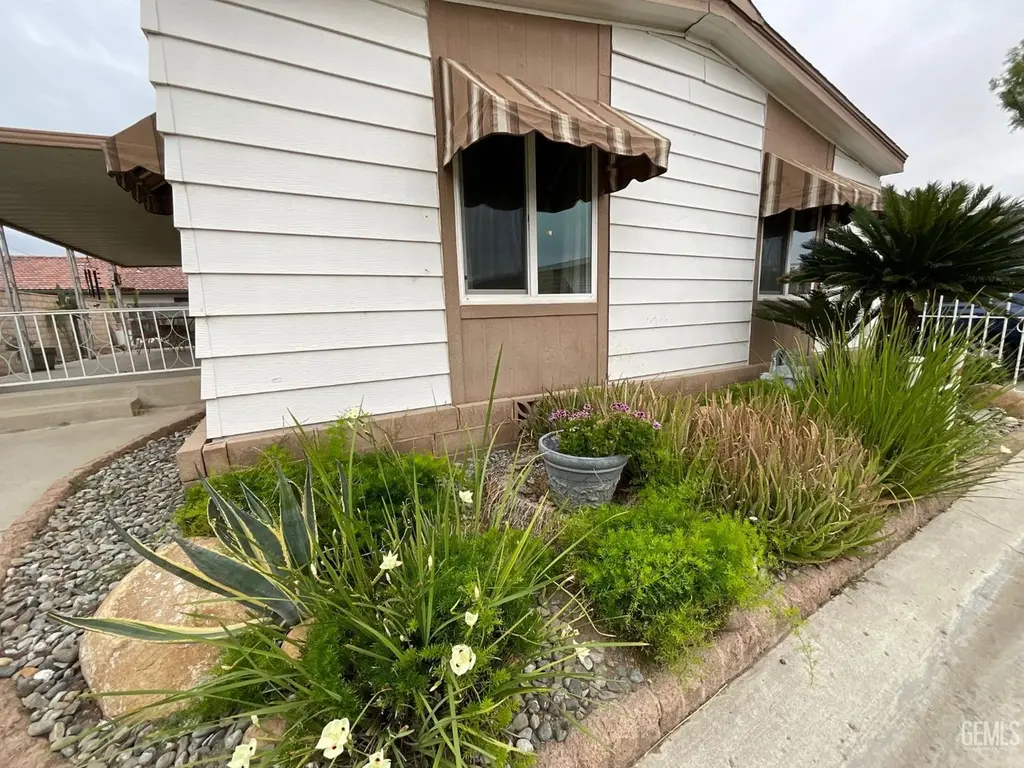
Listing remarks
Welcome to this well-kept 2-bedroom, 2-bathroom home located in a quiet, secluded corner of a desirable senior community. This move-in ready home features a newer AC, newer energy efficient windows, leased solar, and attractive LVT flooring throughout. Enjoy the convenience of an indoor laundry closet, covered parking, and a spacious covered patioperfect for relaxing or entertaining. The private side yard offers room for gardening or outdoor enjoyment. Comfortable, efficient, and tucked away in a peaceful settingdon't miss this opportunity!
Key facts
- Newer ac
- Covered parking
- Leased solar
Tags
Property features AI
Finance
- Other: Located in Edgewood Senior Community, neighborhood Fairfax
- HOA & community: Association clubhouse/recreation; Association maintenance/landscape; Association has pet rules (call for info); Association pool
Exterior
- Parking: Carport
- Utilities: Public water; Sewer
- Home design: Leased space; Pre-owned; Owner occupant; Solar panels are leased
- Construction: Composition roof
- Exterior features: Covered patio; Accessory unit; Community pool; Adult community
Interior
- Kitchen: Range/Oven; Dishwasher; Disposal; Microwave
- Bathrooms: 2 full bathrooms
- Heating & cooling: Central A/C; Central heat
- Interior features: Formal living room; Separated family room; Breakfast area; Split wing floor plan
Neighborhood map
What this means for you Summary
Snapshot
- This is a 2-bed/2.0-bath manufactured listed at $60k.
Deal economics
- At list price, monthly cash flow is $1k ($12k/yr) — positive.
- The deal already cash-flows at list — no discount required.
- Meets the 1% rule at list price ($2k rent vs $60k).
- Cap rate 26.3% vs local median 4.4% in East Niles — top-decile yield for the area; either an underpriced asset or a hidden risk that comps aren't pricing in. Stress-test before assuming the spread holds.
Location & tenants
- Location reads: area grade B — affects rentability + tenant quality, not the cash-flow math above.
- Fairfax Elementary (suburban): math 23% / reading 33% proficiency, ranked #1,118 of 1,400 in CA (top 80%) — low school quality limits family demand, transient renter base, plan for 1-2y turnover; 81% free/reduced lunch — lower-income household profile, screen leases tightly.
- Market conditions: Rents rising fast (+5.7%/yr); 311 active listings in the ZIP; 4 comparable units currently listed for rent nearby; rentals at typical pace (median 16d on market — plan ~3-4 weeks tenant-placement turnaround); 3,244 units permitted in Kern County in 2024 (73 in 5+ unit buildings).
- This rent runs 37% of the median local income ($56k/yr) — at the standard rent-burdened threshold; future hikes will face affordability resistance.
Forward outlook
- Local home prices are declining (-3.0%/yr); year-one equity from $415 of loan paydown is wiped out by about $2k of value loss. Plan a longer hold.
- Kern County population projected at +17% by 2050 — long-run rental-demand tailwind backs the buy-and-hold thesis.
- At projected returns (-3.0% appreciation + 5.7% rent growth), your $17k cash investment doubles in ~2 years — after that, you're playing with house money.
Negotiation context
- Only 5 days on market — expect competitive offers; lowballing is unlikely to land.
- 2 sale attempts with the ask held roughly flat each time — persistent listings suggest the price (not the market) is what's stuck; bring a comps-based counter.
Risks & watch-outs
- Climate carrying-cost: extreme-heat days projected 7→18/yr by 2055 (HVAC capex compounding) — expect insurance premiums to compound above CPI over the hold.
Questions for the listing agent
- Built in 1975 — when were the roof, HVAC, electrical panel, plumbing, and water heater last replaced?
- Is there a deadline driving the sale (1031 exchange, divorce, estate, relocation)? That informs how much negotiation room exists.
- What's the average days-on-market for RENTAL listings here right now (not sales)? A rising rental-DOM trend means longer vacancies and softer asking-rent achievability than the comps imply.
- What's the recent tenant-quality profile in this submarket — average credit score on applications, eviction rate, late-payment / NSF rate, and stable-employment percentage? A property-management company in the area should have these aggregated.
- How much new for-sale + rental construction is in the pipeline within 1–3 miles? Heavy new supply typically softens prices + rents 12–24 months out; constrained supply supports both.
Investment metrics
- 1% rule
- 2.91% ✓
- Cap rate
- 26.28%
- Cash-on-cash
- 71.40%
- DSCR
- 4.18
- GRM
- 2.9
CMA / ARV
- ARV (on-the-fly)
- $86,400
- Comps found
- 5
Show comp detail 5 sales within ~0.75 mi
| Address | Dist | Beds/Ba | Sqft | Sold | Price | $/sf | Match |
|---|---|---|---|---|---|---|---|
| 6000 E Brundage Ln #23 | 0.00mi | 2/1.8 | 1,344 (-7%) | 9mo | $80,000 | $60 | 80 |
| 6000 E Brundage Ln #35 | 0.00mi | 2/2.0 | 1,248 (-13%) | 3mo | $62,000 | $50 | 75 |
| 6000 E Brundage Ln #15 | 0.00mi | 3/2.0 (+1) | 1,636 (+14%) | 10mo | $145,000 | $89 | 64 |
| 6000 E Brundage Ln #59 | 0.00mi | 3/2.0 (+1) | 1,575 (+9%) | 21mo | $70,000 | $44 | 62 |
| 500 Dunninger St | 0.71mi | 3/2.0 (+1) | 1,350 (-6%) | 19mo | $298,000 | $221 | 36 |
Match score weights: distance 35% · size 25% · config 20% · recency 20%. Top-matched comps best support the ARV.
Projected returns pro-forma
-3.0% appreciation · 5.71% rent growth · sell at horizon
- IRR
- 74.0%
- Equity multiple
- 4.50×
- Total profit
- $58,839
- Equity at exit
- $8,946
- IRR
- 78.5%
- Equity multiple
- 10.19×
- Total profit
- $154,466
- Equity at exit
- $5,188
Cash invested: $16,800 (down + closing). Projections, not guarantees.
Landlord ↔ Tenant lean methodology
- Overall (STATE)
- 18 Strongly Tenant-Friendly
- State California
- 18 Strongly Tenant-Friendly · D+13
- County
- — inherits STATE
- City
- — inherits STATE
ZIP-level market 93307
- Rents YoY
- 5.7%
- Active inventory
- 311
- Price-to-rent
- 2.9×
Monthly cashflow live
- Estimated rent
- $1,748 medium interval (Pro) →
- Mortgage (P&I)
- −$315
- Tax from tax record
- −$41 /mo · $497/yr
- Insurance
- −$25
- HOA
- −$0
- Vacancy / Maint / Mgmt
- −$367
- Net cashflow
- $1,000
Break-even live
Sensitivity live
| Price | -10% $1,034 | -5% $1,017 | +0% $1,000 | +5% $983 | +10% $966 |
|---|---|---|---|---|---|
| Rent | -10% $861 | -5% $931 | +0% $1,000 | +5% $1,069 | +10% $1,138 |
| Rate | -1.0pp $1,030 | -0.5pp $1,015 | base $1,000 | +0.5pp $984 | +1.0pp $968 |
UW: 25.0% down · 7.5% · 30yr · 1.5% tax · 5.0% vac · 8.0% maint · 8.0% mgmt
Financing live
Cash to close
- Down payment
- $15,000
- Closing costs
- $1,800
- Reserves months
- —
- Total cash needed
- —
Loan-product check · same deal, 3 products live
Conventional
25% down · 7.5% · 30yr
- Down + closing
- —
- Monthly P&I
- —
- Monthly cashflow
- —
- DSCR
- —
- Eligible?
- —
Personal DTI + credit; lowest rate.
DSCR
20% down · 8.5% · 30yr
- Down + closing
- —
- Monthly P&I
- —
- Monthly cashflow
- —
- DSCR
- —
- Eligible?
- —
No personal income docs; deal must DSCR.
Hard money
10% down · 12.0% · 12mo
- Down + closing
- —
- Monthly P&I
- —
- Monthly cashflow
- —
- DSCR
- —
- Eligible?
- —
Short-term bridge; refi at stabilization.
Rent comps 4 comps
| Address | Beds | Baths | Sqft | Rent | $/sqft | DOM | Units | Dist |
|---|---|---|---|---|---|---|---|---|
| 805 Apple St Bakersfield, CA | 2.0 | 2.0 | 1575 | $1,595 | $1.01 | 15d | 1 | 0.77mi |
| 3311 Camellia Dr Bakersfield, CA | 3.0 | 2.0 | 1128 | $1,925 | $1.71 | 44d | 1 | 0.87mi |
| 460 Oswell St Unit B Bakersfield, CA | 3.0 | 2.0 | 1324 | $1,700 | $1.28 | 3d | 1 | 0.94mi |
| 925 Pesante Rd Bakersfield, CA | 3.0 | 2.0 | 1500 | $1,800 | $1.20 | 3d | 1 | 1.25mi |
Listing history 5 events
-
2026-06-05status $59,999 Pending 5 DOM
-
2026-06-03days on market $59,999 Active 5 DOM
-
2026-06-03days on market $59,999 Active 4 DOM
-
2026-06-01days on market $59,999 Active 3 DOM
-
2026-05-31days on market $59,999 Active 2 DOM
ⓘ Source: listings_history table (triggers on properties + properties_extension) + one-shot
backfill from property_details.listing_events for pre-trigger history.
Tax reassessment forecast CA · Resets to sale price
- Current annual tax
- $497 · $41/mo
- Projected year-2 tax
- $497 · $41/mo
- Expected delta
- $0/yr ($0/mo · -0.0%)
ⓘ Screening estimate from a state-policy table — verify with the county assessor before closing.
Climate risk First Street
- Flood 1/10 Low FEMA zone X (unshaded) · 0% chance over 30 yrs
- Wildfire 4/10 Moderate
- Heat 8/10 Severe 7 d/yr ≥105°F today · 18 d/yr by 30 yrs out
- Wind 1/10 Low
- Air quality 10/10 Extreme 34 unhealthy d/yr today · 40 by 30 yrs out
Nearby sold comps map
Loading sold comps map…
Walkable amenities ~0.75 mi
Loading nearby amenities…
Taxation est. · year 1
- Rental income
- $20,971
- − Mortgage interest
- −$3,361
- − Property taxes
- −$497
- − Insurance
- −$300
- − Repairs & maintenance
- −$1,678
- − Management
- −$1,678
- − Depreciation
- −$1,745
- Taxable income
- $11,713
- Est. tax owed @ 24.0%
- −$2,811
- After-tax cash flow
- $9,184/yr
For passive investors: Depreciation is non-cash, so a rental often shows a tax loss while cash-flowing — sheltering income. Rental losses are passive: they offset passive income freely, and up to $25,000/yr can offset ordinary (W-2) income if you actively participate and your MAGI is under $100k (phasing out to $0 by $150k); unused losses carry forward. On sale, claimed depreciation is recaptured at up to 25%, and gains may owe capital-gains tax (a 1031 exchange can defer both). Figures are a year-1 estimate at your 24.0% rate — not tax advice; consult a CPA.
Schools (NCES district)
- District
- Fairfax Elementary
- NCES district ID
- 0613290
- Math proficiency
- 23% ▲ 4.00%
- Reading proficiency
- 33% ▲ 4.00%
- Median HH income
- $39,651
- Composite
- 26.45/100
- National rank
- #12639
- State rank
- #1118 of 1400 in CA
Livability — East Niles
No livability data for this city. (Only ~50 U.S. cities are tracked.)
Census & demographics
- Census place
- East Niles, CA
- County
- Kern County · 710,371 people
- Metro
- Bakersfield, CA
- Population (ZIP)
- 85,945
- Household income
- $56,446
- Rent vs Own
- Severe rent burden
- 3246.0
Population outlook (Kern County) Hauer SSP2
- Today (2025)
- 947,286 people
- By 2030
- 978,984 · +3.3%
- By 2040
- 1,045,018 · +10.3%
- By 2050
- 1,105,232 · +16.7%
- By 2075
- 1,229,538 · +29.8%
- By 2100
- 1,238,059 · +30.7%
Race, ethnicity, and origin ACS 2023
- Neighborhood character
- Predominantly Hispanic (80%)
- Race & ethnicity
- Hispanic / Latino 80% Two or more races 12% White 10% Black 6% Asian 3% Native American 1%
- Hispanic origin (detail)
- Mexican 73%
- Common ancestry
- Lithuanian 0%
- Foreign-born
- 31% · Canada
- Languages at home
- 28% English-only · Spanish 69% Other Indo-European 1% Arabic 1%
Political lean MEDSL · Kern
- 2024 margin
- Strong R (+21.1) · D 38.2% · R 59.3% · Other 2.5%
- 2008→2024 swing
- -3.3pp toward R · 2008: -17.8pp · 2024: -21.1pp
- All cycles
- 2024: R+21.1 2020: R+10.2 2016: R+15.0 2012: R+20.9 2008: R+17.8
Not yet ingested
- Civics
- —
Market trends
- HPI YoY
- ▼ -263.59%
- Current HPI
- 447.1746
- Rent YoY
- ▲ 5.71%
- Metro
- Bakersfield, CA
- State GDP YoY
- ▲ 3.21%
- F500 in state
- 116
Industry mix (Fortune 500 HQ in CA)
| Industry | F500 HQs | Revenue |
|---|---|---|
| Technology | 27 | $1,492B |
|
||
| Financial Services | 3 | $174B |
|
||
| Retail | 3 | $44B |
|
||
| Insurance | 3 | $26B |
|
||
| Media / Entertainment | 2 | $115B |
|
||
| Pharmaceuticals / Biotech | 2 | $62B |
|
||
Price history
-25.0% since first listed4 events — show timeline
- 2026-05-29 Listed $59,999 GEMLS
- 2026-01-27 Price Changed $69,000 GEMLS
- 2026-01-12 Price Changed $75,000 GEMLS
- 2025-10-06 Listed $80,000 GEMLS
Property tax history
+2.0%/yrLatest (2025): $497 · +23.2% YoY. Source: county tax records.
Cash-flow waterfall
monthlySold comps — $/sqft
last 12 mo · ≤1 miLoading sold comps…