1214 Bechtel Ave · Lincoln Heights, OH
Flood risk 1/10 · Minimal
- FEMA flood zone
- X (unshaded)
- Chance of flooding over 30 yrs
- 0.0%
- Est. flood insurance / yr
- $473 – $860
Fire risk 1/10 · Minimal
- Est. fire insurance / yr
- $713 – $1,323
Heat risk 2/10 · Minimal
- Hot days now (above 96°F)
- 7 days/yr
- Hot days in 30 yrs
- 17 days/yr
Wind risk 2/10 · Minimal
- Chance of severe wind over 30 yrs
- 0.0%
Air-quality risk 2/10 · Minimal
- Unhealthy air days now
- 1 days/yr
- Unhealthy air days in 30 yrs
- 1 days/yr
Risk factors via First Street. Map © Google.
Why this score? — see what drove the D+ grade
The composite is a weighted blend of 9 inputs, each scored 0–100. Each bar is that input's sub-score; the figure is the points it added to the 100-point composite (weight × sub-score).
- Cash flow +15.0/30.0
- ARV discount +7.5/15.0
- 1% rule +5.0/10.0
- DSCR +5.0/10.0
- Schools +4.3/10.0
- Livability +3.5/5.0
- Rent growth +2.5/5.0
- Condition / age +2.5/5.0
- Appreciation +0.0/10.0
$1
🖨 Deal sheet 📄 Offer letter ✓ Due diligence
Listing remarks MLS
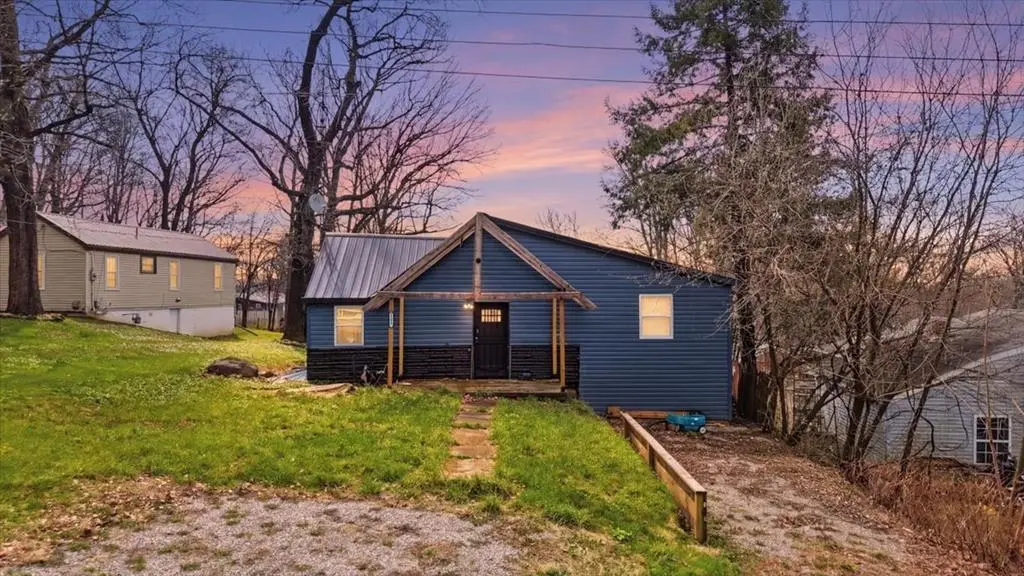
INVESTOR SPECIAL!!! 3 Bedrooms, 1 bath in Madison Schools! Looking to do a renovation or for a rental this one is yours.
Key facts
- Near shopping
- Near restaurants
- Near parks
Tags
Property features AI
Exterior
- Utilities: Public water; Public sewer
- Home design: Single-family residence; Residential property
- Construction: Vinyl siding
Interior
- Kitchen: Dishwasher
- Bathrooms: 2 full bathrooms
- Heating & cooling: Forced air heating; Natural gas heating
- Interior features: Dishwasher; Full basement
Neighborhood map
What this means for you Summary
Snapshot
- This is a 3-bed/1.0-bath single-family listed at $1.
Deal economics
- At list price, monthly cash flow is $806 ($10k/yr) — positive.
- The deal already cash-flows at list — no discount required.
- Meets the 1% rule at list price ($1k rent vs $1).
Location & tenants
- Location reads 69/100 on livability (#534 in OH) — a middle-class / working-renter tenant base. Strengths: commute A+, cost of living A+, crime B+; Watch: housing D, schools D-, amenities F.
- Madison Local (suburban): math 48% / reading 56% proficiency, ranked #430 of 656 in OH (top 66%) — acceptable for families but not a draw, mixed tenant base, ~2y average lease.
- Market conditions: 32 active listings in the ZIP; 145 units permitted in Richland County in 2024 (0 in 5+ unit buildings).
Forward outlook
- Local home prices are declining (-3.0%/yr); year-one equity from $0 of loan paydown is wiped out by about $0 of value loss. Plan a longer hold.
- Richland County population projected at -18% by 2050 — secular population decline; favor cash flow + early exit over multi-decade hold.
- At projected returns (-3.0% appreciation + 3.0% rent growth), your $0 cash investment doubles in ~1 year — after that, you're playing with house money.
Negotiation context
- It's been on market 23 days — a 2% lower offer ($0) is reasonable based on typical stale-listing flexibility.
- 4 sale attempts since 3y ago with the ask held roughly flat each time — persistent listings suggest the price (not the market) is what's stuck; bring a comps-based counter.
Risks & watch-outs
- Watch-outs: built in 1947 — expect roof / HVAC / electrical / plumbing capex.
Questions for the listing agent
- Built in 1947 — when were the roof, HVAC, electrical panel, plumbing, and water heater last replaced?
- Is there a deadline driving the sale (1031 exchange, divorce, estate, relocation)? That informs how much negotiation room exists.
- Schools are D-rated, which usually means shorter tenancies and higher turnover. Who's the typical renter profile here, and what's been the actual vacancy rate?
- The area grade is low — what's the realistic commute time and amenity access for the typical tenant pool here? Any planned neighborhood developments (good or bad) we should know about?
- What's the average days-on-market for RENTAL listings here right now (not sales)? A rising rental-DOM trend means longer vacancies and softer asking-rent achievability than the comps imply.
- What's the recent tenant-quality profile in this submarket — average credit score on applications, eviction rate, late-payment / NSF rate, and stable-employment percentage? A property-management company in the area should have these aggregated.
- How much new for-sale + rental construction is in the pipeline within 1–3 miles? Heavy new supply typically softens prices + rents 12–24 months out; constrained supply supports both.
Investment metrics
- 1% rule
- 102034.00% ✓
- Cap rate
- 967280.32%
- Cash-on-cash
- 3454550.10%
- DSCR
- 153709.04
- GRM
- 0.0
CMA / ARV
No comps found within radius.
Projected returns pro-forma
-3.0% appreciation · 3.0% rent growth · sell at horizon
- IRR
- —
- Equity multiple
- 183407.18×
- Total profit
- $51,354
- Equity at exit
- $0
- IRR
- —
- Equity multiple
- 396025.95×
- Total profit
- $110,887
- Equity at exit
- $0
Cash invested: $0 (down + closing). Projections, not guarantees.
Landlord ↔ Tenant lean methodology
- Overall (STATE)
- 73 Landlord-Friendly
- State Ohio
- 73 Landlord-Friendly · R+6
- County
- — inherits STATE
- City
- — inherits STATE
ZIP-level market 44905
- Home prices YoY
- -24.4%
- Active inventory
- 32
Monthly cashflow live
- Estimated rent
- $1,020 medium interval (Pro) →
- Mortgage (P&I)
- −$0
- Tax est. 1.5%
- −$0 /mo · $0/yr
- Insurance
- −$0
- HOA
- −$0
- Vacancy / Maint / Mgmt
- −$214
- Net cashflow
- $806
Break-even live
UW: 25.0% down · 7.5% · 30yr · 1.5% tax · 5.0% vac · 8.0% maint · 8.0% mgmt
Financing live
Cash to close
- Down payment
- $0
- Closing costs
- $0
- Reserves months
- —
- Total cash needed
- —
Loan-product check · same deal, 3 products live
Conventional
25% down · 7.5% · 30yr
- Down + closing
- —
- Monthly P&I
- —
- Monthly cashflow
- —
- DSCR
- —
- Eligible?
- —
Personal DTI + credit; lowest rate.
DSCR
20% down · 8.5% · 30yr
- Down + closing
- —
- Monthly P&I
- —
- Monthly cashflow
- —
- DSCR
- —
- Eligible?
- —
No personal income docs; deal must DSCR.
Hard money
10% down · 12.0% · 12mo
- Down + closing
- —
- Monthly P&I
- —
- Monthly cashflow
- —
- DSCR
- —
- Eligible?
- —
Short-term bridge; refi at stabilization.
Listing history 10 events
-
2026-06-18days on market $1 Active 23 DOM
-
2026-06-17days on market $1 Active 22 DOM
-
2026-06-16days on market $1 Active 21 DOM
-
2026-06-15days on market $1 Active 20 DOM
-
2026-06-13days on market $1 Active 18 DOM
-
2026-06-12days on market $1 Active 17 DOM
-
2026-06-09days on market $1 Active 14 DOM
-
2026-06-08days on market $1 Active 13 DOM
-
2026-06-08remarks 530-char remark
-
2026-06-08$1 Active 12 DOM
ⓘ Source: listings_history table (triggers on properties + properties_extension) + one-shot
backfill from property_details.listing_events for pre-trigger history.
Climate risk First Street
- Flood 1/10 Low FEMA zone X (unshaded) · 0% chance over 30 yrs
- Wildfire 1/10 Low
- Heat 2/10 Low 7 d/yr ≥96°F today · 17 d/yr by 30 yrs out
- Wind 2/10 Low 0% chance of damaging wind over 30 yrs
- Air quality 2/10 Low 1 unhealthy d/yr today · 1 by 30 yrs out
Nearby sold comps map
Loading sold comps map…
Walkable amenities ~0.75 mi
Loading nearby amenities…
Taxation est. · year 1
- Rental income
- $12,244
- − Mortgage interest
- −$0
- − Property taxes
- −$0
- − Insurance
- −$0
- − Repairs & maintenance
- −$980
- − Management
- −$980
- − Depreciation
- −$0
- Taxable income
- $10,285
- Est. tax owed @ 24.0%
- −$2,468
- After-tax cash flow
- $7,204/yr
For passive investors: Depreciation is non-cash, so a rental often shows a tax loss while cash-flowing — sheltering income. Rental losses are passive: they offset passive income freely, and up to $25,000/yr can offset ordinary (W-2) income if you actively participate and your MAGI is under $100k (phasing out to $0 by $150k); unused losses carry forward. On sale, claimed depreciation is recaptured at up to 25%, and gains may owe capital-gains tax (a 1031 exchange can defer both). Figures are a year-1 estimate at your 24.0% rate — not tax advice; consult a CPA.
Schools (NCES district)
- District
- Madison Local
- NCES district ID
- 3904945
- Math proficiency
- 48% ▼ -13.00%
- Reading proficiency
- 56% ▼ -6.00%
- Median HH income
- $39,880
- Composite
- 43.45/100
- National rank
- #3007
- State rank
- #430 of 656 in OH
Livability — Lincoln Heights
- Score
- 69/100
- State rank
- #534
- US rank
- #9027
Category grades
Schools grade is shown separately in the Schools card above.
Census & demographics
- County
- Richland · 128,966 people
- Metro
- Mansfield, OH
- Population (ZIP)
- 16,254
- Household income
- $55,716
- Rent vs Own
- Severe rent burden
- 3.1
Population outlook (Richland County) Hauer SSP2
- Today (2025)
- 115,577 people
- By 2030
- 111,669 · -3.4%
- By 2040
- 103,323 · -10.6%
- By 2050
- 95,135 · -17.7%
- By 2075
- 76,719 · -33.6%
- By 2100
- 57,188 · -50.5%
Race, ethnicity, and origin ACS 2023
- Neighborhood character
- Predominantly White (76%)
- Race & ethnicity
- White 76% Black 14% Two or more races 6% Hispanic / Latino 5%
- Common ancestry
- Serbian 2% Iranian 2% Romanian 1%
- Foreign-born
- 1% · Canada
- Languages at home
- 96% English-only · Spanish 2%
Political lean MEDSL · Richland
- 2024 margin
- Solid R (+42.3) · D 28.4% · R 70.8%
- 2008→2024 swing
- -28.8pp toward R · 2008: -13.6pp · 2024: -42.3pp
- All cycles
- 2024: R+42.3 2020: R+39.7 2016: R+37.5 2012: R+20.1 2008: R+13.6
Not yet ingested
- Civics
- —
Market trends
- HPI YoY
- ▼ -85.07%
- Current HPI
- 264.3148
- Rent YoY
- —
- Metro
- —
- State GDP YoY
- ▲ 1.98%
- F500 in state
- 48
Industry mix (Fortune 500 HQ in OH)
| Industry | F500 HQs | Revenue |
|---|---|---|
| Insurance | 3 | $145B |
|
||
| Industrial Machinery | 3 | $49B |
|
||
| Financial Services | 3 | $24B |
|
||
| Consumer Goods | 2 | $93B |
|
||
| Aerospace / Defense | 2 | $47B |
|
||
| Utilities | 2 | $33B |
|
||
Price history
+13.8% since first listed10 events — show timeline
- 2026-05-26 Listed $1 MARMLS
- 2023-08-08 Sold (MLS) $17,000 MARMLS
- 2023-08-04 Delisted — MARMLS
- 2023-08-02 Pending — MARMLS
- 2023-07-14 Relisted — MARMLS
- 2023-07-03 Relisted — MARMLS
- 2023-07-01 Listed $24,900 MARMLS
- 2008-10-09 Sold (Public Records) $30,000 Public Records
- 1996-10-08 Sold (Public Records) $24,000 Public Records
- 1993-08-09 Sold (Public Records) $14,934 Public Records
Property tax history
+0.5%/yrLatest (2025): $1,167 · +28.3% YoY. Source: county tax records.
Cash-flow waterfall
monthlySold comps — $/sqft
last 12 mo · ≤1 miLoading sold comps…