301 N Steam Engine Rd · Corydon, IN
Flood risk 1/10 · Minimal
- FEMA flood zone
- X (unshaded)
- Chance of flooding over 30 yrs
- 0.0%
- Est. flood insurance / yr
- $507 – $1,088
Fire risk 1/10 · Minimal
- Est. fire insurance / yr
- $717 – $1,331
Heat risk 5/10 · Moderate
- Hot days now (above 105°F)
- 7 days/yr
- Hot days in 30 yrs
- 19 days/yr
Wind risk 2/10 · Minimal
- Chance of severe wind over 30 yrs
- 2.0%
Air-quality risk 3/10 · Minor
- Unhealthy air days now
- 2 days/yr
- Unhealthy air days in 30 yrs
- 3 days/yr
Risk factors via First Street. Map © Google.
Why this score? — see what drove the B- grade
The composite is a weighted blend of 9 inputs, each scored 0–100. Each bar is that input's sub-score; the figure is the points it added to the 100-point composite (weight × sub-score).
- Cash flow +30.0/30.0
- 1% rule +10.0/10.0
- DSCR +10.0/10.0
- ARV discount +7.5/15.0
- Schools +3.9/10.0
- Livability +3.5/5.0
- Rent growth +2.5/5.0
- Condition / age +2.5/5.0
- Appreciation +0.0/10.0
$69,500
🖨 Deal sheet (PDF) 📄 Offer letter ✓ Due diligence
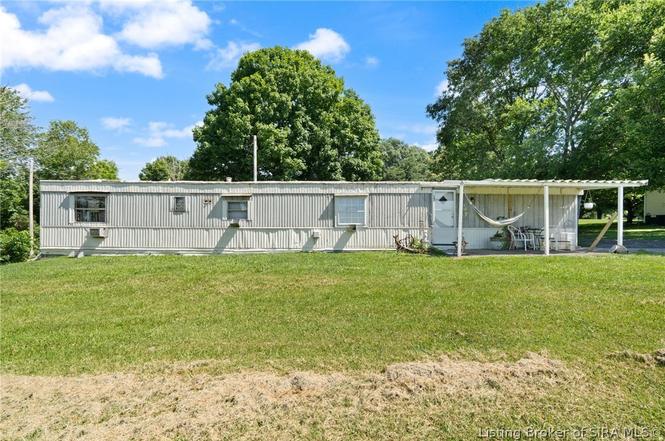
Listing remarks
GREAT location for this home on the end of a DEAD END ROAD. .. .This single wide home sits on 1 ac of land and backs up to open farm ground. If you are looking for peace and quiet-this is it. You could buy the land, remove the single wide and build your new home here later down the road. Living at the end of a dead end road is a DREAM! The 2 bedroom 1 bath home needs TLC and is priced accordingly. The majority of the value is in the land and utilities. This home is currently occupied and a scheduled appointment is mandatory. This home is available by cash purchase or a conventional loan only. This home will not quality for a FHA, VA, or Rural Housing Loan. The home is being sold AS-IS.
Key facts
- 1 ac of land
- Open farm ground
- 1 acre lot
Tags
Property features AI
Exterior
- Parking: Paved driveway
- Utilities: Public water connected; Septic tank
- Home design: Single-wide mobile home; One-story; Slab foundation
- Construction: Aluminum siding; Built on slab foundation
- Exterior features: Deck; Covered patio/porch; Patio; Paved driveway; Paved road access; Has a view
Interior
- Kitchen: Kitchen on the first floor (approx. 12.5 x 11.9); Oven; Range; Refrigerator
- Bedrooms: One bedroom on the first floor (approx. 10.6 x 10.4)
- Bathrooms: One full bathroom on the first floor (approx. 7.3 x 7.6)
- Interior features: Eat-in kitchen; Primary bedroom with bath; Main level primary bedroom; Split bedroom floorplan; Utility room
- Laundry & utility: Laundry on the main level; Utility room
Neighborhood map
What this means for you Summary
Snapshot
- This is a 4-bed/2.0-bath manufactured listed at $70k.
Deal economics
- At list price, monthly cash flow is $711 ($9k/yr) — positive.
- The deal already cash-flows at list — no discount required.
- Meets the 1% rule at list price ($2k rent vs $70k).
- Cap rate 18.6% vs local median 3.5% in Corydon — top-decile yield for the area; either an underpriced asset or a hidden risk that comps aren't pricing in. Stress-test before assuming the spread holds.
Location & tenants
- Location reads 70/100 on livability (#163 in IN) — a middle-class / working-renter tenant base. Strengths: cost of living A+, housing A+, crime A; Watch: amenities D, commute F, employment F.
- South Harrison Community Schools (town): math 42% / reading 50% proficiency, ranked #89 of 301 in IN (top 30%) — families likely to look elsewhere, expect single-tenant / working-renter base with shorter leases.
- Market conditions: 80 active listings in the ZIP; 158 units permitted in Harrison County in 2024 (0 in 5+ unit buildings).
Forward outlook
- Local home prices are declining (-3.0%/yr); year-one equity from $481 of loan paydown is wiped out by about $2k of value loss. Plan a longer hold.
- Harrison County population projected to shrink 6% by 2050 — rents likely to lag national; underwrite the cash flow, not the appreciation.
- At projected returns (-3.0% appreciation + 3.0% rent growth), your $19k cash investment doubles in ~3 years — after that, you're playing with house money.
Negotiation context
- Only 4 days on market — expect competitive offers; lowballing is unlikely to land.
Risks & watch-outs
- Climate carrying-cost: extreme-heat days projected 7→19/yr by 2055 (HVAC capex compounding) — expect insurance premiums to compound above CPI over the hold.
Questions for the listing agent
- Is there a deadline driving the sale (1031 exchange, divorce, estate, relocation)? That informs how much negotiation room exists.
- What's the average days-on-market for RENTAL listings here right now (not sales)? A rising rental-DOM trend means longer vacancies and softer asking-rent achievability than the comps imply.
- What's the recent tenant-quality profile in this submarket — average credit score on applications, eviction rate, late-payment / NSF rate, and stable-employment percentage? A property-management company in the area should have these aggregated.
- How much new for-sale + rental construction is in the pipeline within 1–3 miles? Heavy new supply typically softens prices + rents 12–24 months out; constrained supply supports both.
Investment metrics
- 1% rule
- 2.17% ✓
- Cap rate
- 18.57%
- Cash-on-cash
- 43.86%
- DSCR
- 2.95
- GRM
- 3.8
CMA / ARV
No comps found within radius.
Projected returns pro-forma
-3.0% appreciation · 3.0% rent growth · sell at horizon
- IRR
- 40.8%
- Equity multiple
- 2.75×
- Total profit
- $34,060
- Equity at exit
- $10,363
- IRR
- 47.1%
- Equity multiple
- 5.53×
- Total profit
- $88,082
- Equity at exit
- $6,009
Cash invested: $19,460 (down + closing). Projections, not guarantees.
Landlord ↔ Tenant lean methodology
- Overall (STATE)
- 90 Strongly Landlord-Friendly
- State Indiana
- 90 Strongly Landlord-Friendly · R+11
- County
- — inherits STATE
- City
- — inherits STATE
ZIP-level market 47112
- Home prices YoY
- -30.1%
- Active inventory
- 80
- Price-to-rent
- 3.8×
Monthly cashflow live
- Estimated rent
- $1,508 medium interval (Pro) →
- Mortgage (P&I)
- −$364
- Tax est. 1.5%
- −$87 /mo · $1,042/yr
- Insurance
- −$29
- HOA
- −$0
- Vacancy / Maint / Mgmt
- −$317
- Net cashflow
- $711
Break-even live
Sensitivity live
| Price | -10% $759 | -5% $735 | +0% $711 | +5% $687 | +10% $663 |
|---|---|---|---|---|---|
| Rent | -10% $592 | -5% $652 | +0% $711 | +5% $771 | +10% $830 |
| Rate | -1.0pp $746 | -0.5pp $729 | base $711 | +0.5pp $693 | +1.0pp $675 |
UW: 25.0% down · 7.5% · 30yr · 1.5% tax · 5.0% vac · 8.0% maint · 8.0% mgmt
Financing live
Cash to close
- Down payment
- $17,375
- Closing costs
- $2,085
- Reserves months
- —
- Total cash needed
- —
Loan-product check · same deal, 3 products live
Conventional
25% down · 7.5% · 30yr
- Down + closing
- —
- Monthly P&I
- —
- Monthly cashflow
- —
- DSCR
- —
- Eligible?
- —
Personal DTI + credit; lowest rate.
DSCR
20% down · 8.5% · 30yr
- Down + closing
- —
- Monthly P&I
- —
- Monthly cashflow
- —
- DSCR
- —
- Eligible?
- —
No personal income docs; deal must DSCR.
Hard money
10% down · 12.0% · 12mo
- Down + closing
- —
- Monthly P&I
- —
- Monthly cashflow
- —
- DSCR
- —
- Eligible?
- —
Short-term bridge; refi at stabilization.
Listing history 3 events
-
2026-06-15days on market $69,500 Active 4 DOM
-
2026-06-13remarks 694-char remark
-
2026-06-13$69,500 Active 2 DOM
ⓘ Source: listings_history table (triggers on properties + properties_extension) + one-shot
backfill from property_details.listing_events for pre-trigger history.
Climate risk First Street
- Flood 1/10 Low FEMA zone X (unshaded) · 0% chance over 30 yrs
- Wildfire 1/10 Low
- Heat 5/10 Major 7 d/yr ≥105°F today · 19 d/yr by 30 yrs out
- Wind 2/10 Low 2% chance of damaging wind over 30 yrs
- Air quality 3/10 Moderate 2 unhealthy d/yr today · 3 by 30 yrs out
Nearby sold comps map
Loading sold comps map…
Walkable amenities ~0.75 mi
Loading nearby amenities…
Taxation est. · year 1
- Rental income
- $18,099
- − Mortgage interest
- −$3,893
- − Property taxes
- −$1,042
- − Insurance
- −$348
- − Repairs & maintenance
- −$1,448
- − Management
- −$1,448
- − Depreciation
- −$2,022
- Taxable income
- $7,899
- Est. tax owed @ 24.0%
- −$1,896
- After-tax cash flow
- $6,639/yr
For passive investors: Depreciation is non-cash, so a rental often shows a tax loss while cash-flowing — sheltering income. Rental losses are passive: they offset passive income freely, and up to $25,000/yr can offset ordinary (W-2) income if you actively participate and your MAGI is under $100k (phasing out to $0 by $150k); unused losses carry forward. On sale, claimed depreciation is recaptured at up to 25%, and gains may owe capital-gains tax (a 1031 exchange can defer both). Figures are a year-1 estimate at your 24.0% rate — not tax advice; consult a CPA.
Schools (NCES district)
- District
- South Harrison Community Schools
- NCES district ID
- 1810360
- Math proficiency
- 42% ▼ -12.00%
- Reading proficiency
- 50% ▼ -3.00%
- Median HH income
- $50,528
- Composite
- 39.49/100
- National rank
- #3950
- State rank
- #89 of 301 in IN
Livability — Corydon
- Score
- 70/100
- State rank
- #163
- US rank
- #7834
Category grades
Schools grade is shown separately in the Schools card above.
Census & demographics
- Population (ZIP)
- 17,123
Population outlook (Harrison County) Hauer SSP2
- Today (2025)
- 40,288 people
- By 2030
- 40,265 · -0.1%
- By 2040
- 39,538 · -1.9%
- By 2050
- 37,781 · -6.2%
- By 2075
- 33,200 · -17.6%
- By 2100
- 26,668 · -33.8%
Race, ethnicity, and origin ACS 2023
- Neighborhood character
- Predominantly White (93%)
- Race & ethnicity
- White 93% Hispanic / Latino 4% Two or more races 2% Black 1% Native American 1%
- Common ancestry
- Lithuanian 2% Slovak 2% Italian 2%
- Foreign-born
- 2% · Canada
- Languages at home
- 97% English-only · Spanish 3%
Political lean MEDSL · Harrison
- 2024 margin
- Solid R (+47.0) · D 25.6% · R 72.5% · Other 1.8%
- 2008→2024 swing
- -28.9pp toward R · 2008: -18.0pp · 2024: -47.0pp
- All cycles
- 2024: R+47.0 2020: R+45.6 2016: R+44.4 2012: R+22.8 2008: R+18.0
Not yet ingested
- Civics
- —
Market trends
- HPI YoY
- ▼ -90.43%
- Current HPI
- 210.4158
- Rent YoY
- —
- Metro
- —
- State GDP YoY
- ▲ 2.90%
- F500 in state
- 18
Industry mix (Fortune 500 HQ in IN)
| Industry | F500 HQs | Revenue |
|---|---|---|
| Industrial Machinery | 2 | $37B |
|
||
| Healthcare | 1 | $177B |
|
||
| Pharmaceuticals | 1 | $45B |
|
||
| Metals / Steel | 1 | $18B |
|
||
| Agriculture | 1 | $17B |
|
||
| Packaging | 1 | $12B |
|
||
Price history
1 event — show timeline
- 2026-06-11 Listed $69,500 SIRA
Property tax history
-10.5%/yrLatest (2024): $101 · +1.6% YoY. Source: county tax records.
Cash-flow waterfall
monthlySold comps — $/sqft
last 12 mo · ≤1 miLoading sold comps…