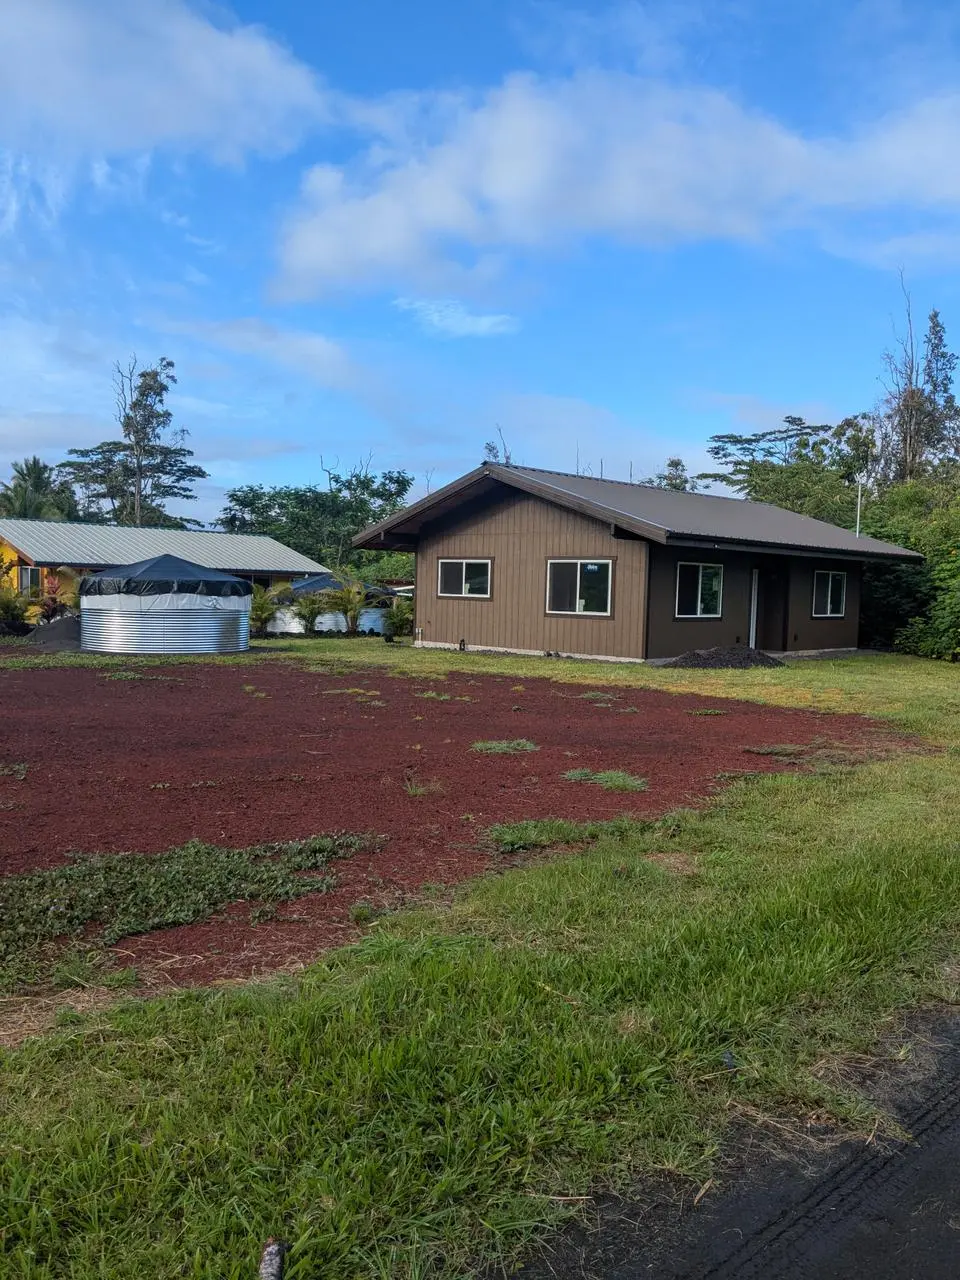
12-7003 Kehauopuna St · Seaview, HI
Flood risk 1/10 · Minimal
- FEMA flood zone
- X (unshaded)
- Chance of flooding over 30 yrs
- 0.0%
- Est. flood insurance / yr
- $507 – $1,088
Fire risk No data
- Est. fire insurance / yr
- —
Heat risk No data
- Hot days now (above threshold)
- —
- Hot days in 30 yrs
- —
Wind risk No data
- Chance of severe wind over 30 yrs
- —
Air-quality risk 1/10 · Minimal
- Unhealthy air days now
- —
- Unhealthy air days in 30 yrs
- —
Risk factors via First Street. Map © Google.
Why this score? — see what drove the D grade
The composite is a weighted blend of 9 inputs, each scored 0–100. Each bar is that input's sub-score; the figure is the points it added to the 100-point composite (weight × sub-score).
- ARV discount +15.0/15.0
- Cash flow +8.9/30.0
- Schools +3.7/10.0
- 1% rule +2.8/10.0
- DSCR +2.5/10.0
- Rent growth +2.5/5.0
- Livability +2.5/5.0
- Condition / age +2.5/5.0
- Appreciation +0.0/10.0
$270,000
🖨 Deal sheet (PDF) 📄 Offer letter ✓ Due diligence
Listing remarks MLS
Brand-New Home located in Sunny Kalapana Seaview Estates! This one bedroom 804 sqft. home feels spacious inside and out built on an oversized corner lot. High ceilings with large rafter beams and cedar walls make this home feel warm and cozy! Plenty of upper loft storage built in. Make this home your Puna Gem!
Key facts
- Oversized corner lot
- Cedar walls
- Upper loft storage
Tags
Neighborhood map
What this means for you Summary
Snapshot
- This is a 1-bed/1.0-bath single-family listed at $270k.
Deal economics
- At list price, monthly cash flow is $-215 ($-3k/yr) — negative.
- To cash-flow at today's rent, offer at most $239k (11.5% below list).
- To meet the 1% rule (rent ≥ 1% of price), the offer needs to be $210k (22.2% below list).
- Recommended offer: $210k (22.2% below list) — sets the bar for 1% rule.
Location & tenants
- Location reads: area grade D — affects rentability + tenant quality, not the cash-flow math above.
- Hawaii Department Of Education (suburban): math 32% / reading 50% proficiency, ranked #1 of 1 in HI (top 100%) — families likely to look elsewhere, expect single-tenant / working-renter base with shorter leases.
- Zoned schools: Pahoa Elementary School (math 12% / reading 22%, grade F, #166 of 183 statewide, top 92%, 377 students, 80% FRL); Pahoa High & Intermediate School (math 17% / reading 42%, grade F, #35 of 43 statewide, top 86%, 723 students, 74% FRL) — zoned schools average 77% FRL vs 39% district-wide (38 pts higher); higher-poverty schools than district average — tighter screening recommended.
- Zoned-school proficiency averages 23% at this address vs 41% district-wide (-18 pts) — the specific schools serving this property underperform the Hawaii Department Of Education average; the district grade overstates school quality for this exact location.
- Market conditions: 388 active listings in the ZIP; 1 comparable units currently listed for rent nearby; 982 units permitted in Hawaii County in 2024 (0 in 5+ unit buildings).
Forward outlook
- Local home prices are declining (-3.0%/yr); year-one equity from $2k of loan paydown is wiped out by about $8k of value loss. Plan a longer hold.
- Hawaii County population projected at +24% by 2050 — long-run rental-demand tailwind backs the buy-and-hold thesis.
Negotiation context
- It's been on market 152 days — a 12% lower offer ($238k) is reasonable based on typical stale-listing flexibility.
- 3 sale attempts since 2y ago; this cycle's ask has dropped $35k (11%) from the opening price — seller is motivated, your offer sets the floor, not the list.
Questions for the listing agent
- What do current leases actually rent for vs. the listed asking? Can we see a recent rent roll and the last 12 months of T-12 income?
- It's been on market 152 days. Have you received any prior offers? Is the seller open to a 22% concession, seller financing, or rate buy-down credit?
- What does the HOA fee cover, when was the last increase, and are there any pending special assessments or reserve-fund shortfalls?
- Why hasn't it sold? Are there any deal-killer items the seller is aware of (foundation, flood, title, zoning, code violations)?
- Is there a deadline driving the sale (1031 exchange, divorce, estate, relocation)? That informs how much negotiation room exists.
- The area grade is low — what's the realistic commute time and amenity access for the typical tenant pool here? Any planned neighborhood developments (good or bad) we should know about?
- What's the average days-on-market for RENTAL listings here right now (not sales)? A rising rental-DOM trend means longer vacancies and softer asking-rent achievability than the comps imply.
- What's the recent tenant-quality profile in this submarket — average credit score on applications, eviction rate, late-payment / NSF rate, and stable-employment percentage? A property-management company in the area should have these aggregated.
- How much new for-sale + rental construction is in the pipeline within 1–3 miles? Heavy new supply typically softens prices + rents 12–24 months out; constrained supply supports both.
Investment metrics
- 1% rule
- 0.78% ✗
- Cap rate
- 5.34%
- Cash-on-cash
- -3.41%
- DSCR
- 0.85
- GRM
- 10.7
CMA / ARV
- ARV (median comp)
- $376,144
- List price
- $270,000
- Delta
- -28.22%
- Verdict
- UNDERPRICED
- Comps
- 2 within 1.0 mi
Projected returns pro-forma
-3.0% appreciation · 3.0% rent growth · sell at horizon
- IRR
- -22.0%
- Equity multiple
- 0.24×
- Total profit
- $-57,403
- Equity at exit
- $40,258
- IRR
- -15.9%
- Equity multiple
- 0.11×
- Total profit
- $-67,462
- Equity at exit
- $23,345
Cash invested: $75,600 (down + closing). Projections, not guarantees.
Landlord ↔ Tenant lean methodology
- Overall (STATE)
- 37 Tenant-Leaning
- State Hawaii
- 37 Tenant-Leaning · D+13
- County
- — inherits STATE
- City
- — inherits STATE
ZIP-level market 96778
- Home prices YoY
- -15.3%
- Active inventory
- 388
- Price-to-rent
- 10.7×
Monthly cashflow live
- Estimated rent
- $2,100 medium interval (Pro) →
- Mortgage (P&I)
- −$1,416
- Tax est. 1.5%
- −$338 /mo · $4,050/yr
- Insurance
- −$112
- HOA
- −$8
- Vacancy / Maint / Mgmt
- −$441
- Net cashflow
- $-215
Break-even live
Sensitivity live
| Price | -10% $-28 | -5% $-122 | +0% $-215 | +5% $-308 | +10% $-402 |
|---|---|---|---|---|---|
| Rent | -10% $-381 | -5% $-298 | +0% $-215 | +5% $-132 | +10% $-49 |
| Rate | -1.0pp $-79 | -0.5pp $-146 | base $-215 | +0.5pp $-285 | +1.0pp $-356 |
UW: 25.0% down · 7.5% · 30yr · 1.5% tax · 5.0% vac · 8.0% maint · 8.0% mgmt
Financing live
Cash to close
- Down payment
- $67,500
- Closing costs
- $8,100
- Reserves months
- —
- Total cash needed
- —
Loan-product check · same deal, 3 products live
Conventional
25% down · 7.5% · 30yr
- Down + closing
- —
- Monthly P&I
- —
- Monthly cashflow
- —
- DSCR
- —
- Eligible?
- —
Personal DTI + credit; lowest rate.
DSCR
20% down · 8.5% · 30yr
- Down + closing
- —
- Monthly P&I
- —
- Monthly cashflow
- —
- DSCR
- —
- Eligible?
- —
No personal income docs; deal must DSCR.
Hard money
10% down · 12.0% · 12mo
- Down + closing
- —
- Monthly P&I
- —
- Monthly cashflow
- —
- DSCR
- —
- Eligible?
- —
Short-term bridge; refi at stabilization.
Rent comps 1 comps
| Address | Beds | Baths | Sqft | Rent | $/sqft | DOM | Units | Dist |
|---|---|---|---|---|---|---|---|---|
| 12-124 W Moanauli Loop Pahoa, HI | 2.0 | 1.5 | 900 | $2,100 | $2.33 | 45d | 1 | 0.67mi |
HOA detail
- Monthly dues
- $8 · $96/yr
Listing history 23 events
-
2026-06-21days on market $270,000 Active 152 DOM
-
2026-06-18days on market $270,000 Active 149 DOM
-
2026-06-17days on market $270,000 Active 148 DOM
-
2026-06-16days on market $270,000 Active 147 DOM
-
2026-06-15days on market $270,000 Active 146 DOM
-
2026-06-13days on market $270,000 Active 144 DOM
-
2026-06-13days on market $270,000 Active 143 DOM
-
2026-06-10days on market $270,000 Active 141 DOM
-
2026-06-09days on market $270,000 Active 140 DOM
-
2026-06-08days on market $270,000 Active 139 DOM
-
2026-06-07days on market $270,000 Active 138 DOM
-
2026-06-05days on market $270,000 Active 135 DOM
-
2026-06-03days on market $270,000 Active 134 DOM
-
2026-06-02days on market $270,000 Active 133 DOM
-
2026-06-01days on market $270,000 Active 132 DOM
-
2026-05-31days on market $270,000 Active 131 DOM
-
2026-02-17price $270,000 311-char remark
Show marketing remark (311 chars)
Brand-New Home located in Sunny Kalapana Seaview Estates! This one bedroom 804 sqft. home feels spacious inside and out built on an oversized corner lot. High ceilings with large rafter beams and cedar walls make this home feel warm and cozy! Plenty of upper loft storage built in. Make this home your Puna Gem!
-
2026-02-13historical
-
2026-01-20$305,000 Active 311-char remark
Show marketing remark (311 chars)
Brand-New Home located in Sunny Kalapana Seaview Estates! This one bedroom 804 sqft. home feels spacious inside and out built on an oversized corner lot. High ceilings with large rafter beams and cedar walls make this home feel warm and cozy! Plenty of upper loft storage built in. Make this home your Puna Gem!
-
2025-12-21historical
-
2025-05-29$350,000 Active
-
2024-07-08historical
-
2024-06-27$175,000 Active
ⓘ Source: listings_history table (triggers on properties + properties_extension) + one-shot
backfill from property_details.listing_events for pre-trigger history.
Climate risk First Street
- Flood 1/10 Low FEMA zone X (unshaded) · 0% chance over 30 yrs
- Air quality 1/10 Low
Nearby sold comps map
Loading sold comps map…
Walkable amenities ~0.75 mi
Loading nearby amenities…
Taxation est. · year 1
- Rental income
- $25,200
- − Mortgage interest
- −$15,124
- − Property taxes
- −$4,050
- − Insurance
- −$1,350
- − Repairs & maintenance
- −$2,016
- − Management
- −$2,016
- − HOA
- −$96
- − Depreciation
- −$7,855
- Taxable loss
- −$7,307
- Est. tax savings @ 24.0%
- +$1,754
- After-tax cash flow
- $-825/yr
For passive investors: Depreciation is non-cash, so a rental often shows a tax loss while cash-flowing — sheltering income. Rental losses are passive: they offset passive income freely, and up to $25,000/yr can offset ordinary (W-2) income if you actively participate and your MAGI is under $100k (phasing out to $0 by $150k); unused losses carry forward. On sale, claimed depreciation is recaptured at up to 25%, and gains may owe capital-gains tax (a 1031 exchange can defer both). Figures are a year-1 estimate at your 24.0% rate — not tax advice; consult a CPA.
Schools (NCES district)
- District
- Hawaii Department Of Education
- NCES district ID
- 1500030
- Math proficiency
- 32% ▼ -10.00%
- Reading proficiency
- 50% ▼ -3.00%
- Median HH income
- $69,005
- Composite
- 37.07/100
- National rank
- #4504
- State rank
- #1 of 1 in HI
Livability — Seaview
No livability data for this city. (Only ~50 U.S. cities are tracked.)
Census & demographics
- Census place
- Seaview, HI
- Population (ZIP)
- 14,225
Population outlook (Hawaii County) Hauer SSP2
- Today (2025)
- 220,733 people
- By 2030
- 232,156 · +5.2%
- By 2040
- 252,486 · +14.4%
- By 2050
- 272,703 · +23.5%
- By 2075
- 332,113 · +50.5%
- By 2100
- 398,342 · +80.5%
Race, ethnicity, and origin ACS 2023
- Neighborhood character
- Highly diverse neighborhood (Simpson 0.82)
- Race & ethnicity
- White 37% Two or more races 30% Hispanic / Latino 15% Pacific Islander 15% Asian 12%
- Hispanic origin (detail)
- Mexican 4% Puerto Rican 9%
- Common ancestry
- Russian 7% Italian 3% Romanian 3%
- Foreign-born
- 12% · Canada, Vietnam
- Languages at home
- 77% English-only · Other Asian/Pacific 11% Tagalog/Filipino 1% Russian/Polish/Slavic 1%
Political lean MEDSL · Hawaii
- 2024 margin
- Strong D (+28.3) · D 63.0% · R 34.7% · Other 2.3%
- 2008→2024 swing
- -25.4pp toward R · 2008: 53.7pp · 2024: 28.3pp
- All cycles
- 2024: D+28.3 2020: D+36.2 2016: D+36.6 2012: D+51.3 2008: D+53.7
Not yet ingested
- Civics
- —
Market trends
- HPI YoY
- ▼ -31.52%
- Current HPI
- 173.8168
- Rent YoY
- —
- Metro
- —
- State GDP YoY
- —
- F500 in state
- 0
Price history
+54.3% since first listed7 events — show timeline
- 2026-02-17 Price Changed $270,000 HI Information Service
- 2026-02-13 Listing Removed — HI Information Service
- 2026-01-20 Listed $305,000 HI Information Service
- 2025-12-21 Listing Removed — HI Information Service
- 2025-05-29 Listed $350,000 HI Information Service
- 2024-07-08 Listing Removed — HI Information Service
- 2024-06-27 Listed $175,000 HI Information Service
Cash-flow waterfall
monthlySold comps — $/sqft
last 12 mo · ≤1 miLoading sold comps…