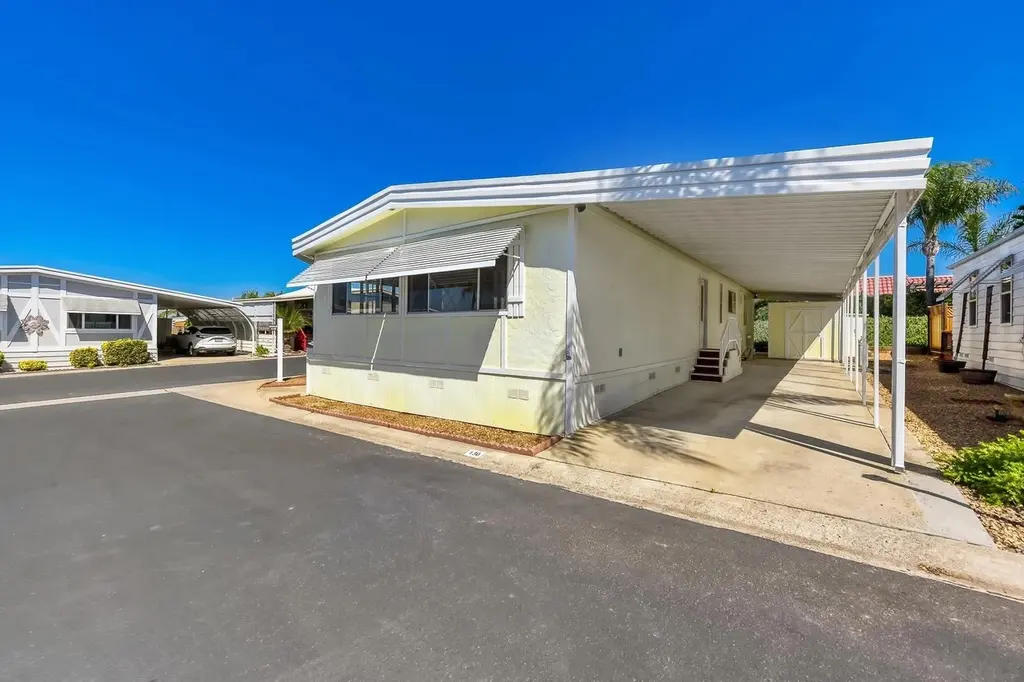
1212 H St #130 · Ramona, CA
Flood risk 1/10 · Minimal
- FEMA flood zone
- X (unshaded)
- Chance of flooding over 30 yrs
- 0.0%
- Est. flood insurance / yr
- $507 – $1,088
Fire risk 9/10 · Severe
- Est. fire insurance / yr
- $659 – $1,223
Heat risk 5/10 · Moderate
- Hot days now (above 98°F)
- 6 days/yr
- Hot days in 30 yrs
- 16 days/yr
Wind risk 1/10 · Minimal
- Chance of severe wind over 30 yrs
- —
Air-quality risk 5/10 · Moderate
- Unhealthy air days now
- 8 days/yr
- Unhealthy air days in 30 yrs
- 9 days/yr
Risk factors via First Street. Map © Google.
Why this score? — see what drove the B+ grade
The composite is a weighted blend of 9 inputs, each scored 0–100. Each bar is that input's sub-score; the figure is the points it added to the 100-point composite (weight × sub-score).
- Cash flow +30.0/30.0
- ARV discount +11.1/15.0
- 1% rule +10.0/10.0
- DSCR +10.0/10.0
- Schools +4.3/10.0
- Condition / age +3.8/5.0
- Livability +3.2/5.0
- Rent growth +2.9/5.0
- Appreciation +0.0/10.0
$159,000
🖨 Deal sheet (PDF) 📄 Offer letter ✓ Due diligence
Listing remarks
This beautifully updated triple-wide mobile home in the desirable Ramona Terrace Community offers a rare combination of modern upgrades and an ideal location. Spanning 1,660 square feet, this 2-bedroom, 2-bathroom residence sits on a prime corner lot directly next to the clubhouse, providing immediate access to visitor parking and community activities. Move in with total peace of mind thanks to a professionally installed new roof, new window screens, and a new garbage disposal. On the interior, you’ll experience a fresh, cohesive look with new laminate flooring, updated baseboards, and some professional interior painting . The heart of the kitchen features a new cooktop and dishwasher
Key facts
- New garbage disposal
- Modern upgrades
- New window screens
Tags
Property features AI
Finance
- HOA & community: Community pool / association amenities
Exterior
- Parking: 2 parking spaces
- Utilities: Public sewer
- Home design: Manufactured home; Single-story; Residential property; Located in Ramona Terrace Community (senior community)
- Construction: Aluminum siding; Composition roof
- Exterior features: Covered patio/porch; Deck; Community pool; Shed(s)
Interior
- Kitchen: Dishwasher; Disposal; Electric oven; Propane cooktop
- Bedrooms: 2 possible bedrooms
- Flooring: Laminate; Tile
- Bathrooms: 2 full bathrooms
- Heating & cooling: Forced air heating (propane); Central air conditioning
- Interior features: Ceiling fan(s)
- Laundry & utility: Gas water heater
Neighborhood map
What this means for you Summary
Snapshot
- This is a 2-bed/2.0-bath manufactured listed at $159k. Condition is rated good.
Deal economics
- At list price, monthly cash flow is $1k ($13k/yr) — positive.
- The deal already cash-flows at list — no discount required.
- Meets the 1% rule at list price ($3k rent vs $159k).
- Cap rate 14.6% vs local median 2.1% in Ramona — top-decile yield for the area; either an underpriced asset or a hidden risk that comps aren't pricing in. Stress-test before assuming the spread holds.
Location & tenants
- Location reads 65/100 on livability (#374 in CA) — a middle-class / working-renter tenant base. Strengths: employment A, commute B+; Watch: amenities C-, crime D+, schools D.
- Ramona City Unified (town): math 32% / reading 63% proficiency, ranked #144 of 517 in CA (top 28%) — families likely to look elsewhere, expect single-tenant / working-renter base with shorter leases.
- Market conditions: Rents rising (+1.7%/yr); 176 active listings in the ZIP; 9 comparable units currently listed for rent nearby; rentals leasing fast (median 11d on market — plan ~1-2 weeks tenant-placement turnaround); high-income renter base; 11,759 units permitted in San Diego County in 2024 (7,244 in 5+ unit buildings).
Forward outlook
- Local home prices are declining (-3.0%/yr); year-one equity from $1k of loan paydown is wiped out by about $5k of value loss. Plan a longer hold.
- San Diego County population projected at +20% by 2050 — long-run rental-demand tailwind backs the buy-and-hold thesis.
- At projected returns (-3.0% appreciation + 1.7% rent growth), your $45k cash investment doubles in ~5 years — after that, you're playing with house money.
Negotiation context
- Only 13 days on market — expect competitive offers; lowballing is unlikely to land.
Risks & watch-outs
- Climate carrying-cost: severe wildfire risk; extreme-heat days projected 6→16/yr by 2055 (HVAC capex compounding) — expect insurance premiums to compound above CPI over the hold.
Questions for the listing agent
- Built in 1976 — when were the roof, HVAC, electrical panel, plumbing, and water heater last replaced?
- Is there a deadline driving the sale (1031 exchange, divorce, estate, relocation)? That informs how much negotiation room exists.
- Schools are D-rated, which usually means shorter tenancies and higher turnover. Who's the typical renter profile here, and what's been the actual vacancy rate?
- Crime grade is D in this area — have there been break-ins, vandalism, or insurance claims at this property in the last 3 years? What carrier currently insures it and at what premium?
- What's the average days-on-market for RENTAL listings here right now (not sales)? A rising rental-DOM trend means longer vacancies and softer asking-rent achievability than the comps imply.
- What's the recent tenant-quality profile in this submarket — average credit score on applications, eviction rate, late-payment / NSF rate, and stable-employment percentage? A property-management company in the area should have these aggregated.
- How much new for-sale + rental construction is in the pipeline within 1–3 miles? Heavy new supply typically softens prices + rents 12–24 months out; constrained supply supports both.
Investment metrics
- 1% rule
- 1.75% ✓
- Cap rate
- 14.55%
- Cash-on-cash
- 29.50%
- DSCR
- 2.31
- GRM
- 4.8
CMA / ARV
- ARV (on-the-fly)
- $172,640
- Comps found
- 7
Show comp detail 7 sales within ~0.75 mi
| Address | Dist | Beds/Ba | Sqft | Sold | Price | $/sf | Match |
|---|---|---|---|---|---|---|---|
| 1212 H St #48 | 0.07mi | 2/2.0 | 1,640 (-1%) | 3mo | $168,000 | $102 | 92 |
| 1212 H St #202 | 0.07mi | 2/2.0 | 1,744 (+5%) | 0mo | $181,000 | $104 | 88 |
| 1212 H St #139 | 0.00mi | 2/2.0 | 1,512 (-9%) | 9mo | $251,000 | $166 | 78 |
| 1212 H St #157 | 0.07mi | 2/2.0 | 1,440 (-13%) | 4mo | $150,000 | $104 | 72 |
| 1212 H St #5 | 0.07mi | 2/2.0 | 1,440 (-13%) | 14mo | $115,000 | $80 | 63 |
| 1212 H St #113 | 0.00mi | 2/2.0 | 1,434 (-14%) | 21mo | $150,000 | $105 | 59 |
| 1537 H St Spc 30 | 0.36mi | 2/2.0 | 1,440 (-13%) | 3mo | $115,000 | $80 | 59 |
Match score weights: distance 35% · size 25% · config 20% · recency 20%. Top-matched comps best support the ARV.
Projected returns pro-forma
-3.0% appreciation · 1.71% rent growth · sell at horizon
- IRR
- 22.5%
- Equity multiple
- 1.91×
- Total profit
- $40,417
- Equity at exit
- $23,707
- IRR
- 29.7%
- Equity multiple
- 3.49×
- Total profit
- $110,887
- Equity at exit
- $13,747
Cash invested: $44,520 (down + closing). Projections, not guarantees.
Landlord ↔ Tenant lean methodology
- Overall (STATE)
- 18 Strongly Tenant-Friendly
- State California
- 18 Strongly Tenant-Friendly · D+13
- County
- — inherits STATE
- City
- — inherits STATE
ZIP-level market 92065
- Rents YoY
- 1.7%
- Active inventory
- 176
- Price-to-rent
- 4.8×
Monthly cashflow live
- Estimated rent
- $2,776 high interval (Pro) →
- Mortgage (P&I)
- −$834
- Tax est. 1.5%
- −$199 /mo · $2,385/yr
- Insurance
- −$66
- HOA
- −$0
- Vacancy / Maint / Mgmt
- −$583
- Net cashflow
- $1,094
Break-even live
Sensitivity live
| Price | -10% $1,204 | -5% $1,149 | +0% $1,094 | +5% $1,039 | +10% $984 |
|---|---|---|---|---|---|
| Rent | -10% $875 | -5% $985 | +0% $1,094 | +5% $1,204 | +10% $1,314 |
| Rate | -1.0pp $1,174 | -0.5pp $1,135 | base $1,094 | +0.5pp $1,053 | +1.0pp $1,011 |
UW: 25.0% down · 7.5% · 30yr · 1.5% tax · 5.0% vac · 8.0% maint · 8.0% mgmt
Financing live
Cash to close
- Down payment
- $39,750
- Closing costs
- $4,770
- Reserves months
- —
- Total cash needed
- —
Loan-product check · same deal, 3 products live
Conventional
25% down · 7.5% · 30yr
- Down + closing
- —
- Monthly P&I
- —
- Monthly cashflow
- —
- DSCR
- —
- Eligible?
- —
Personal DTI + credit; lowest rate.
DSCR
20% down · 8.5% · 30yr
- Down + closing
- —
- Monthly P&I
- —
- Monthly cashflow
- —
- DSCR
- —
- Eligible?
- —
No personal income docs; deal must DSCR.
Hard money
10% down · 12.0% · 12mo
- Down + closing
- —
- Monthly P&I
- —
- Monthly cashflow
- —
- DSCR
- —
- Eligible?
- —
Short-term bridge; refi at stabilization.
Rent comps 9 comps
| Address | Beds | Baths | Sqft | Rent | $/sqft | DOM | Units | Dist |
|---|---|---|---|---|---|---|---|---|
| 531 16th St Ramona, CA | 2.0–3.0 | 2.0 | 1341 | $2,750 | $2.05 | 0d | 3 | 0.52mi |
| 531 16th St Ramona, CA | 2.0–3.0 | 2.0 | 1342 | $2,750 | $2.05 | 11d | 2 | 0.52mi |
| 1035 7th St Ramona, CA | 3.0 | 2.0 | 1500 | $3,700 | $2.47 | 16d | 1 | 0.58mi |
| 623 E St Ramona, CA | 2.0 | 2.0 | 1100 | $2,700 | $2.45 | 4d | 1 | 0.75mi |
| 1742 Paseo Ct Ramona, CA | 3.0 | 2.5 | 1527 | $3,395 | $2.22 | 0d | 1 | 0.79mi |
| 121 N Ramona St Ramona, CA | 2.0–3.0 | 2.0 | 990 | $2,089 | $2.11 | 0d | 3 | 0.83mi |
| 337 D St Ramona, CA | 2.0 | 2.0 | 1050 | $3,150 | $3.00 | 45d | 1 | 1.05mi |
| 331 D St Ramona, CA | 2.0 | 2.0 | 1050 | $3,150 | $3.00 | 45d | 1 | 1.05mi |
| 327 D St Ramona, CA | 2.0 | 2.0 | 1050 | $3,150 | $3.00 | 45d | 1 | 1.05mi |
Listing history 9 events
-
2026-06-21days on market $159,000 Active 13 DOM
-
2026-06-18days on market $159,000 Active 10 DOM
-
2026-06-17days on market $159,000 Active 9 DOM
-
2026-06-16days on market $159,000 Active 8 DOM
-
2026-06-15days on market $159,000 Active 7 DOM
-
2026-06-13days on market $159,000 Active 5 DOM
-
2026-06-13days on market $159,000 Active 4 DOM
-
2026-06-09remarks 693-char remark
-
2026-06-09$159,000 Active 1 DOM
ⓘ Source: listings_history table (triggers on properties + properties_extension) + one-shot
backfill from property_details.listing_events for pre-trigger history.
Climate risk First Street
- Flood 1/10 Low FEMA zone X (unshaded) · 0% chance over 30 yrs
- Wildfire 9/10 Extreme
- Heat 5/10 Major 6 d/yr ≥98°F today · 16 d/yr by 30 yrs out
- Wind 1/10 Low
- Air quality 5/10 Major 8 unhealthy d/yr today · 9 by 30 yrs out
Nearby sold comps map
Loading sold comps map…
Walkable amenities ~0.75 mi
Loading nearby amenities…
Taxation est. · year 1
- Rental income
- $33,313
- − Mortgage interest
- −$8,906
- − Property taxes
- −$2,385
- − Insurance
- −$795
- − Repairs & maintenance
- −$2,665
- − Management
- −$2,665
- − Depreciation
- −$4,625
- Taxable income
- $11,271
- Est. tax owed @ 24.0%
- −$2,705
- After-tax cash flow
- $10,427/yr
For passive investors: Depreciation is non-cash, so a rental often shows a tax loss while cash-flowing — sheltering income. Rental losses are passive: they offset passive income freely, and up to $25,000/yr can offset ordinary (W-2) income if you actively participate and your MAGI is under $100k (phasing out to $0 by $150k); unused losses carry forward. On sale, claimed depreciation is recaptured at up to 25%, and gains may owe capital-gains tax (a 1031 exchange can defer both). Figures are a year-1 estimate at your 24.0% rate — not tax advice; consult a CPA.
Condition & rehab AI · 12 photos
This beautifully updated triple-wide mobile home in Ramona Terrace Community is move-in ready with new kitchen appliances, flooring, and paint. It offers a rare combination of modern upgrades and an ideal location.
Value-add opportunities
- Resale new kitchen appliances — upgrades the kitchen and adds value
- Resale new flooring — enhances the home's appearance and adds value
- Resale new paint — fresh paint improves curb appeal and adds value
Renovation cost estimate screening
Value-add ROI direction
- Resale new kitchen appliances — upgrades the kitchen and adds value ↑
- Resale new flooring — enhances the home's appearance and adds value ↑
- Resale new paint — fresh paint improves curb appeal and adds value ↑
ⓘ Cost ranges are severity-bucket heuristics (US national rule-of-thumb). Get contractor quotes + a written scope before underwriting a rehab budget.
Schools (NCES district)
- District
- Ramona City Unified
- NCES district ID
- 0631710
- Math proficiency
- 32% ▼ -6.00%
- Reading proficiency
- 63% ▲ 10.00%
- Median HH income
- $79,226
- Composite
- 43.38/100
- National rank
- #3023
- State rank
- #144 of 517 in CA
Livability — Ramona
- Score
- 65/100
- State rank
- #374
- US rank
- #12777
Category grades
Schools grade is shown separately in the Schools card above.
Census & demographics
- Census place
- Ramona, CA
- County
- San Diego County · 3,178,799 people
- City population
- 36,752
- Metro
- San Diego-Chula Vista-Carlsbad, CA
- Population (ZIP)
- 36,752
- Household income
- $125,285
- Rent vs Own
- Severe rent burden
- 850.0
Population outlook (San Diego County) Hauer SSP2
- Today (2025)
- 3,678,185 people
- By 2030
- 3,856,546 · +4.8%
- By 2040
- 4,171,407 · +13.4%
- By 2050
- 4,421,607 · +20.2%
- By 2075
- 4,831,599 · +31.4%
- By 2100
- 4,832,502 · +31.4%
Race, ethnicity, and origin ACS 2023
- Neighborhood character
- Majority White (61%)
- Race & ethnicity
- White 61% Hispanic / Latino 31% Two or more races 18% Asian 2%
- Hispanic origin (detail)
- Mexican 27%
- Common ancestry
- Lithuanian 3% Italian 2% Slovak 2%
- Foreign-born
- 12% · Canada
- Languages at home
- 76% English-only · Spanish 21% Other Indo-European 1%
Political lean MEDSL · San Diego
- 2024 margin
- D (+16.8) · D 56.9% · R 40.1% · Other 2.9%
- 2008→2024 swing
- +6.6pp toward D · 2008: 10.2pp · 2024: 16.8pp
- All cycles
- 2024: D+16.8 2020: D+22.8 2016: D+17.8 2012: D+5.1 2008: D+10.2
Not yet ingested
- Civics
- —
Market trends
- HPI YoY
- ▼ -595.55%
- Current HPI
- 301.465
- Rent YoY
- ▲ 1.71%
- Metro
- San Diego-Chula Vista-Carlsbad, CA
- State GDP YoY
- ▲ 3.21%
- F500 in state
- 116
Industry mix (Fortune 500 HQ in CA)
| Industry | F500 HQs | Revenue |
|---|---|---|
| Technology | 27 | $1,492B |
|
||
| Financial Services | 3 | $174B |
|
||
| Retail | 3 | $44B |
|
||
| Insurance | 3 | $26B |
|
||
| Media / Entertainment | 2 | $115B |
|
||
| Pharmaceuticals / Biotech | 2 | $62B |
|
||
Price history
1 event — show timeline
- 2026-06-08 Listed $159,000 SDMLS
Cash-flow waterfall
monthlySold comps — $/sqft
last 12 mo · ≤1 miLoading sold comps…