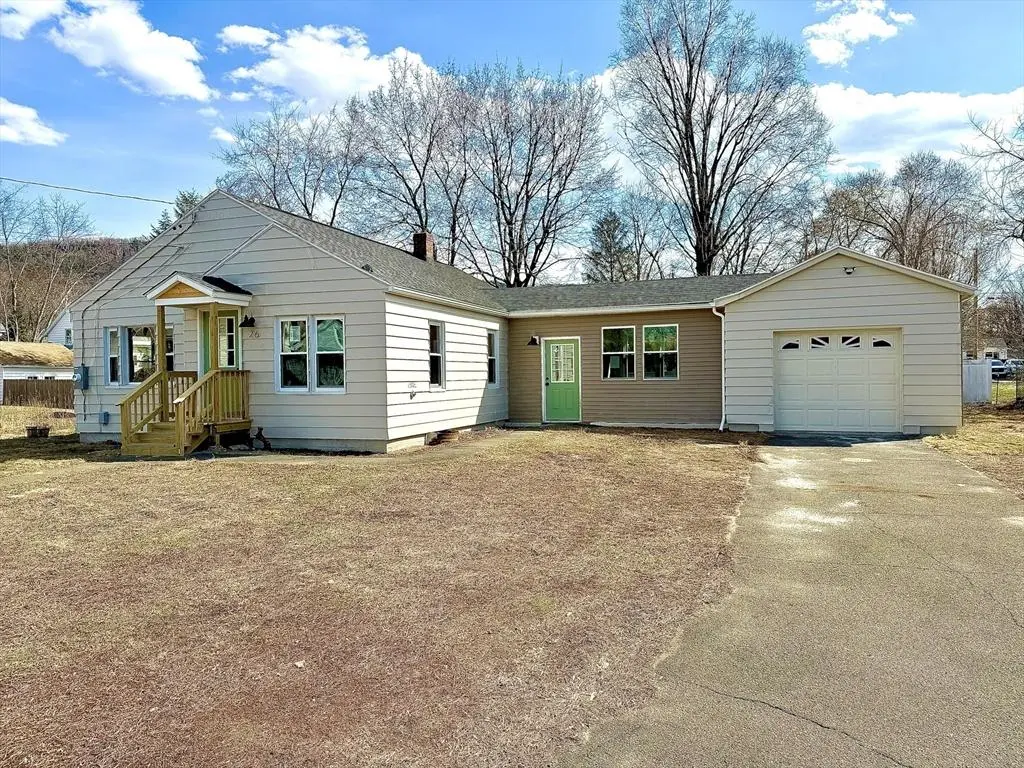
26 Mt. Tom Ave · Easthampton, MA
Flood risk 1/10 · Minimal
- FEMA flood zone
- X
- Chance of flooding over 30 yrs
- 0.0%
- Est. flood insurance / yr
- $507 – $1,088
Fire risk 2/10 · Minimal
- Est. fire insurance / yr
- $915 – $1,699
Heat risk 4/10 · Minor
- Hot days now (above 96°F)
- 7 days/yr
- Hot days in 30 yrs
- 18 days/yr
Wind risk 4/10 · Minor
- Chance of severe wind over 30 yrs
- 19.0%
Air-quality risk 2/10 · Minimal
- Unhealthy air days now
- 1 days/yr
- Unhealthy air days in 30 yrs
- 1 days/yr
Risk factors via First Street. Map © Google.
Why this score? — see what drove the D grade
The composite is a weighted blend of 9 inputs, each scored 0–100. Each bar is that input's sub-score; the figure is the points it added to the 100-point composite (weight × sub-score).
- ARV discount +15.0/15.0
- Cash flow +12.0/30.0
- DSCR +3.5/10.0
- Schools +3.2/10.0
- 1% rule +2.7/10.0
- Rent growth +2.5/5.0
- Livability +2.5/5.0
- Condition / age +2.5/5.0
- Appreciation +0.0/10.0
$375,000
🖨 Deal sheet 📄 Offer letter ✓ Due diligence
Listing remarks MLS
If you’ve been waiting for something special in Easthampton, this is it. This fully renovated 3-bedroom, 1-bath home offers 1,264 sq ft of well-designed living space near the base of Mount Tom on the quiet Easthampton side. The setting is peaceful and scenic.Inside features a brand new kitchen and bathrooms, polished floors, updated electrical, plumbing, and heating, plus new windows and doors. The finished, carpeted basement adds valuable bonus space. The layout is open, clean, and comfortable.Outside includes an oversized 2–3 car garage and a solid yard with room to enjoy. The location offers privacy while staying close to local amenities.Homes in this area rarely come up and move quickly. Book your showings today!
Key facts
- Fully renovated
- Privacy location
- Brand new kitchen
Tags
Neighborhood map
What this means for you Summary
Snapshot
- This is a 2-bed/1.5-bath single-family listed at $375k.
Deal economics
- At list price, monthly cash flow is $-92 ($-1k/yr) — negative.
- To cash-flow at today's rent, offer at most $359k (4.3% below list).
- To meet the 1% rule (rent ≥ 1% of price), the offer needs to be $287k (23.5% below list).
- Recommended offer: $287k (23.5% below list) — sets the bar for 1% rule.
Location & tenants
- Location reads: area grade D — affects rentability + tenant quality, not the cash-flow math above.
- Easthampton (suburban): math 27% / reading 47% proficiency, ranked #219 of 302 in MA (top 72%) — families likely to look elsewhere, expect single-tenant / working-renter base with shorter leases.
- Market conditions: 22 active listings in the ZIP; 349 units permitted in Hampshire County in 2024 (185 in 5+ unit buildings).
Forward outlook
- Local home prices are declining (-3.0%/yr); year-one equity from $3k of loan paydown is wiped out by about $11k of value loss. Plan a longer hold.
- Hampshire County population projected at +5% by 2050 — modest demand growth; plan on rents tracking national, not racing it.
Negotiation context
- It's been on market 71 days — a 6% lower offer ($352k) is reasonable based on typical stale-listing flexibility.
- 2 sale attempts since 7y ago with the ask held roughly flat each time — persistent listings suggest the price (not the market) is what's stuck; bring a comps-based counter.
- Current owner paid $200k; list at $375k implies a 88% gain — meaningful room to come down on a strong offer.
Risks & watch-outs
- Watch-outs: built in 1920 — expect roof / HVAC / electrical / plumbing capex.
Questions for the listing agent
- What do current leases actually rent for vs. the listed asking? Can we see a recent rent roll and the last 12 months of T-12 income?
- It's been on market 71 days. Have you received any prior offers? Is the seller open to a 23% concession, seller financing, or rate buy-down credit?
- Built in 1920 — when were the roof, HVAC, electrical panel, plumbing, and water heater last replaced?
- Why hasn't it sold? Are there any deal-killer items the seller is aware of (foundation, flood, title, zoning, code violations)?
- Is there a deadline driving the sale (1031 exchange, divorce, estate, relocation)? That informs how much negotiation room exists.
- The area grade is low — what's the realistic commute time and amenity access for the typical tenant pool here? Any planned neighborhood developments (good or bad) we should know about?
- What's the average days-on-market for RENTAL listings here right now (not sales)? A rising rental-DOM trend means longer vacancies and softer asking-rent achievability than the comps imply.
- What's the recent tenant-quality profile in this submarket — average credit score on applications, eviction rate, late-payment / NSF rate, and stable-employment percentage? A property-management company in the area should have these aggregated.
- How much new for-sale + rental construction is in the pipeline within 1–3 miles? Heavy new supply typically softens prices + rents 12–24 months out; constrained supply supports both.
Investment metrics
- 1% rule
- 0.77% ✗
- Cap rate
- 6.00%
- Cash-on-cash
- -1.05%
- DSCR
- 0.95
- GRM
- 10.9
CMA / ARV
- ARV (median comp)
- $455,854
- List price
- $375,000
- Delta
- -17.74%
- Verdict
- UNDERPRICED
- Comps
- 20 within 1.0 mi
Show comp detail 7 sales within ~0.75 mi
| Address | Dist | Beds/Ba | Sqft | Sold | Price | $/sf | Match |
|---|---|---|---|---|---|---|---|
| 28 E Green St | 0.31mi | 2/1.0 | 1,004 (+4%) | 18mo | $375,000 | $374 | 62 |
| 48 Cherry St | 0.14mi | 2/1.0 | 1,036 (+8%) | 23mo | $425,000 | $410 | 60 |
| 7 Gaston St | 0.28mi | 3/1.0 (+1) | 883 (-8%) | 10mo | $376,000 | $426 | 57 |
| 2 Admiral St | 0.21mi | 3/1.0 (+1) | 1,085 (+13%) | 9mo | $351,000 | $324 | 55 |
| 23 East Maple St | 0.54mi | 3/1.0 (+1) | 984 (+2%) | 14mo | $415,000 | $422 | 53 |
| 51 Taft Ave | 0.75mi | 2/1.0 | 1,052 (+9%) | 10mo | $370,000 | $352 | 40 |
| 7 Keddy St | 0.58mi | 3/1.0 (+1) | 864 (-10%) | 17mo | $310,000 | $359 | 35 |
Match score weights: distance 35% · size 25% · config 20% · recency 20%. Top-matched comps best support the ARV.
Projected returns pro-forma
-3.0% appreciation · 3.0% rent growth · sell at horizon
- IRR
- -18.1%
- Equity multiple
- 0.36×
- Total profit
- $-66,704
- Equity at exit
- $55,914
- IRR
- -10.3%
- Equity multiple
- 0.37×
- Total profit
- $-66,007
- Equity at exit
- $32,423
Cash invested: $105,000 (down + closing). Projections, not guarantees.
Landlord ↔ Tenant lean methodology
- Overall (STATE)
- 20 Strongly Tenant-Friendly
- State Massachusetts
- 20 Strongly Tenant-Friendly · D+15
- County
- — inherits STATE
- City
- — inherits STATE
ZIP-level market 01027
- Active inventory
- 22
- Price-to-rent
- 10.9×
Monthly cashflow live
- Estimated rent
- $2,870 medium interval (Pro) →
- Mortgage (P&I)
- −$1,967
- Tax from tax record
- −$236 /mo · $2,832/yr
- Insurance
- −$156
- HOA
- −$0
- Vacancy / Maint / Mgmt
- −$603
- Net cashflow
- $-92
Break-even live
UW: 25.0% down · 7.5% · 30yr · 1.5% tax · 5.0% vac · 8.0% maint · 8.0% mgmt
Financing live
Cash to close
- Down payment
- $93,750
- Closing costs
- $11,250
- Reserves months
- —
- Total cash needed
- —
Loan-product check · same deal, 3 products live
Conventional
25% down · 7.5% · 30yr
- Down + closing
- —
- Monthly P&I
- —
- Monthly cashflow
- —
- DSCR
- —
- Eligible?
- —
Personal DTI + credit; lowest rate.
DSCR
20% down · 8.5% · 30yr
- Down + closing
- —
- Monthly P&I
- —
- Monthly cashflow
- —
- DSCR
- —
- Eligible?
- —
No personal income docs; deal must DSCR.
Hard money
10% down · 12.0% · 12mo
- Down + closing
- —
- Monthly P&I
- —
- Monthly cashflow
- —
- DSCR
- —
- Eligible?
- —
Short-term bridge; refi at stabilization.
Listing history 18 events
-
2026-06-18days on market $375,000 Active 71 DOM
-
2026-06-17days on market $375,000 Active 70 DOM
-
2026-06-16days on market $375,000 Active 69 DOM
-
2026-06-15days on market $375,000 Active 68 DOM
-
2026-06-14days on market $375,000 Active 66 DOM
-
2026-06-10days on market $375,000 Active 63 DOM
-
2026-06-09days on market $375,000 Active 62 DOM
-
2026-06-08days on market $375,000 Active 61 DOM
-
2026-06-07days on market $375,000 Active 60 DOM
-
2026-06-03days on market $375,000 Active 56 DOM
-
2026-06-02statusdays on market $375,000 Active 55 DOM
-
2026-06-01days on market $375,000 Back On Market 54 DOM
-
2026-05-31days on market $375,000 Back On Market 53 DOM
-
2026-05-30days on market $375,000 Back On Market 52 DOM
-
2026-05-16historical Contingent 738-char remark
Show marketing remark (738 chars)
If you’ve been waiting for something special in Easthampton, this is it. This fully renovated 3-bedroom, 1-bath home offers 1,264 sq ft of well-designed living space near the base of Mount Tom on the quiet Easthampton side. The setting is peaceful and scenic.Inside features a brand new kitchen and bathrooms, polished floors, updated electrical, plumbing, and heating, plus new windows and doors. The finished, carpeted basement adds valuable bonus space. The layout is open, clean, and comfortable.Outside includes an oversized 2–3 car garage and a solid yard with room to enjoy. The location offers privacy while staying close to local amenities.Homes in this area rarely come up and move quickly. Book your showings today!
-
2026-04-08$375,000 New 738-char remark
Show marketing remark (738 chars)
If you’ve been waiting for something special in Easthampton, this is it. This fully renovated 3-bedroom, 1-bath home offers 1,264 sq ft of well-designed living space near the base of Mount Tom on the quiet Easthampton side. The setting is peaceful and scenic.Inside features a brand new kitchen and bathrooms, polished floors, updated electrical, plumbing, and heating, plus new windows and doors. The finished, carpeted basement adds valuable bonus space. The layout is open, clean, and comfortable.Outside includes an oversized 2–3 car garage and a solid yard with room to enjoy. The location offers privacy while staying close to local amenities.Homes in this area rarely come up and move quickly. Book your showings today!
-
2019-06-03soldstatus $200,000 860-char remark
Show marketing remark (860 chars)
GOING - GOING - GONE is this 1950s ranch built for the ages. In the same family for over 60 years, you'll feel warm and welcome in this solidly built home. New architectural shingled roof, new high-efficiency Buderus heating system and HTP hot water tank, and brand new 100amp electrical panel and main service line. You'll enjoy original hardwood flooring throughout, including under the carpeted living room and bedroom. Are you more retro than contemporary? Looking value and convenience? You've found it all here! Full basement with good ceiling height, ideal for finishing. Spacious screened-in porch, attached one-car garage with Raynor door opener, and huge back and side yard with lots of space and Mt Tom views. Great location, convenient walk into downtown for shops, restaurants, schools and bike path and just a short drive to Northampton and I-91.
-
2019-04-02$209,900 860-char remark
Show marketing remark (860 chars)
GOING - GOING - GONE is this 1950s ranch built for the ages. In the same family for over 60 years, you'll feel warm and welcome in this solidly built home. New architectural shingled roof, new high-efficiency Buderus heating system and HTP hot water tank, and brand new 100amp electrical panel and main service line. You'll enjoy original hardwood flooring throughout, including under the carpeted living room and bedroom. Are you more retro than contemporary? Looking value and convenience? You've found it all here! Full basement with good ceiling height, ideal for finishing. Spacious screened-in porch, attached one-car garage with Raynor door opener, and huge back and side yard with lots of space and Mt Tom views. Great location, convenient walk into downtown for shops, restaurants, schools and bike path and just a short drive to Northampton and I-91.
ⓘ Source: listings_history table (triggers on properties + properties_extension) + one-shot
backfill from property_details.listing_events for pre-trigger history.
Tax reassessment forecast MA · Partial reset (capped growth)
- Current annual tax
- $2,832 · $236/mo
- Projected year-2 tax
- $3,722 · $310/mo
- Expected delta
- +$890/yr (+$74/mo · 31.4%)
ⓘ Screening estimate from a state-policy table — verify with the county assessor before closing.
Climate risk First Street
- Flood 1/10 Low FEMA zone X · 0% chance over 30 yrs
- Wildfire 2/10 Low
- Heat 4/10 Moderate 7 d/yr ≥96°F today · 18 d/yr by 30 yrs out
- Wind 4/10 Moderate 19% chance of damaging wind over 30 yrs
- Air quality 2/10 Low 1 unhealthy d/yr today · 1 by 30 yrs out
Nearby sold comps map
Loading sold comps map…
Walkable amenities ~0.75 mi
Loading nearby amenities…
Taxation est. · year 1
- Rental income
- $34,437
- − Mortgage interest
- −$21,006
- − Property taxes
- −$2,832
- − Insurance
- −$1,875
- − Repairs & maintenance
- −$2,755
- − Management
- −$2,755
- − Depreciation
- −$10,909
- Taxable loss
- −$7,695
- Est. tax savings @ 24.0%
- +$1,847
- After-tax cash flow
- $747/yr
For passive investors: Depreciation is non-cash, so a rental often shows a tax loss while cash-flowing — sheltering income. Rental losses are passive: they offset passive income freely, and up to $25,000/yr can offset ordinary (W-2) income if you actively participate and your MAGI is under $100k (phasing out to $0 by $150k); unused losses carry forward. On sale, claimed depreciation is recaptured at up to 25%, and gains may owe capital-gains tax (a 1031 exchange can defer both). Figures are a year-1 estimate at your 24.0% rate — not tax advice; consult a CPA.
Schools (NCES district)
- District
- Easthampton
- NCES district ID
- 2504590
- Math proficiency
- 27% ▼ -17.00%
- Reading proficiency
- 47% ▲ 3.00%
- Median HH income
- $55,625
- Composite
- 32.47/100
- National rank
- #5713
- State rank
- #219 of 302 in MA
Livability — Easthampton
No livability data for this city. (Only ~50 U.S. cities are tracked.)
Census & demographics
- Census place
- Easthampton Town, MA
- Population (ZIP)
- 17,678
Population outlook (Hampshire County) Hauer SSP2
- Today (2025)
- 166,577 people
- By 2030
- 168,928 · +1.4%
- By 2040
- 171,197 · +2.8%
- By 2050
- 175,542 · +5.4%
- By 2075
- 199,884 · +20.0%
- By 2100
- 211,819 · +27.2%
Race, ethnicity, and origin ACS 2023
- Neighborhood character
- Predominantly White (86%)
- Race & ethnicity
- White 86% Two or more races 9% Hispanic / Latino 8% Asian 1%
- Hispanic origin (detail)
- Puerto Rican 4% Dominican 1%
- Common ancestry
- Lithuanian 14% Romanian 13% Russian 2%
- Foreign-born
- 7% · Canada, Jamaica, China
- Languages at home
- 89% English-only · Spanish 5% Other Indo-European 2% German/W. Germanic 1%
Political lean MEDSL · Hampshire
- 2024 margin
- Solid D (+41.9) · D 69.5% · R 27.6% · Other 2.9%
- 2008→2024 swing
- -3.6pp toward R · 2008: 45.6pp · 2024: 41.9pp
- All cycles
- 2024: D+41.9 2020: D+46.8 2016: D+39.5 2012: D+43.8 2008: D+45.6
Not yet ingested
- Civics
- —
Market trends
- HPI YoY
- ▼ -260.63%
- Current HPI
- 277.0125
- Rent YoY
- —
- Metro
- —
- State GDP YoY
- ▲ 2.28%
- F500 in state
- 38
Industry mix (Fortune 500 HQ in MA)
| Industry | F500 HQs | Revenue |
|---|---|---|
| Technology | 3 | $17B |
|
||
| Insurance | 2 | $84B |
|
||
| Retail | 2 | $76B |
|
||
| Life Sciences | 1 | $43B |
|
||
| Energy Technology | 1 | $31B |
|
||
| Aerospace / Defense | 1 | $18B |
|
||
Price history
+78.7% since first listed4 events — show timeline
- 2026-05-16 Contingent — MLS PIN
- 2026-04-08 Listed $375,000 MLS PIN
- 2019-06-03 Sold (MLS) $200,000 MLS PIN
- 2019-04-02 Listed $209,900 MLS PIN
Property tax history
+2.3%/yrLatest (2023): $2,832 · -11.4% YoY. Source: county tax records.
Cash-flow waterfall
monthlySold comps — $/sqft
last 12 mo · ≤1 miLoading sold comps…