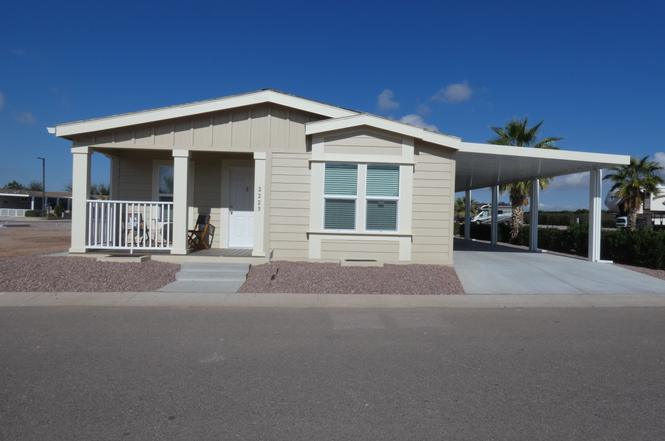
1110 North Henness Rd 2225 Plan · Casa Grande, AZ
Flood risk No data
- FEMA flood zone
- —
- Chance of flooding over 30 yrs
- —
- Est. flood insurance / yr
- —
Fire risk No data
- Est. fire insurance / yr
- —
Heat risk No data
- Hot days now (above threshold)
- —
- Hot days in 30 yrs
- —
Wind risk No data
- Chance of severe wind over 30 yrs
- —
Air-quality risk No data
- Unhealthy air days now
- —
- Unhealthy air days in 30 yrs
- —
Risk factors via First Street. Map © Google.
Why this score? — see what drove the C grade
The composite is a weighted blend of 9 inputs, each scored 0–100. Each bar is that input's sub-score; the figure is the points it added to the 100-point composite (weight × sub-score).
- Cash flow +20.9/30.0
- ARV discount +15.0/15.0
- DSCR +6.7/10.0
- 1% rule +5.5/10.0
- Rent growth +3.7/5.0
- Livability +2.9/5.0
- Condition / age +2.5/5.0
- Schools +1.5/10.0
- Appreciation +0.0/10.0
$173,995
🖨 Deal sheet 📄 Offer letter ✓ Due diligence
Listing remarks
This new home located on a generous corner lot at 2225 Badlands Dr. is the perfect blend of comfort and community at Palm Creek Resort and Residences. Offering a modern interior with a spacious layout all within a resort featuring championship golf, pickleball, pools, and social events this home won't disappoint. With 2 bedrooms and 2 bathrooms you will have plenty of room to entertain guests for the day or a week! Appointed with an island kitchen, upgraded flooring, stainless steel appliances, full covered parking for 2 cars, room for a nice rear patio and an excellent extended home warranty. Contact a sales representative today to schedule a private viewing!
Key facts
- Championship golf
- Upgraded flooring
- Island kitchen
Tags
Property features AI
Finance
- Financial info: List price $169,995
Exterior
- Home design: Plan inventory (new construction plan name: 1110 North Henness Rd 2225)
- Construction: 1,179 living area
- Exterior features: Located at 1110 N Henness Rd, Casa Grande, AZ 85122
Interior
- Bedrooms: 2 bedrooms
- Bathrooms: 2 full bathrooms
- Interior features: Active listing
Neighborhood map
What this means for you Summary
Snapshot
- This is a 2-bed/2.0-bath manufactured listed at $174k.
Deal economics
- At list price, monthly cash flow is $242 ($3k/yr) — positive.
- The deal already cash-flows at list — no discount required.
- Meets the 1% rule at list price ($2k rent vs $174k).
- Recommended offer: $153k (12.0% below list) — sets the bar for market timing.
- Cap rate 8.0% vs local median 4.1% in Casa Grande — top-decile yield for the area; either an underpriced asset or a hidden risk that comps aren't pricing in. Stress-test before assuming the spread holds.
Location & tenants
- Location reads 58/100 on livability (#220 in AZ) — a working-class tenant base; expect higher turnover. Strengths: cost of living A+, housing A+; Watch: crime D+, employment D+, schools F.
- Casa Grande Union High School District (4453) (suburban): math 14% / reading 21% proficiency, ranked #193 of 249 in AZ (top 78%) — low school quality limits family demand, transient renter base, plan for 1-2y turnover.
- Market conditions: Rents rising fast (+4.6%/yr); 628 active listings in the ZIP; 13 comparable units currently listed for rent nearby; rentals leasing fast (median 2d on market — plan ~1-2 weeks tenant-placement turnaround); 9,504 units permitted in Pinal County in 2024 (776 in 5+ unit buildings).
- This rent runs 32% of the median local income ($68k/yr) — at the standard rent-burdened threshold; future hikes will face affordability resistance.
Forward outlook
- Local home prices are declining (-3.0%/yr); year-one equity from $1k of loan paydown is wiped out by about $5k of value loss. Plan a longer hold.
Negotiation context
- It's been on market 265 days — a 12% lower offer ($153k) is reasonable based on typical stale-listing flexibility.
Questions for the listing agent
- It's been on market 265 days. Have you received any prior offers? Is the seller open to a 12% concession, seller financing, or rate buy-down credit?
- Why hasn't it sold? Are there any deal-killer items the seller is aware of (foundation, flood, title, zoning, code violations)?
- Is there a deadline driving the sale (1031 exchange, divorce, estate, relocation)? That informs how much negotiation room exists.
- Schools are F-rated, which usually means shorter tenancies and higher turnover. Who's the typical renter profile here, and what's been the actual vacancy rate?
- Crime grade is D in this area — have there been break-ins, vandalism, or insurance claims at this property in the last 3 years? What carrier currently insures it and at what premium?
- What's the average days-on-market for RENTAL listings here right now (not sales)? A rising rental-DOM trend means longer vacancies and softer asking-rent achievability than the comps imply.
- What's the recent tenant-quality profile in this submarket — average credit score on applications, eviction rate, late-payment / NSF rate, and stable-employment percentage? A property-management company in the area should have these aggregated.
- How much new for-sale + rental construction is in the pipeline within 1–3 miles? Heavy new supply typically softens prices + rents 12–24 months out; constrained supply supports both.
Investment metrics
- 1% rule
- 1.05% ✓
- Cap rate
- 7.96%
- Cash-on-cash
- 5.96%
- DSCR
- 1.27
- GRM
- 7.9
CMA / ARV
- ARV (on-the-fly)
- $221,652
- Comps found
- 1
Show comp detail 1 sale within ~0.75 mi
| Address | Dist | Beds/Ba | Sqft | Sold | Price | $/sf | Match |
|---|---|---|---|---|---|---|---|
| 1110 N Henness Rd #2199 | 0.00mi | 2/2.0 | 1,274 (+8%) | 6mo | $240,000 | $188 | 82 |
Match score weights: distance 35% · size 25% · config 20% · recency 20%. Top-matched comps best support the ARV.
Projected returns pro-forma
-3.0% appreciation · 4.6% rent growth · sell at horizon
- IRR
- -5.3%
- Equity multiple
- 0.80×
- Total profit
- $-9,776
- Equity at exit
- $25,943
- IRR
- 6.2%
- Equity multiple
- 1.49×
- Total profit
- $24,107
- Equity at exit
- $15,044
Cash invested: $48,719 (down + closing). Projections, not guarantees.
Landlord ↔ Tenant lean methodology
- Overall (STATE)
- 87 Strongly Landlord-Friendly
- State Arizona
- 87 Strongly Landlord-Friendly · R+3
- County
- — inherits STATE
- City
- — inherits STATE
ZIP-level market 85122
- Home prices YoY
- -22.4%
- Rents YoY
- 4.6%
- Active inventory
- 628
- Price-to-rent
- 7.9×
Monthly cashflow live
- Estimated rent
- $1,828 high interval (Pro) →
- Mortgage (P&I)
- −$912
- Tax est. 1.5%
- −$217 /mo · $2,610/yr
- Insurance
- −$72
- HOA
- −$0
- Vacancy / Maint / Mgmt
- −$384
- Net cashflow
- $242
Break-even live
UW: 25.0% down · 7.5% · 30yr · 1.5% tax · 5.0% vac · 8.0% maint · 8.0% mgmt
Financing live
Cash to close
- Down payment
- $43,499
- Closing costs
- $5,220
- Reserves months
- —
- Total cash needed
- —
Loan-product check · same deal, 3 products live
Conventional
25% down · 7.5% · 30yr
- Down + closing
- —
- Monthly P&I
- —
- Monthly cashflow
- —
- DSCR
- —
- Eligible?
- —
Personal DTI + credit; lowest rate.
DSCR
20% down · 8.5% · 30yr
- Down + closing
- —
- Monthly P&I
- —
- Monthly cashflow
- —
- DSCR
- —
- Eligible?
- —
No personal income docs; deal must DSCR.
Hard money
10% down · 12.0% · 12mo
- Down + closing
- —
- Monthly P&I
- —
- Monthly cashflow
- —
- DSCR
- —
- Eligible?
- —
Short-term bridge; refi at stabilization.
Rent comps 13 comps
| Address | Beds | Baths | Sqft | Rent | $/sqft | DOM | Units | Dist |
|---|---|---|---|---|---|---|---|---|
| 1110 Henness Rd Casa Grande, AZ | 2.0 | 2.0 | 1166 | $1,599 | $1.37 | 1d | 1 | 0.39mi |
| 1762 E Sycamore Rd Casa Grande, AZ | 3.0 | 2.0 | 1273 | $3,500 | $2.75 | 24d | 1 | 0.65mi |
| 1771 E McMurray Blvd Casa Grande, AZ | 1.0–2.0 | 1.0 | 733 | $1,395 | $1.90 | 1d | 1 | 0.73mi |
| 1565 N Wildflower Dr Casa Grande, AZ | 1.0–3.0 | 1.0–2.0 | 998 | $1,304 | $1.31 | 1d | 9 | 0.78mi |
| 1000 N Arizola Rd Casa Grande, AZ | 2.0 | 1.0–2.0 | 621 | $1,351 | $2.18 | 1d | 10 | 0.79mi |
| 422 N Via Del Cielo Rd Casa Grande, AZ | 1.0–3.0 | 1.0–2.5 | 1090 | $2,172 | $1.99 | 5d | 30 | 0.97mi |
| 1821 E Florence Blvd Casa Grande, AZ | 1.0–3.0 | 1.0–2.0 | 1091 | $2,240 | $2.05 | 1d | 1 | 1.05mi |
| 1620 E Silver Reef Dr Casa Grande, AZ | 3.0 | 2.0 | 1202 | $1,575 | $1.31 | 24d | 1 | 1.11mi |
| 1715 N Peart Rd Casa Grande, AZ | 2.0–4.0 | 1.0–2.0 | 1221 | $1,465 | $1.20 | 2d | 22 | 1.12mi |
| 1450 E Cottonwood Ln Casa Grande, AZ | 1.0–2.0 | 1.0–2.0 | 821 | $1,995 | $2.43 | 2d | 18 | 1.24mi |
| 1650 E Jardin Pl Casa Grande, AZ | 3.0 | 2.0 | 1411 | $1,695 | $1.20 | 24d | 1 | 1.28mi |
| 255 N Camino Mercado Casa Grande, AZ | 1.0–3.0 | 1.0–2.0 | 1041 | $1,735 | $1.67 | 1d | 45 | 1.29mi |
| 1636 E Jardin Pl Casa Grande, AZ | 3.0 | 2.0 | 1411 | $1,999 | $1.42 | 5d | 1 | 1.30mi |
Listing history 15 events
-
2026-06-18days on market $173,995 Active 265 DOM
-
2026-06-17days on market $173,995 Active 264 DOM
-
2026-06-16days on market $173,995 Active 263 DOM
-
2026-06-15days on market $173,995 Active 262 DOM
-
2026-06-13days on market $173,995 Active 260 DOM
-
2026-06-13days on market $173,995 Active 259 DOM
-
2026-06-10price $173,995 Active 256 DOM
-
2026-06-09days on market $169,995 Active 256 DOM
-
2026-06-08days on market $169,995 Active 255 DOM
-
2026-06-07days on market $169,995 Active 254 DOM
-
2026-06-04days on market $169,995 Active 251 DOM
-
2026-06-03days on market $169,995 Active 250 DOM
-
2026-06-02days on market $169,995 Active 249 DOM
-
2026-06-01days on market $169,995 Active 248 DOM
-
2026-05-31days on market $169,995 Active 247 DOM
ⓘ Source: listings_history table (triggers on properties + properties_extension) + one-shot
backfill from property_details.listing_events for pre-trigger history.
Nearby sold comps map
Loading sold comps map…
Walkable amenities ~0.75 mi
Loading nearby amenities…
Taxation est. · year 1
- Rental income
- $21,938
- − Mortgage interest
- −$9,746
- − Property taxes
- −$2,610
- − Insurance
- −$870
- − Repairs & maintenance
- −$1,755
- − Management
- −$1,755
- − Depreciation
- −$5,062
- Taxable income
- $140
- Est. tax owed @ 24.0%
- −$34
- After-tax cash flow
- $2,868/yr
For passive investors: Depreciation is non-cash, so a rental often shows a tax loss while cash-flowing — sheltering income. Rental losses are passive: they offset passive income freely, and up to $25,000/yr can offset ordinary (W-2) income if you actively participate and your MAGI is under $100k (phasing out to $0 by $150k); unused losses carry forward. On sale, claimed depreciation is recaptured at up to 25%, and gains may owe capital-gains tax (a 1031 exchange can defer both). Figures are a year-1 estimate at your 24.0% rate — not tax advice; consult a CPA.
Schools (NCES district)
- District
- Casa Grande Union High School District (4453)
- NCES district ID
- 0401740
- Math proficiency
- 14% ▼ -15.00%
- Reading proficiency
- 21% ▼ -10.00%
- Median HH income
- $45,373
- Composite
- 15.38/100
- National rank
- #9319
- State rank
- #193 of 249 in AZ
Livability — Casa Grande
- Score
- 58/100
- State rank
- #220
- US rank
- #21534
Category grades
Schools grade is shown separately in the Schools card above.
Census & demographics
- Census place
- Casa Grande, AZ
- County
- Pinal County · 399,947 people
- City population
- 69,701
- Metro
- Phoenix-Mesa-Chandler, AZ
- Population (ZIP)
- 61,624
- Household income
- $68,443
- Rent vs Own
- Severe rent burden
- 1250.0
Population outlook (Pinal County) Hauer SSP2
- Today (2025)
- 437,574 people
- By 2030
- 446,903 · +2.1%
- By 2040
- 452,589 · +3.4%
- By 2050
- 444,126 · +1.5%
- By 2075
- 430,300 · -1.7%
- By 2100
- 393,536 · -10.1%
Race, ethnicity, and origin ACS 2023
- Neighborhood character
- Diverse neighborhood (Simpson 0.63)
- Race & ethnicity
- Hispanic / Latino 44% White 42% Two or more races 21% Black 4% Native American 4% Asian 1%
- Hispanic origin (detail)
- Mexican 40%
- Common ancestry
- Lithuanian 1% Slovak 1% Portuguese 1%
- Foreign-born
- 12% · Canada
- Languages at home
- 75% English-only · Spanish 23% Tagalog/Filipino 1% Other Indo-European 1%
Political lean MEDSL · Pinal
- 2024 margin
- Strong R (+22.1) · D 38.5% · R 60.6%
- 2008→2024 swing
- -7.6pp toward R · 2008: -14.5pp · 2024: -22.1pp
- All cycles
- 2024: R+22.1 2020: R+17.3 2016: R+19.3 2012: R+17.1 2008: R+14.5
Not yet ingested
- Civics
- —
Market trends
- HPI YoY
- ▼ -67.32%
- Current HPI
- 233.148
- Rent YoY
- ▲ 4.60%
- Metro
- Phoenix-Mesa-Chandler, AZ
- State GDP YoY
- ▲ 4.54%
- F500 in state
- 20
Industry mix (Fortune 500 HQ in AZ)
| Industry | F500 HQs | Revenue |
|---|---|---|
| Technology | 2 | $13B |
|
||
| Mining / Metals | 1 | $23B |
|
||
| Environmental Services | 1 | $16B |
|
||
| Metals / Steel | 1 | $14B |
|
||
| Technology Distribution | 1 | $9B |
|
||
| Homebuilding | 1 | $8B |
|
||
Cash-flow waterfall
monthlySold comps — $/sqft
last 12 mo · ≤1 miLoading sold comps…