2023 E Yonge St · Pensacola, FL
Flood risk 1/10 · Minimal
- FEMA flood zone
- X (unshaded)
- Chance of flooding over 30 yrs
- 0.0%
- Est. flood insurance / yr
- $507 – $1,088
Fire risk 1/10 · Minimal
- Est. fire insurance / yr
- $947 – $1,759
Heat risk 10/10 · Severe
- Hot days now (above 105°F)
- 7 days/yr
- Hot days in 30 yrs
- 20 days/yr
Wind risk 9/10 · Severe
- Chance of severe wind over 30 yrs
- 99.0%
Air-quality risk 2/10 · Minimal
- Unhealthy air days now
- 0 days/yr
- Unhealthy air days in 30 yrs
- 1 days/yr
Risk factors via First Street. Map © Google.
Why this score? — see what drove the D grade
The composite is a weighted blend of 9 inputs, each scored 0–100. Each bar is that input's sub-score; the figure is the points it added to the 100-point composite (weight × sub-score).
- ARV discount +15.0/15.0
- Cash flow +8.9/30.0
- Livability +4.2/5.0
- Schools +3.6/10.0
- Rent growth +3.3/5.0
- DSCR +2.5/10.0
- Condition / age +2.5/5.0
- 1% rule +1.7/10.0
- Appreciation +0.0/10.0
$425,000
🖨 Deal sheet 📄 Offer letter ✓ Due diligence
Listing remarks MLS
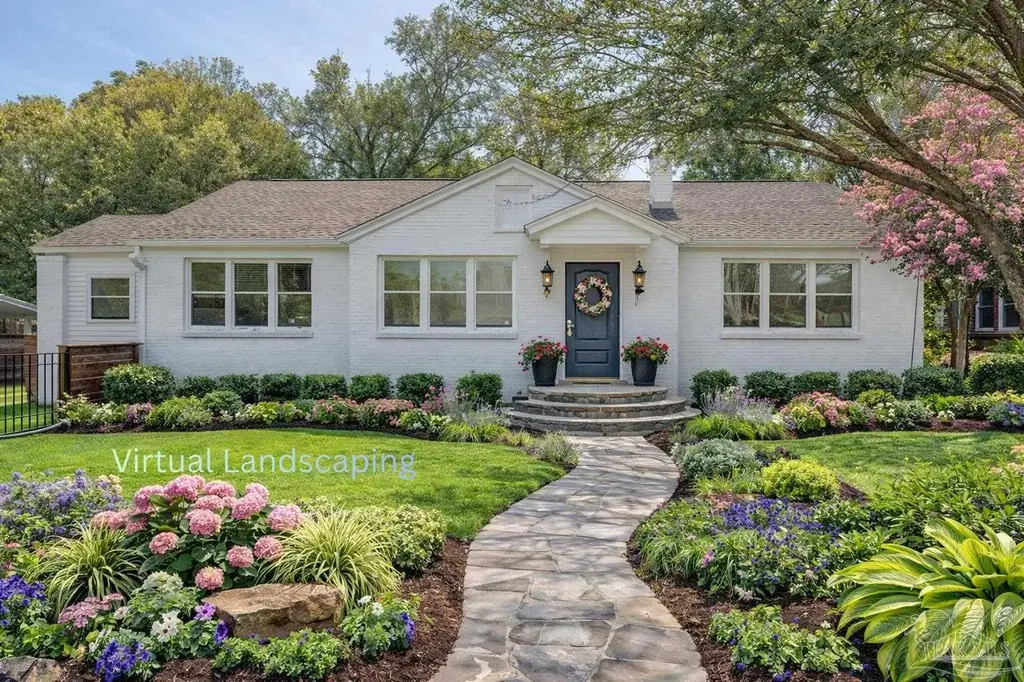
*First photo is virtually landscaped* This classic white-painted brick East Hill home blends modern convenience and 1940s charm! Featuring three bedrooms, two full bathrooms, original wood flooring, and plenty of space for a pool and/or ADU, this home is located just seven blocks from Bayview Park and four blocks from Bayou Texar. Seller is replacing all windows, HVAC system, and providing a clear WDO report for the new owner! The living room features a fireplace and elegant archway into the dining room. French doors separate the dining room from a separate mudroom and entrance. Off the dining room is a large kitchen with gas range, refrigerator, dishwasher, copious cabinet storage, and a window over the sink. Stone countertops and tile floors make for easy clean-up! Beyond the kitchen is a utility room with washer and dryer hookups (washer and dryer can be provided by Seller) and a gas, tankless hot water heater. At the back of the home is a bonus room with wood-like tile, perfect for recreation. All bedrooms are located on the west side of the house. Each bedroom has a closet, with the main bedroom featuring original built-ins for additional storage! The main bathroom has a large glass-enclosed shower with two showerheads, including a rainfall showerhead. The additional bathroom has a shower, vanity, and water-conserving toilet. On the east side of the home, directly off the driveway and carport, is a mud room, perfect for rainy days. Two outdoor sheds with power are located at the back of the property. Don't delay - come see everything this property has to offer!
Key facts
- Elegant archway
- Space for adu
- Large kitchen
Tags
Neighborhood map
What this means for you Summary
Snapshot
- This is a 3-bed/2.0-bath single-family listed at $425k.
Deal economics
- At list price, monthly cash flow is $-345 ($-4k/yr) — negative.
- To cash-flow at today's rent, offer at most $364k (14.4% below list).
- To meet the 1% rule (rent ≥ 1% of price), the offer needs to be $286k (32.6% below list).
- Recommended offer: $286k (32.6% below list) — sets the bar for 1% rule.
- Cap rate 5.3% vs local median 3.6% in Pensacola — top-decile yield for the area; either an underpriced asset or a hidden risk that comps aren't pricing in. Stress-test before assuming the spread holds.
Location & tenants
- Location reads 83/100 on livability (#53 in FL, #924 nationally) — a professional / high-income tenant draw. Strengths: commute A+, cost of living A+, housing A+.
- Escambia (suburban): math 40% / reading 45% proficiency, ranked #56 of 73 in FL (top 77%) — families likely to look elsewhere, expect single-tenant / working-renter base with shorter leases.
- Market conditions: Rents rising (+3.4%/yr); 240 active listings in the ZIP; 9 comparable units currently listed for rent nearby; rentals at typical pace (median 23d on market — plan ~3-4 weeks tenant-placement turnaround); 1,479 units permitted in Escambia County in 2024 (0 in 5+ unit buildings).
- At $2,862/mo this rent would consume 48% of the median local household income ($71k/yr) (locally 948% of renters already pay >50% of income on rent) — very limited rent-growth headroom before tenants either downsize or default.
Forward outlook
- Local home prices are declining (-3.0%/yr); year-one equity from $3k of loan paydown is wiped out by about $13k of value loss. Plan a longer hold.
- Escambia County population projected at +13% by 2050 — modest demand growth; plan on rents tracking national, not racing it.
Negotiation context
- It's been on market 118 days — a 9% lower offer ($387k) is reasonable based on typical stale-listing flexibility.
- 3 sale attempts since 14y ago; this cycle's ask has dropped $24k (5%) from the opening price — seller is motivated, your offer sets the floor, not the list.
- Current owner paid $125k; list at $425k implies a 240% gain — meaningful room to come down on a strong offer.
Risks & watch-outs
- Watch-outs: built in 1948 — expect roof / HVAC / electrical / plumbing capex.
- Climate carrying-cost: severe wind risk, 99% chance of damaging wind over 30y; extreme-heat days projected 7→20/yr by 2055 (HVAC capex compounding) — expect insurance premiums to compound above CPI over the hold.
Questions for the listing agent
- What do current leases actually rent for vs. the listed asking? Can we see a recent rent roll and the last 12 months of T-12 income?
- It's been on market 118 days. Have you received any prior offers? Is the seller open to a 33% concession, seller financing, or rate buy-down credit?
- Built in 1948 — when were the roof, HVAC, electrical panel, plumbing, and water heater last replaced?
- Why hasn't it sold? Are there any deal-killer items the seller is aware of (foundation, flood, title, zoning, code violations)?
- Is there a deadline driving the sale (1031 exchange, divorce, estate, relocation)? That informs how much negotiation room exists.
- The area grade is low — what's the realistic commute time and amenity access for the typical tenant pool here? Any planned neighborhood developments (good or bad) we should know about?
- What's the average days-on-market for RENTAL listings here right now (not sales)? A rising rental-DOM trend means longer vacancies and softer asking-rent achievability than the comps imply.
- What's the recent tenant-quality profile in this submarket — average credit score on applications, eviction rate, late-payment / NSF rate, and stable-employment percentage? A property-management company in the area should have these aggregated.
- How much new for-sale + rental construction is in the pipeline within 1–3 miles? Heavy new supply typically softens prices + rents 12–24 months out; constrained supply supports both.
Investment metrics
- 1% rule
- 0.67% ✗
- Cap rate
- 5.32%
- Cash-on-cash
- -3.48%
- DSCR
- 0.85
- GRM
- 12.4
CMA / ARV
- ARV (median comp)
- $563,802
- List price
- $425,000
- Delta
- -24.62%
- Verdict
- UNDERPRICED
- Comps
- 20 within 1.0 mi
Show comp detail 12 sales within ~0.75 mi
| Address | Dist | Beds/Ba | Sqft | Sold | Price | $/sf | Match |
|---|---|---|---|---|---|---|---|
| 1834 E Hernandez St | 0.28mi | 3/3.0 | 2,260 (+7%) | 2mo | $800,000 | $354 | 70 |
| 1611 Bayou Blvd | 0.66mi | 3/2.0 | 2,079 (-2%) | 4mo | $340,000 | $164 | 63 |
| 1412 E Bobe St | 0.53mi | 3/2.5 | 2,015 (-5%) | 4mo | $725,000 | $360 | 62 |
| 1408 E Bobe St | 0.55mi | 3/2.5 | 2,015 (-5%) | 4mo | $720,000 | $357 | 61 |
| 1350 E Scott St | 0.62mi | 3/2.5 | 1,950 (-8%) | 1mo | $625,000 | $321 | 55 |
| 1419 E Hatton St | 0.53mi | 3/2.5 | 2,300 (+9%) | 4mo | $725,000 | $315 | 55 |
| 1918 N 17th Ave | 0.41mi | 3/2.0 | 1,800 (-15%) | 1mo | $275,000 | $153 | 55 |
| 2220 Fleance Dr | 0.67mi | 4/2.0 (+1) | 2,235 (+6%) | 1mo | $495,000 | $221 | 54 |
| 1409 E Leonard St | 0.64mi | 3/2.5 | 2,235 (+6%) | 6mo | $717,500 | $321 | 54 |
| 1308 E Cross St | 0.69mi | 3/2.5 | 2,288 (+8%) | 2mo | $660,000 | $288 | 51 |
| 1402 E Leonard St | 0.67mi | 3/2.5 | 1,917 (-10%) | 1mo | $255,000 | $133 | 50 |
| 1301 E Lakeview Ave | 0.74mi | 4/3.5 (+1) | 2,370 (+12%) | 5mo | $765,000 | $323 | 30 |
Match score weights: distance 35% · size 25% · config 20% · recency 20%. Top-matched comps best support the ARV.
Projected returns pro-forma
-3.0% appreciation · 3.39% rent growth · sell at horizon
- IRR
- -21.8%
- Equity multiple
- 0.24×
- Total profit
- $-89,895
- Equity at exit
- $63,369
- IRR
- -15.0%
- Equity multiple
- 0.14×
- Total profit
- $-102,587
- Equity at exit
- $36,746
Cash invested: $119,000 (down + closing). Projections, not guarantees.
Landlord ↔ Tenant lean methodology
- Overall (STATE)
- 87 Strongly Landlord-Friendly
- State Florida
- 87 Strongly Landlord-Friendly · R+3
- County
- — inherits STATE
- City
- — inherits STATE
ZIP-level market 32503
- Rents YoY
- 3.4%
- Active inventory
- 240
- Price-to-rent
- 12.4×
Monthly cashflow live
- Estimated rent
- $2,862 high interval (Pro) →
- Mortgage (P&I)
- −$2,229
- Tax from tax record
- −$201 /mo · $2,410/yr
- Insurance
- −$177
- HOA
- −$0
- Vacancy / Maint / Mgmt
- −$601
- Net cashflow
- $-345
Break-even live
UW: 25.0% down · 7.5% · 30yr · 1.5% tax · 5.0% vac · 8.0% maint · 8.0% mgmt
Financing live
Cash to close
- Down payment
- $106,250
- Closing costs
- $12,750
- Reserves months
- —
- Total cash needed
- —
Loan-product check · same deal, 3 products live
Conventional
25% down · 7.5% · 30yr
- Down + closing
- —
- Monthly P&I
- —
- Monthly cashflow
- —
- DSCR
- —
- Eligible?
- —
Personal DTI + credit; lowest rate.
DSCR
20% down · 8.5% · 30yr
- Down + closing
- —
- Monthly P&I
- —
- Monthly cashflow
- —
- DSCR
- —
- Eligible?
- —
No personal income docs; deal must DSCR.
Hard money
10% down · 12.0% · 12mo
- Down + closing
- —
- Monthly P&I
- —
- Monthly cashflow
- —
- DSCR
- —
- Eligible?
- —
Short-term bridge; refi at stabilization.
Rent comps 9 comps
| Address | Beds | Baths | Sqft | Rent | $/sqft | DOM | Units | Dist |
|---|---|---|---|---|---|---|---|---|
| 3014 Magnolia Ave Pensacola, FL | 3.0 | 2.0 | 1650 | $2,750 | $1.67 | 23d | 1 | 0.51mi |
| 1501 E Cross St Pensacola, FL | 4.0 | 2.0 | 1920 | $3,200 | $1.67 | 23d | 1 | 0.54mi |
| 1501 E Cross St Pensacola, FL | 4.0 | 2.0 | 1920 | $3,000 | $1.56 | 13d | 1 | 0.54mi |
| 1301 E Cross St Pensacola, FL | 3.0 | 2.0 | 2200 | $3,900 | $1.77 | 13d | 1 | 0.72mi |
| 3019 Keats Dr Pensacola, FL | 4.0 | 2.5 | 2484 | $4,400 | $1.77 | 23d | 1 | 0.81mi |
| 1121 E Maxwell St Pensacola, FL | 3.0 | 2.5 | 1716 | $3,550 | $2.07 | 23d | 1 | 0.82mi |
| 3545 Hopestill Rd Pensacola, FL | 4.0 | 2.0 | 1984 | $2,400 | $1.21 | 23d | 1 | 0.91mi |
| 3547 Firestone Blvd Pensacola, FL | 4.0 | 2.0 | 2000 | $2,695 | $1.35 | 23d | 1 | 0.93mi |
| 3791 Maule Rd Pensacola, FL | 4.0 | 3.0 | 2000 | $3,250 | $1.62 | 23d | 1 | 1.08mi |
Listing history 21 events
-
2026-06-18days on market $425,000 Active 118 DOM
-
2026-06-17days on market $425,000 Active 117 DOM
-
2026-06-16days on market $425,000 Active 116 DOM
-
2026-06-15days on market $425,000 Active 115 DOM
-
2026-06-14days on market $425,000 Active 113 DOM
-
2026-06-10days on market $425,000 Active 110 DOM
-
2026-06-09days on market $425,000 Active 109 DOM
-
2026-06-08days on market $425,000 Active 108 DOM
-
2026-06-07days on market $425,000 Active 107 DOM
-
2026-06-03days on market $425,000 Active 103 DOM
-
2026-06-02days on market $425,000 Active 102 DOM
-
2026-06-01days on market $425,000 Active 101 DOM
-
2026-05-31days on market $425,000 Active 100 DOM
-
2026-05-31days on market $425,000 Active 99 DOM
-
2026-03-23price $425,000 1593-char remark
Show marketing remark (1593 chars)
*First photo is virtually landscaped* This classic white-painted brick East Hill home blends modern convenience and 1940s charm! Featuring three bedrooms, two full bathrooms, original wood flooring, and plenty of space for a pool and/or ADU, this home is located just seven blocks from Bayview Park and four blocks from Bayou Texar. Seller is replacing all windows, HVAC system, and providing a clear WDO report for the new owner! The living room features a fireplace and elegant archway into the dining room. French doors separate the dining room from a separate mudroom and entrance. Off the dining room is a large kitchen with gas range, refrigerator, dishwasher, copious cabinet storage, and a window over the sink. Stone countertops and tile floors make for easy clean-up! Beyond the kitchen is a utility room with washer and dryer hookups (washer and dryer can be provided by Seller) and a gas, tankless hot water heater. At the back of the home is a bonus room with wood-like tile, perfect for recreation. All bedrooms are located on the west side of the house. Each bedroom has a closet, with the main bedroom featuring original built-ins for additional storage! The main bathroom has a large glass-enclosed shower with two showerheads, including a rainfall showerhead. The additional bathroom has a shower, vanity, and water-conserving toilet. On the east side of the home, directly off the driveway and carport, is a mud room, perfect for rainy days. Two outdoor sheds with power are located at the back of the property. Don't delay - come see everything this property has to offer!
-
2026-02-20$449,000 Active 1593-char remark
Show marketing remark (1593 chars)
*First photo is virtually landscaped* This classic white-painted brick East Hill home blends modern convenience and 1940s charm! Featuring three bedrooms, two full bathrooms, original wood flooring, and plenty of space for a pool and/or ADU, this home is located just seven blocks from Bayview Park and four blocks from Bayou Texar. Seller is replacing all windows, HVAC system, and providing a clear WDO report for the new owner! The living room features a fireplace and elegant archway into the dining room. French doors separate the dining room from a separate mudroom and entrance. Off the dining room is a large kitchen with gas range, refrigerator, dishwasher, copious cabinet storage, and a window over the sink. Stone countertops and tile floors make for easy clean-up! Beyond the kitchen is a utility room with washer and dryer hookups (washer and dryer can be provided by Seller) and a gas, tankless hot water heater. At the back of the home is a bonus room with wood-like tile, perfect for recreation. All bedrooms are located on the west side of the house. Each bedroom has a closet, with the main bedroom featuring original built-ins for additional storage! The main bathroom has a large glass-enclosed shower with two showerheads, including a rainfall showerhead. The additional bathroom has a shower, vanity, and water-conserving toilet. On the east side of the home, directly off the driveway and carport, is a mud room, perfect for rainy days. Two outdoor sheds with power are located at the back of the property. Don't delay - come see everything this property has to offer!
-
2023-03-26historical
-
2022-12-20$425,000 Active
-
2012-12-26soldstatus $125,000
-
2012-12-20soldstatus $125,000
-
2012-06-05$139,900
ⓘ Source: listings_history table (triggers on properties + properties_extension) + one-shot
backfill from property_details.listing_events for pre-trigger history.
Tax reassessment forecast FL · Resets to sale price
- Current annual tax
- $2,410 · $201/mo
- Projected year-2 tax
- $3,528 · $294/mo
- Expected delta
- +$1,118/yr (+$93/mo · 46.4%)
ⓘ Screening estimate from a state-policy table — verify with the county assessor before closing.
Climate risk First Street
- Flood 1/10 Low FEMA zone X (unshaded) · 0% chance over 30 yrs
- Wildfire 1/10 Low
- Heat 10/10 Extreme 7 d/yr ≥105°F today · 20 d/yr by 30 yrs out
- Wind 9/10 Extreme 99% chance of damaging wind over 30 yrs
- Air quality 2/10 Low 0 unhealthy d/yr today · 1 by 30 yrs out
Nearby sold comps map
Loading sold comps map…
Walkable amenities ~0.75 mi
Loading nearby amenities…
Taxation est. · year 1
- Rental income
- $34,349
- − Mortgage interest
- −$23,807
- − Property taxes
- −$2,410
- − Insurance
- −$2,125
- − Repairs & maintenance
- −$2,748
- − Management
- −$2,748
- − Depreciation
- −$12,364
- Taxable loss
- −$11,852
- Est. tax savings @ 24.0%
- +$2,844
- After-tax cash flow
- $-1,300/yr
For passive investors: Depreciation is non-cash, so a rental often shows a tax loss while cash-flowing — sheltering income. Rental losses are passive: they offset passive income freely, and up to $25,000/yr can offset ordinary (W-2) income if you actively participate and your MAGI is under $100k (phasing out to $0 by $150k); unused losses carry forward. On sale, claimed depreciation is recaptured at up to 25%, and gains may owe capital-gains tax (a 1031 exchange can defer both). Figures are a year-1 estimate at your 24.0% rate — not tax advice; consult a CPA.
Schools (NCES district)
- District
- Escambia
- NCES district ID
- 1200510
- Math proficiency
- 40% ▼ -9.00%
- Reading proficiency
- 45% ▼ -4.00%
- Median HH income
- $44,649
- Composite
- 36.04/100
- National rank
- #4773
- State rank
- #56 of 73 in FL
Livability — Pensacola
- Score
- 83/100
- State rank
- #53
- US rank
- #924
Category grades
Schools grade is shown separately in the Schools card above.
Census & demographics
- Census place
- Pensacola, FL
- County
- Escambia County · 301,722 people
- City population
- 237,636
- Metro
- Pensacola-Ferry Pass-Brent, FL
- Population (ZIP)
- 33,559
- Household income
- $71,411
- Rent vs Own
- Severe rent burden
- 948.0
Population outlook (Escambia County) Hauer SSP2
- Today (2025)
- 334,637 people
- By 2030
- 345,779 · +3.3%
- By 2040
- 364,828 · +9.0%
- By 2050
- 378,514 · +13.1%
- By 2075
- 403,220 · +20.5%
- By 2100
- 386,125 · +15.4%
Race, ethnicity, and origin ACS 2023
- Neighborhood character
- Predominantly White (68%)
- Race & ethnicity
- White 68% Black 20% Two or more races 6% Hispanic / Latino 5% Asian 2%
- Common ancestry
- Lithuanian 3% Italian 2% Romanian 2%
- Foreign-born
- 5% · Canada, China
- Languages at home
- 93% English-only · Spanish 3% Arabic 1% Tagalog/Filipino 1%
Political lean MEDSL · Escambia
- 2024 margin
- R (+19.5) · D 39.7% · R 59.2% · Other 1.1%
- 2008→2024 swing
- -0.2pp no change · 2008: -19.3pp · 2024: -19.5pp
- All cycles
- 2024: R+19.5 2020: R+15.1 2016: R+20.6 2012: R+20.6 2008: R+19.3
Not yet ingested
- Civics
- —
Market trends
- HPI YoY
- ▼ -300.02%
- Current HPI
- 294.4873
- Rent YoY
- ▲ 3.39%
- Metro
- Pensacola-Ferry Pass-Brent, FL
- State GDP YoY
- ▲ 3.28%
- F500 in state
- 36
Industry mix (Fortune 500 HQ in FL)
| Industry | F500 HQs | Revenue |
|---|---|---|
| Industrial Technology | 2 | $29B |
|
||
| Insurance | 2 | $17B |
|
||
| Retail | 1 | $60B |
|
||
| Technology Distribution | 1 | $58B |
|
||
| Homebuilding | 1 | $35B |
|
||
| Technology Manufacturing | 1 | $35B |
|
||
Price history
+203.8% since first listed7 events — show timeline
- 2026-03-23 Price Changed $425,000 PARMLS
- 2026-02-20 Listed $449,000 PARMLS
- 2023-03-26 Listing Removed — PARMLS
- 2022-12-20 Listed $425,000 PARMLS
- 2012-12-26 Sold (Public Records) $125,000 Public Records
- 2012-12-20 Sold (MLS) $125,000 PARMLS
- 2012-06-05 Listed $139,900 PARMLS
Property tax history
+4.3%/yrLatest (2025): $2,410 · +6.3% YoY. Source: county tax records.
Cash-flow waterfall
monthlySold comps — $/sqft
last 12 mo · ≤1 miLoading sold comps…