 Multi-family
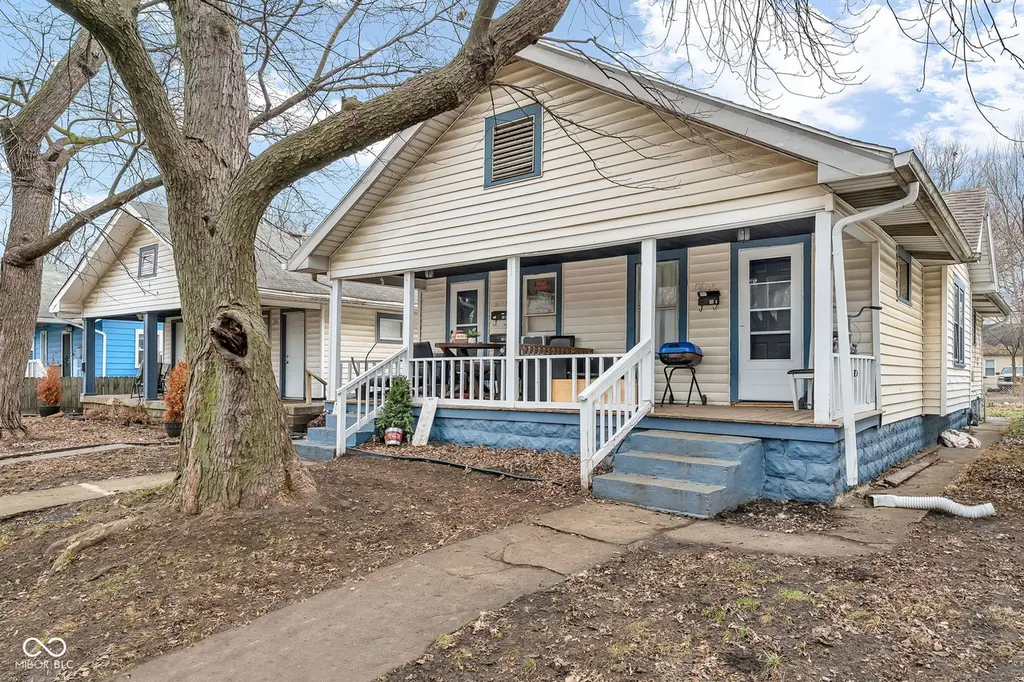
933 N Ewing St · Indianapolis city (balance), IN
Flood risk 1/10 · Minimal
- FEMA flood zone
- X (unshaded)
- Chance of flooding over 30 yrs
- 0.0%
- Est. flood insurance / yr
- $473 – $860
Fire risk 1/10 · Minimal
- Est. fire insurance / yr
- $717 – $1,331
Heat risk 4/10 · Minor
- Hot days now (above 102°F)
- 7 days/yr
- Hot days in 30 yrs
- 19 days/yr
Wind risk 2/10 · Minimal
- Chance of severe wind over 30 yrs
- —
Air-quality risk 4/10 · Minor
- Unhealthy air days now
- 5 days/yr
- Unhealthy air days in 30 yrs
- 7 days/yr
Risk factors via First Street. Map © Google.
Why this score? — see what drove the C+ grade
The composite is a weighted blend of 9 inputs, each scored 0–100. Each bar is that input's sub-score; the figure is the points it added to the 100-point composite (weight × sub-score).
- Cash flow +26.3/30.0
- ARV discount +9.6/15.0
- DSCR +9.0/10.0
- 1% rule +7.1/10.0
- Rent growth +4.3/5.0
- Livability +2.5/5.0
- Condition / age +2.5/5.0
- Schools +1.4/10.0
- Appreciation +0.0/10.0
$300,000
🖨 Deal sheet 📄 Offer letter ✓ Due diligence
Multi-family units
County records classify this as Multi-Family (2-4 Unit). Listing-text estimate: 1 unit. estimate disagrees with records
Listing remarks MLS
Located at 933 N Ewing St on Indianapolis' near-eastside, this well-maintained four-plex offers a prime investment opportunity just minutes from downtown. Built in 1920, the property features four 1-bedroom, 1-bath units, with three currently leased for stable income and one recently updated unit ready for immediate occupancy. Units include updated flooring, appliances, and fresh paint, enhancing overall tenant appeal. With rental potential exceeding $4,500 per month, an unfinished basement for additional utility space, and convenient access to employment centers, dining, and entertainment, this property presents strong cash flow and long-term growth potential for investors. Seller pays all utilities
Key facts
- Updated appliances
- Fresh paint
- Unfinished basement
Tags
Neighborhood map
What this means for you Summary
Snapshot
- This is a 2-bed/10.0-bath multifamily listed at $300k.
Deal economics
- At list price, monthly cash flow is $779 ($9k/yr) — positive.
- The deal already cash-flows at list — no discount required.
- Meets the 1% rule at list price ($4k rent vs $300k).
- Recommended offer: $282k (6.0% below list) — sets the bar for market timing.
- Cap rate 9.4% vs local median 4.4% in Indianapolis city (balance) — top-decile yield for the area; either an underpriced asset or a hidden risk that comps aren't pricing in. Stress-test before assuming the spread holds.
Location & tenants
- Location reads: area grade C — affects rentability + tenant quality, not the cash-flow math above.
- Indianapolis Public Schools (urban): math 14% / reading 20% proficiency, ranked #286 of 301 in IN (top 95%) — low school quality limits family demand, transient renter base, plan for 1-2y turnover; 77% free/reduced lunch — lower-income household profile, screen leases tightly.
- Market conditions: Rents rising fast (+7.3%/yr); 480 active listings in the ZIP; 40 comparable units currently listed for rent nearby; rentals at typical pace (median 24d on market — plan ~3-4 weeks tenant-placement turnaround); 1,906 units permitted in Marion County in 2024 (621 in 5+ unit buildings).
- At $3,628/mo this rent would consume 88% of the median local household income ($49k/yr) (locally 1906% of renters already pay >50% of income on rent) — very limited rent-growth headroom before tenants either downsize or default.
Forward outlook
- Local home prices are declining (-3.0%/yr); year-one equity from $2k of loan paydown is wiped out by about $9k of value loss. Plan a longer hold.
- Marion County population projected at +18% by 2050 — long-run rental-demand tailwind backs the buy-and-hold thesis.
- At projected returns (-3.0% appreciation + 7.3% rent growth), your $84k cash investment doubles in ~8 years — after that, you're playing with house money.
Negotiation context
- It's been on market 79 days — a 6% lower offer ($282k) is reasonable based on typical stale-listing flexibility.
- 16 sale attempts since 5y ago with the ask held roughly flat each time — persistent listings suggest the price (not the market) is what's stuck; bring a comps-based counter.
- Current owner paid $190k; list at $300k implies a 58% gain — meaningful room to come down on a strong offer.
Risks & watch-outs
- Watch-outs: built in 1920 — expect roof / HVAC / electrical / plumbing capex.
Questions for the listing agent
- It's been on market 79 days. Have you received any prior offers? Is the seller open to a 6% concession, seller financing, or rate buy-down credit?
- Built in 1920 — when were the roof, HVAC, electrical panel, plumbing, and water heater last replaced?
- Why hasn't it sold? Are there any deal-killer items the seller is aware of (foundation, flood, title, zoning, code violations)?
- Is there a deadline driving the sale (1031 exchange, divorce, estate, relocation)? That informs how much negotiation room exists.
- What's the average days-on-market for RENTAL listings here right now (not sales)? A rising rental-DOM trend means longer vacancies and softer asking-rent achievability than the comps imply.
- What's the recent tenant-quality profile in this submarket — average credit score on applications, eviction rate, late-payment / NSF rate, and stable-employment percentage? A property-management company in the area should have these aggregated.
- How much new apartment / multifamily construction is in the pipeline within 1–3 miles? Heavy new supply (>2% of stock underway) typically softens rents 12–24 months out; light construction supports rent growth.
Investment metrics
- 1% rule
- 1.21% ✓
- Cap rate
- 9.41%
- Cash-on-cash
- 11.13%
- DSCR
- 1.50
- GRM
- 6.9
CMA / ARV
- ARV (median comp)
- $315,000
- List price
- $300,000
- Delta
- -4.76%
- Verdict
- FAIR
- Comps
- 3 within 1.0 mi
Show comp detail 2 sales within ~0.75 mi
| Address | Dist | Beds/Ba | Sqft | Sold | Price | $/sf | Match |
|---|---|---|---|---|---|---|---|
| 3419 E 9th St | 0.14mi | 2/1.0 | 672 (+6%) | 24mo | $170,000 | $253 | 44 |
| 445 N Dearborn St | 0.52mi | 2/1.0 | 700 (+10%) | 18mo | $215,000 | $307 | 24 |
Match score weights: distance 35% · size 25% · config 20% · recency 20%. Top-matched comps best support the ARV.
Projected returns pro-forma
-3.0% appreciation · 7.31% rent growth · sell at horizon
- IRR
- 5.1%
- Equity multiple
- 1.21×
- Total profit
- $17,490
- Equity at exit
- $44,731
- IRR
- 18.2%
- Equity multiple
- 2.82×
- Total profit
- $153,021
- Equity at exit
- $25,939
Cash invested: $84,000 (down + closing). Projections, not guarantees.
Landlord ↔ Tenant lean methodology
- Overall (STATE)
- 90 Strongly Landlord-Friendly
- State Indiana
- 90 Strongly Landlord-Friendly · R+11
- County
- — inherits STATE
- City
- — inherits STATE
ZIP-level market 46201
- Home prices YoY
- -33.9%
- Rents YoY
- 7.3%
- Active inventory
- 480
- Price-to-rent
- 27.6×
Monthly cashflow live
- Estimated rent
- $3,628 high interval (Pro) →
- Mortgage (P&I)
- −$1,573
- Tax from tax record
- −$389 /mo · $4,665/yr
- Insurance
- −$125
- HOA
- −$0
- Vacancy / Maint / Mgmt
- −$762
- Net cashflow
- $779
Break-even live
4-unit breakdown (identical units grouped — click to expand)
| Units | Beds | Baths | Est. rent |
|---|---|---|---|
| 4× units | 1 | 1 | $3,628 |
| #1 | 1 | 1 | $907 |
| #2 | 1 | 1 | $907 |
| #3 | 1 | 1 | $907 |
| #4 | 1 | 1 | $907 |
| Total (4 units) | $3,628 | ||
UW: 25.0% down · 7.5% · 30yr · 1.5% tax · 5.0% vac · 8.0% maint · 8.0% mgmt
Financing live
Cash to close
- Down payment
- $75,000
- Closing costs
- $9,000
- Reserves months
- —
- Total cash needed
- —
Loan-product check · same deal, 3 products live
Conventional
25% down · 7.5% · 30yr
- Down + closing
- —
- Monthly P&I
- —
- Monthly cashflow
- —
- DSCR
- —
- Eligible?
- —
Personal DTI + credit; lowest rate.
DSCR
20% down · 8.5% · 30yr
- Down + closing
- —
- Monthly P&I
- —
- Monthly cashflow
- —
- DSCR
- —
- Eligible?
- —
No personal income docs; deal must DSCR.
Hard money
10% down · 12.0% · 12mo
- Down + closing
- —
- Monthly P&I
- —
- Monthly cashflow
- —
- DSCR
- —
- Eligible?
- —
Short-term bridge; refi at stabilization.
Rent comps 40 comps
| Address | Beds | Baths | Sqft | Rent | $/sqft | DOM | Units | Dist |
|---|---|---|---|---|---|---|---|---|
| 1028 N Olney St Unit 1030 Indianapolis, IN | 1.0 | 1.0 | 700 | $800 | $1.14 | 23d | 1 | 0.19mi |
| 1106 N Gale St Unit 1 Indianapolis, IN | 2.0 | 1.0 | 750 | $895 | $1.19 | 43d | 1 | 0.20mi |
| 821 N Bradley Ave Indianapolis, IN | 1.0 | 1.0 | 663 | $850 | $1.28 | 4d | 1 | 0.25mi |
| 1036 N Tuxedo St Indianapolis, IN | 1.0 | 1.0 | 646 | $750 | $1.16 | 4d | 1 | 0.25mi |
| 1301 N Olney St Unit 1303 Indianapolis, IN | 2.0 | 1.0 | 750 | $1,100 | $1.47 | 43d | 1 | 0.34mi |
| 927 N Chester Ave Indianapolis, IN | 1.0 | 1.0 | 596 | $750 | $1.26 | 43d | 1 | 0.35mi |
| 1114 N Dearborn St Indianapolis, IN | 1.0 | 1.0 | 646 | $795 | $1.23 | 44d | 1 | 0.39mi |
| 1306 N Chester Ave Indianapolis, IN | 1.0 | 1.0 | 600 | $800 | $1.33 | 20d | 1 | 0.43mi |
| 1358 N Gale St Indianapolis, IN | 1.0 | 1.0 | 550 | $890 | $1.62 | 16d | 1 | 0.43mi |
| 896 N Gladstone Ave Indianapolis, IN | 1.0 | 1.0 | 580 | $775 | $1.34 | 43d | 1 | 0.45mi |
| 1327 N Chester Ave Indianapolis, IN | 1.0 | 1.0 | 600 | $795 | $1.32 | 13d | 1 | 0.48mi |
| 412 N Bradley Ave Unit 3 Indianapolis, IN | 2.0 | 1.0 | 700 | $950 | $1.36 | 23d | 1 | 0.48mi |
| 833 N Gladstone Ave Indianapolis, IN | 1.0 | 1.0 | 687 | $825 | $1.20 | 23d | 1 | 0.48mi |
| 3709 Brookside Parkway South Dr Indianapolis, IN | 1.0 | 1.0 | 742 | $825 | $1.11 | 23d | 1 | 0.60mi |
| 628 N Oxford St Indianapolis, IN | 1.0 | 1.0 | 536 | $775 | $1.45 | 23d | 1 | 0.60mi |
| 810 N Euclid Ave Indianapolis, IN | 3.0 | 1.0 | 574 | $1,550 | $2.70 | 19d | 1 | 0.60mi |
| 1518 N Chester Ave Indianapolis, IN | 2.0 | 1.0 | 672 | $700 | $1.04 | 7d | 1 | 0.62mi |
| 1450 N Gladstone Ave Indianapolis, IN | 1.0 | 1.0 | 588 | $799 | $1.36 | 43d | 1 | 0.64mi |
| 1432 N Colorado Ave Indianapolis, IN | 1.0 | 1.0 | 584 | $875 | $1.50 | 23d | 1 | 0.65mi |
| 1538 N Grant Ave Indianapolis, IN | 1.0 | 1.0 | 375 | $700 | $1.87 | 43d | 1 | 0.67mi |
| 1531 N Grant Ave Indianapolis, IN | 1.0 | 1.0 | 611 | $875 | $1.43 | 23d | 1 | 0.68mi |
| 1510 N Gladstone Ave Indianapolis, IN | 1.0 | 1.0 | 570 | $765 | $1.34 | 43d | 1 | 0.68mi |
| 1512 N Gladstone Ave Unit 1510 1510 Indianapolis, IN | 1.0 | 1.0 | 570 | $830 | $1.46 | 14d | 1 | 0.68mi |
| 415 N Oxford St Indianapolis, IN | 1.0 | 1.0 | 580 | $650 | $1.12 | 23d | 1 | 0.68mi |
| 1315 N Rural St Indianapolis, IN | 1.0 | 1.0 | 700 | $1,000 | $1.43 | 4d | 1 | 0.70mi |
| 37 S Sherman Dr Indianapolis, IN | 1.0 | 1.0 | 700 | $800 | $1.14 | 23d | 1 | 0.84mi |
| 3058 Brookside Parkway North Dr Indianapolis, IN | 1.0 | 1.0 | 700 | $875 | $1.25 | 12d | 1 | 0.85mi |
| 2827 E 18th St Indianapolis, IN | 2.0 | 1.0 | 726 | $1,300 | $1.79 | 23d | 1 | 0.94mi |
| 1931 N Oxford St Indianapolis, IN | 1.0 | 1.0 | 616 | $875 | $1.42 | 3d | 1 | 1.04mi |
| 49 S Rural St Indianapolis, IN | 2.0 | 1.5 | 750 | $950 | $1.27 | 10d | 1 | 1.08mi |
| 4741 E Washington St Indianapolis, IN | 1.0 | 1.0 | 700 | $950 | $1.36 | 21d | 1 | 1.11mi |
| 621 Tecumseh St Indianapolis, IN | 2.0 | 1.0 | 726 | $1,025 | $1.41 | 43d | 1 | 1.13mi |
| 830 N Emerson Ave Indianapolis, IN | 1.0 | 1.0 | 560 | $850 | $1.52 | 43d | 1 | 1.15mi |
| 4815 E Washington St Unit 4815-10 Indianapolis, IN | 1.0 | 1.0 | 600 | $950 | $1.58 | 21d | 1 | 1.15mi |
| 4815 E Washington St Unit 4815-04 Indianapolis, IN | 1.0 | 1.0 | 600 | $895 | $1.49 | 43d | 1 | 1.15mi |
| 4815 E Washington St Unit 4815-12 Indianapolis, IN | 1.0 | 1.0 | 700 | $950 | $1.36 | 43d | 1 | 1.15mi |
| 2030 N Colorado Ave Indianapolis, IN | 2.0 | 1.0 | 728 | $1,150 | $1.58 | 23d | 1 | 1.15mi |
| 270 S Lasalle St Indianapolis, IN | 3.0 | 2.0 | 562 | $1,329 | $2.36 | 7d | 1 | 1.16mi |
| 2211 E New York St Unit B Indianapolis, IN | 1.0 | 1.0 | 650 | $725 | $1.12 | 21d | 1 | 1.17mi |
| 679 Woodruff Place East Dr Indianapolis, IN | 1.0 | 1.0 | 600 | $895 | $1.49 | 23d | 1 | 1.17mi |
Listing history 50 events
-
2026-06-18days on market $300,000 Active 79 DOM
-
2026-06-17days on market $300,000 Active 78 DOM
-
2026-06-16days on market $300,000 Active 77 DOM
-
2026-06-15days on market $300,000 Active 76 DOM
-
2026-06-13days on market $300,000 Active 74 DOM
-
2026-06-13days on market $300,000 Active 73 DOM
-
2026-06-09days on market $300,000 Active 70 DOM
-
2026-06-08days on market $300,000 Active 69 DOM
-
2026-06-07days on market $300,000 Active 68 DOM
-
2026-06-03days on market $300,000 Active 64 DOM
-
2026-06-02days on market $300,000 Active 63 DOM
-
2026-06-01days on market $300,000 Active 62 DOM
-
2026-05-31days on market $300,000 Active 61 DOM
-
2026-05-14status Active 709-char remark
Show marketing remark (709 chars)
Located at 933 N Ewing St on Indianapolis' near-eastside, this well-maintained four-plex offers a prime investment opportunity just minutes from downtown. Built in 1920, the property features four 1-bedroom, 1-bath units, with three currently leased for stable income and one recently updated unit ready for immediate occupancy. Units include updated flooring, appliances, and fresh paint, enhancing overall tenant appeal. With rental potential exceeding $4,500 per month, an unfinished basement for additional utility space, and convenient access to employment centers, dining, and entertainment, this property presents strong cash flow and long-term growth potential for investors. Seller pays all utilities
-
2026-04-09status Pending 709-char remark
Show marketing remark (709 chars)
Located at 933 N Ewing St on Indianapolis' near-eastside, this well-maintained four-plex offers a prime investment opportunity just minutes from downtown. Built in 1920, the property features four 1-bedroom, 1-bath units, with three currently leased for stable income and one recently updated unit ready for immediate occupancy. Units include updated flooring, appliances, and fresh paint, enhancing overall tenant appeal. With rental potential exceeding $4,500 per month, an unfinished basement for additional utility space, and convenient access to employment centers, dining, and entertainment, this property presents strong cash flow and long-term growth potential for investors. Seller pays all utilities
-
2026-02-24$300,000 Active 709-char remark
Show marketing remark (709 chars)
Located at 933 N Ewing St on Indianapolis' near-eastside, this well-maintained four-plex offers a prime investment opportunity just minutes from downtown. Built in 1920, the property features four 1-bedroom, 1-bath units, with three currently leased for stable income and one recently updated unit ready for immediate occupancy. Units include updated flooring, appliances, and fresh paint, enhancing overall tenant appeal. With rental potential exceeding $4,500 per month, an unfinished basement for additional utility space, and convenient access to employment centers, dining, and entertainment, this property presents strong cash flow and long-term growth potential for investors. Seller pays all utilities
-
2025-12-19historical
-
2025-12-19status Active
-
2025-10-30status Pending
-
2025-09-22$300,000 Active
-
2024-04-03soldstatus $190,000 Closed
-
2024-02-27status Pending
-
2024-02-23status Active
-
2024-01-29status Pending
-
2024-01-26$265,000 Active
-
2022-07-20soldstatus $100,000 Closed
-
2022-07-07status Pending
-
2022-06-17$110,000 Active
-
2022-05-20status Pending
-
2022-04-29status Active
-
2022-03-29status Pending
-
2022-03-19price $110,000
-
2022-03-10$115,000 Active
-
2021-11-02status Pending
-
2021-11-02historical
-
2021-10-27status Active
-
2021-10-26historical
-
2021-10-25status Pending
-
2021-10-18status Active
-
2021-10-18status Active
-
2021-10-18price $74,900
-
2021-10-18price $74,900
-
2021-10-13status Pending
-
2021-10-13status Pending
-
2021-09-23status Active
-
2021-09-23status Active
-
2021-08-30status Pending
-
2021-08-30status Pending
-
2021-08-24price $80,000
-
2021-08-24price $80,000
ⓘ Source: listings_history table (triggers on properties + properties_extension) + one-shot
backfill from property_details.listing_events for pre-trigger history.
Tax reassessment forecast IN · Partial reset (capped growth)
- Current annual tax
- $4,665 · $389/mo
- Projected year-2 tax
- $4,665 · $389/mo
- Expected delta
- $0/yr ($0/mo · 0.0%)
ⓘ Screening estimate from a state-policy table — verify with the county assessor before closing.
Climate risk First Street
- Flood 1/10 Low FEMA zone X (unshaded) · 0% chance over 30 yrs
- Wildfire 1/10 Low
- Heat 4/10 Moderate 7 d/yr ≥102°F today · 19 d/yr by 30 yrs out
- Wind 2/10 Low
- Air quality 4/10 Moderate 5 unhealthy d/yr today · 7 by 30 yrs out
Nearby sold comps map
Loading sold comps map…
Walkable amenities ~0.75 mi
Loading nearby amenities…
Taxation est. · year 1
- Rental income
- $43,536
- − Mortgage interest
- −$16,805
- − Property taxes
- −$4,665
- − Insurance
- −$1,500
- − Repairs & maintenance
- −$3,483
- − Management
- −$3,483
- − Depreciation
- −$8,727
- Taxable income
- $4,874
- Est. tax owed @ 24.0%
- −$1,170
- After-tax cash flow
- $8,180/yr
For passive investors: Depreciation is non-cash, so a rental often shows a tax loss while cash-flowing — sheltering income. Rental losses are passive: they offset passive income freely, and up to $25,000/yr can offset ordinary (W-2) income if you actively participate and your MAGI is under $100k (phasing out to $0 by $150k); unused losses carry forward. On sale, claimed depreciation is recaptured at up to 25%, and gains may owe capital-gains tax (a 1031 exchange can defer both). Figures are a year-1 estimate at your 24.0% rate — not tax advice; consult a CPA.
Schools (NCES district)
- District
- Indianapolis Public Schools
- NCES district ID
- 1804770
- Math proficiency
- 14% ▼ -7.00%
- Reading proficiency
- 20% ▼ -3.00%
- Median HH income
- $32,034
- Composite
- 13.69/100
- National rank
- #9499
- State rank
- #286 of 301 in IN
Livability — Indianapolis city (balance)
No livability data for this city. (Only ~50 U.S. cities are tracked.)
Census & demographics
- Census place
- Indianapolis city (balance), IN
- County
- Marion County · 998,460 people
- City population
- 881,119
- Metro
- Indianapolis-Carmel-Anderson, IN
- Population (ZIP)
- 30,335
- Household income
- $49,195
- Rent vs Own
- Severe rent burden
- 1906.0
Population outlook (Marion County) Hauer SSP2
- Today (2025)
- 1,025,572 people
- By 2030
- 1,065,727 · +3.9%
- By 2040
- 1,141,577 · +11.3%
- By 2050
- 1,208,920 · +17.9%
- By 2075
- 1,367,288 · +33.3%
- By 2100
- 1,438,201 · +40.2%
Race, ethnicity, and origin ACS 2023
- Neighborhood character
- Diverse neighborhood (Simpson 0.63)
- Race & ethnicity
- White 53% Hispanic / Latino 23% Black 18% Two or more races 9%
- Hispanic origin (detail)
- Mexican 14% Puerto Rican 2%
- Common ancestry
- Slovak 2% Lithuanian 2% Italian 1%
- Foreign-born
- 9% · Canada
- Languages at home
- 81% English-only · Spanish 17%
Political lean MEDSL · Marion
- 2024 margin
- Strong D (+27.7) · D 63.0% · R 35.3% · Other 1.7%
- 2008→2024 swing
- -0.7pp no change · 2008: 28.4pp · 2024: 27.7pp
- All cycles
- 2024: D+27.7 2020: D+29.1 2016: D+22.8 2012: D+22.2 2008: D+28.4
Not yet ingested
- Civics
- —
Market trends
- HPI YoY
- ▼ -192.51%
- Current HPI
- 375.0969
- Rent YoY
- ▲ 7.31%
- Metro
- Indianapolis-Carmel-Anderson, IN
- State GDP YoY
- ▲ 2.90%
- F500 in state
- 18
Industry mix (Fortune 500 HQ in IN)
| Industry | F500 HQs | Revenue |
|---|---|---|
| Industrial Machinery | 2 | $37B |
|
||
| Healthcare | 1 | $177B |
|
||
| Pharmaceuticals | 1 | $45B |
|
||
| Metals / Steel | 1 | $18B |
|
||
| Agriculture | 1 | $17B |
|
||
| Packaging | 1 | $12B |
|
||
Price history
+233.3% since first listed39 events — show timeline
- 2026-05-14 Relisted — MIBOR as Distributed by MLS Grid
- 2026-04-09 Pending — MIBOR as Distributed by MLS Grid
- 2026-02-24 Listed $300,000 MIBOR as Distributed by MLS Grid
- 2025-12-19 Listing Removed — MIBOR as Distributed by MLS Grid
- 2025-12-19 Relisted — MIBOR as Distributed by MLS Grid
- 2025-10-30 Pending — MIBOR as Distributed by MLS Grid
- 2025-09-22 Listed $300,000 MIBOR as Distributed by MLS Grid
- 2024-04-03 Sold (MLS) $190,000 MIBOR as Distributed by MLS Grid
- 2024-02-27 Pending — MIBOR as Distributed by MLS Grid
- 2024-02-23 Relisted — MIBOR as Distributed by MLS Grid
- 2024-01-29 Pending — MIBOR as Distributed by MLS Grid
- 2024-01-26 Listed $265,000 MIBOR as Distributed by MLS Grid
- 2022-07-20 Sold (MLS) $100,000 MIBOR as Distributed by MLS Grid
- 2022-07-07 Pending — MIBOR as Distributed by MLS Grid
- 2022-06-17 Listed $110,000 MIBOR as Distributed by MLS Grid
- 2022-05-20 Pending — MIBOR as Distributed by MLS Grid
- 2022-04-29 Relisted — MIBOR as Distributed by MLS Grid
- 2022-03-29 Pending — MIBOR as Distributed by MLS Grid
- 2022-03-19 Price Changed $110,000 MIBOR as Distributed by MLS Grid
- 2022-03-10 Listed $115,000 MIBOR as Distributed by MLS Grid
- 2021-11-02 Pending — MIBOR as Distributed by MLS Grid
- 2021-11-02 Listing Removed — MIBOR as Distributed by MLS Grid
- 2021-10-27 Relisted — MIBOR as Distributed by MLS Grid
- 2021-10-26 Listing Removed — MIBOR as Distributed by MLS Grid
- 2021-10-25 Pending — MIBOR as Distributed by MLS Grid
- 2021-10-18 Relisted — MIBOR as Distributed by MLS Grid
- 2021-10-18 Relisted — MIBOR as Distributed by MLS Grid
- 2021-10-18 Price Changed $74,900 MIBOR as Distributed by MLS Grid
- 2021-10-18 Price Changed $74,900 MIBOR as Distributed by MLS Grid
- 2021-10-13 Pending — MIBOR as Distributed by MLS Grid
- 2021-10-13 Pending — MIBOR as Distributed by MLS Grid
- 2021-09-23 Relisted — MIBOR as Distributed by MLS Grid
- 2021-09-23 Relisted — MIBOR as Distributed by MLS Grid
- 2021-08-30 Pending — MIBOR as Distributed by MLS Grid
- 2021-08-30 Pending — MIBOR as Distributed by MLS Grid
- 2021-08-24 Price Changed $80,000 MIBOR as Distributed by MLS Grid
- 2021-08-24 Price Changed $80,000 MIBOR as Distributed by MLS Grid
- 2021-08-17 Listed $90,000 MIBOR as Distributed by MLS Grid
- 2021-08-17 Listed $90,000 MIBOR as Distributed by MLS Grid
Property tax history
+20.8%/yrLatest (2025): $4,665 · +51.1% YoY. Source: county tax records.
Cash-flow waterfall
monthlySold comps — $/sqft
last 12 mo · ≤1 miLoading sold comps…