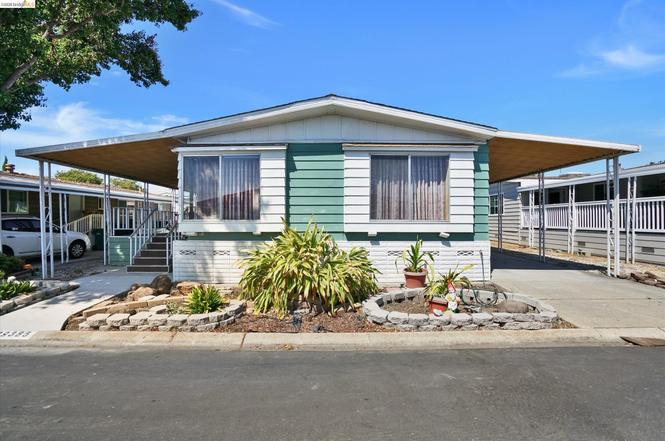
29385 Providence Way · Hayward, CA
Flood risk 5/10 · Moderate
- FEMA flood zone
- AH
- Chance of flooding over 30 yrs
- 0.24%
- Est. flood insurance / yr
- $1,142 – $2,507
Fire risk 1/10 · Minimal
- Est. fire insurance / yr
- $659 – $1,223
Heat risk 4/10 · Minor
- Hot days now (above 89°F)
- 7 days/yr
- Hot days in 30 yrs
- 14 days/yr
Wind risk 1/10 · Minimal
- Chance of severe wind over 30 yrs
- —
Air-quality risk 7/10 · Major
- Unhealthy air days now
- 12 days/yr
- Unhealthy air days in 30 yrs
- 12 days/yr
Risk factors via First Street. Map © Google.
Why this score? — see what drove the B+ grade
The composite is a weighted blend of 9 inputs, each scored 0–100. Each bar is that input's sub-score; the figure is the points it added to the 100-point composite (weight × sub-score).
- Cash flow +29.7/30.0
- ARV discount +15.0/15.0
- DSCR +10.0/10.0
- 1% rule +8.4/10.0
- Livability +3.8/5.0
- Rent growth +3.1/5.0
- Schools +3.1/10.0
- Condition / age +2.5/5.0
- Appreciation +0.0/10.0
$259,800
🖨 Deal sheet 📄 Offer letter ✓ Due diligence
Listing remarks
Spacious triple wide home in New England Village with 2bd/2ba & over 1,800sf of living space. Featuring open kitchen with large island & s/s appliances and a primary suite w/ huge closet and bathroom w/ dual vanities, soaking tub, & separate shower. Additional highlights include family room with bar area, separate dining area w/ built in hutch, laundry room with W/ D, recessed lighting, laminate flooring, large storage shed, & A/C. Enjoy the additional community amenities such as the pool, spa, & clubhouse just a few steps away. Don't miss this exceptional opportunity to enjoy the relaxed, comfortable, low-maintenance living in one of Hayward's most desirable 55+
Key facts
- Dual vanities
- Soaking tub
- Primary suite
Tags
Property features AI
Finance
- HOA & community: Senior community (New England Villa); Clubhouse; Community pool and spa; BBQ area; Recreation facilities and activities available; Close to golf course; Pets allowed (cats and dogs allowed with number/size limits and upon approval)
Exterior
- Parking: Carport (2 or more spaces); Covered tandem parking
- Utilities: Community in-ground pool; Heated spa
- Home design: Manufactured in park (mobile home); Triple wide model (Victoria Manor)
- Construction: Vinyl siding
- Exterior features: Carpeted patio/porch; Covered deck; Shed(s); Rectangular lot
Interior
- Kitchen: Stone countertops; Kitchen island; Dishwasher; Free-standing range; Refrigerator; Updated kitchen features; Wet bar
- Bedrooms: Includes 1 bedroom at street level; Primary bedroom suite on street level
- Flooring: Laminate flooring
- Bathrooms: Two full bathrooms; Primary bath with stall shower, tub with jets, and double vanity; Other bath with shower over tub
- Heating & cooling: Forced air heating; Central air conditioning; Ceiling fans
- Interior features: Updated kitchen; Wet bar; Dining area; Family room; Living room; Main entry; Laundry facility; Window screens and coverings
- Laundry & utility: Laundry room with washer and dryer; Washer included; Dryer included
Neighborhood map
What this means for you Summary
Snapshot
- This is a 2-bed/2.0-bath manufactured listed at $260k.
Deal economics
- At list price, monthly cash flow is $796 ($10k/yr) — positive.
- The deal already cash-flows at list — no discount required.
- Meets the 1% rule at list price ($3k rent vs $260k).
- Cap rate 10.7% vs local median 2.1% in Hayward — top-decile yield for the area; either an underpriced asset or a hidden risk that comps aren't pricing in. Stress-test before assuming the spread holds.
Location & tenants
- Location reads 75/100 on livability (#124 in CA, #4,294 nationally) — a middle-class / working-renter tenant base. Strengths: commute A+, employment A+, health & safety A+; Watch: schools D, crime F, cost of living F.
- Hayward Unified (urban): math 25% / reading 37% proficiency, ranked #935 of 1,400 in CA (top 67%) — families likely to look elsewhere, expect single-tenant / working-renter base with shorter leases; 61% free/reduced lunch — lower-income household profile, screen leases tightly.
- Market conditions: Rents rising (+2.6%/yr); 169 active listings in the ZIP; 11 comparable units currently listed for rent nearby; rentals leasing fast (median 4d on market — plan ~1-2 weeks tenant-placement turnaround); solid renter incomes; 1,742 units permitted in Alameda County in 2024 (856 in 5+ unit buildings).
- This rent runs 39% of the median local income ($108k/yr) — at the standard rent-burdened threshold; future hikes will face affordability resistance.
Forward outlook
- Local home prices are declining (-3.0%/yr); year-one equity from $2k of loan paydown is wiped out by about $8k of value loss. Plan a longer hold.
- Alameda County population projected at +34% by 2050 — long-run rental-demand tailwind backs the buy-and-hold thesis.
- At projected returns (-3.0% appreciation + 2.6% rent growth), your $73k cash investment doubles in ~10 years — after that, you're playing with house money.
Negotiation context
- Only 4 days on market — expect competitive offers; lowballing is unlikely to land.
- 2 sale attempts since 14y ago with the ask held roughly flat each time — persistent listings suggest the price (not the market) is what's stuck; bring a comps-based counter.
Risks & watch-outs
- Watch-outs: flood insurance adds $152/mo.
- Climate carrying-cost: in FEMA flood zone AH (mandatory federal flood insurance) — expect insurance premiums to compound above CPI over the hold.
Questions for the listing agent
- Built in 1978 — when were the roof, HVAC, electrical panel, plumbing, and water heater last replaced?
- What's the actual annual flood-insurance premium (NFIP or private), and is the property in a SFHA with mandatory coverage?
- Is there a deadline driving the sale (1031 exchange, divorce, estate, relocation)? That informs how much negotiation room exists.
- Schools are D-rated, which usually means shorter tenancies and higher turnover. Who's the typical renter profile here, and what's been the actual vacancy rate?
- Crime grade is F in this area — have there been break-ins, vandalism, or insurance claims at this property in the last 3 years? What carrier currently insures it and at what premium?
- What's the average days-on-market for RENTAL listings here right now (not sales)? A rising rental-DOM trend means longer vacancies and softer asking-rent achievability than the comps imply.
- What's the recent tenant-quality profile in this submarket — average credit score on applications, eviction rate, late-payment / NSF rate, and stable-employment percentage? A property-management company in the area should have these aggregated.
- How much new for-sale + rental construction is in the pipeline within 1–3 miles? Heavy new supply typically softens prices + rents 12–24 months out; constrained supply supports both.
Investment metrics
- 1% rule
- 1.34% ✓
- Cap rate
- 10.67%
- Cash-on-cash
- 15.64%
- DSCR
- 1.70
- GRM
- 6.2
CMA / ARV
- ARV (on-the-fly)
- $354,510
- Comps found
- 12
Show comp detail 12 sales within ~0.75 mi
| Address | Dist | Beds/Ba | Sqft | Sold | Price | $/sf | Match |
|---|---|---|---|---|---|---|---|
| 29372 Providence Way #111 | 0.02mi | 2/2.0 | 1,776 (-2%) | 3mo | $289,000 | $163 | 93 |
| 29341 Sandburg Way | 0.11mi | 3/2.0 (+1) | 1,856 (+2%) | 2mo | $425,000 | $229 | 84 |
| 29286 Whalebone Way | 0.23mi | 2/2.0 | 1,868 (+3%) | 4mo | $200,000 | $107 | 82 |
| 29223 Whalebone Way #404 | 0.35mi | 2/2.0 | 1,818 (0%) | 7mo | $220,000 | $121 | 78 |
| 29360 Middleborough Way #159 | 0.02mi | 2/2.0 | 1,670 (-8%) | 9mo | $345,000 | $207 | 78 |
| 29270 Sandburg Way #234 | 0.11mi | 2/2.0 | 1,683 (-7%) | 7mo | $345,000 | $205 | 76 |
| 29266 Nantucket Way | 0.21mi | 2/2.0 | 1,670 (-8%) | 1mo | $190,000 | $114 | 76 |
| 29330 Middleborough Way | 0.06mi | 3/3.0 (+1) | 1,640 (-10%) | 2mo | $319,000 | $195 | 70 |
| 29046 Rochester Way | 0.30mi | 2/2.0 | 1,600 (-12%) | 8mo | $267,000 | $167 | 60 |
| 1400 Buckingham Way | 0.34mi | 3/2.0 (+1) | 1,607 (-12%) | 6mo | $385,000 | $240 | 54 |
| 40 Ranchero Way #40 | 0.70mi | 2/2.0 | 1,728 (-5%) | 8mo | $289,000 | $167 | 52 |
| 1447 Buckingham Way | 0.55mi | 3/2.0 (+1) | 1,652 (-9%) | 9mo | $386,000 | $234 | 46 |
Match score weights: distance 35% · size 25% · config 20% · recency 20%. Top-matched comps best support the ARV.
Projected returns pro-forma
-3.0% appreciation · 2.58% rent growth · sell at horizon
- IRR
- 2.6%
- Equity multiple
- 1.10×
- Total profit
- $7,303
- Equity at exit
- $38,737
- IRR
- 11.8%
- Equity multiple
- 1.91×
- Total profit
- $66,313
- Equity at exit
- $22,463
Cash invested: $72,744 (down + closing). Projections, not guarantees.
Landlord ↔ Tenant lean methodology
- Overall (STATE)
- 18 Strongly Tenant-Friendly
- State California
- 18 Strongly Tenant-Friendly · D+13
- County
- — inherits STATE
- City
- — inherits STATE
ZIP-level market 94544
- Rents YoY
- 2.6%
- Active inventory
- 169
- Price-to-rent
- 6.2×
Monthly cashflow live
- Estimated rent
- $3,473 high interval (Pro) →
- Mortgage (P&I)
- −$1,362
- Tax est. 1.5%
- −$325 /mo · $3,897/yr
- Insurance
- −$108
- Flood insurance flood zone
- −$152 /mo · $1,824/yr
- HOA
- −$0
- Vacancy / Maint / Mgmt
- −$729
- Net cashflow
- $796
Break-even live
UW: 25.0% down · 7.5% · 30yr · 1.5% tax · 5.0% vac · 8.0% maint · 8.0% mgmt
Financing live
Cash to close
- Down payment
- $64,950
- Closing costs
- $7,794
- Reserves months
- —
- Total cash needed
- —
Loan-product check · same deal, 3 products live
Conventional
25% down · 7.5% · 30yr
- Down + closing
- —
- Monthly P&I
- —
- Monthly cashflow
- —
- DSCR
- —
- Eligible?
- —
Personal DTI + credit; lowest rate.
DSCR
20% down · 8.5% · 30yr
- Down + closing
- —
- Monthly P&I
- —
- Monthly cashflow
- —
- DSCR
- —
- Eligible?
- —
No personal income docs; deal must DSCR.
Hard money
10% down · 12.0% · 12mo
- Down + closing
- —
- Monthly P&I
- —
- Monthly cashflow
- —
- DSCR
- —
- Eligible?
- —
Short-term bridge; refi at stabilization.
Rent comps 11 comps
| Address | Beds | Baths | Sqft | Rent | $/sqft | DOM | Units | Dist |
|---|---|---|---|---|---|---|---|---|
| 111 Notion Way Hayward, CA | 3.0 | 2.5 | 1718 | $4,250 | $2.47 | 43d | 1 | 0.71mi |
| 28187 Karn Dr Hayward, CA | 3.0 | 2.5 | 1335 | $3,300 | $2.47 | 5d | 1 | 0.75mi |
| 206 Span Ct Hayward, CA | 3.0 | 3.5 | 1888 | $2,600 | $1.38 | 43d | 1 | 0.76mi |
| 29163 Dixon St Hayward, CA | 2.0–3.0 | 1.0–1.5 | 1100 | $2,995 | $2.72 | 1d | 5 | 0.86mi |
| 376 Line St Hayward, CA | 2.0 | 2.0 | 1286 | $3,500 | $2.72 | 1d | 1 | 0.91mi |
| 29384 Hub Ln Hayward, CA | 3.0 | 2.5 | 1684 | $3,950 | $2.35 | 1d | 1 | 0.97mi |
| 29384 Hub Ln Hayward, CA | 3.0 | 2.5 | 1684 | $3,950 | $2.35 | 3d | 1 | 0.97mi |
| 27703 Persimmon Dr Hayward, CA | 3.0 | 3.0 | 1549 | $3,695 | $2.39 | 43d | 1 | 1.17mi |
| 2901 Sorrento Way Union City, CA | 3.0 | 2.5 | 1869 | $5,000 | $2.68 | 1d | 1 | 1.24mi |
| 28168 Mission Blvd Hayward, CA | 1.0–3.0 | 1.0–2.0 | 1196 | $3,947 | $3.30 | 1d | 9 | 1.25mi |
| 981 Cheryl Ann Cir #40 Hayward, CA | 3.0 | 2.0 | 1245 | $3,800 | $3.05 | 43d | 1 | 1.31mi |
Listing history 5 events
-
2026-06-18days on market $259,800 Active 4 DOM
-
2026-06-17days on market $259,800 Active 3 DOM
-
2026-06-16days on market $259,800 Active 2 DOM
-
2026-06-15remarks 679-char remark
-
2026-06-15$259,800 Active 1 DOM
ⓘ Source: listings_history table (triggers on properties + properties_extension) + one-shot
backfill from property_details.listing_events for pre-trigger history.
Climate risk First Street
- Flood 5/10 Major FEMA zone AH · 24% chance over 30 yrs
- Wildfire 1/10 Low
- Heat 4/10 Moderate 7 d/yr ≥89°F today · 14 d/yr by 30 yrs out
- Wind 1/10 Low
- Air quality 7/10 Severe 12 unhealthy d/yr today · 12 by 30 yrs out
Nearby sold comps map
Loading sold comps map…
Walkable amenities ~0.75 mi
Loading nearby amenities…
Taxation est. · year 1
- Rental income
- $41,678
- − Mortgage interest
- −$14,553
- − Property taxes
- −$3,897
- − Insurance
- −$3,123
- − Repairs & maintenance
- −$3,334
- − Management
- −$3,334
- − Depreciation
- −$7,558
- Taxable income
- $5,878
- Est. tax owed @ 24.0%
- −$1,411
- After-tax cash flow
- $8,145/yr
For passive investors: Depreciation is non-cash, so a rental often shows a tax loss while cash-flowing — sheltering income. Rental losses are passive: they offset passive income freely, and up to $25,000/yr can offset ordinary (W-2) income if you actively participate and your MAGI is under $100k (phasing out to $0 by $150k); unused losses carry forward. On sale, claimed depreciation is recaptured at up to 25%, and gains may owe capital-gains tax (a 1031 exchange can defer both). Figures are a year-1 estimate at your 24.0% rate — not tax advice; consult a CPA.
Schools (NCES district)
- District
- Hayward Unified
- NCES district ID
- 0616740
- Math proficiency
- 25% ▼ -1.00%
- Reading proficiency
- 37% ▬ 0.00%
- Median HH income
- $65,326
- Composite
- 31.27/100
- National rank
- #11241
- State rank
- #935 of 1400 in CA
Livability — Hayward
- Score
- 75/100
- State rank
- #124
- US rank
- #4294
Category grades
Schools grade is shown separately in the Schools card above.
Census & demographics
- Census place
- Hayward, CA
- County
- Alameda County · 1,614,355 people
- City population
- 191,800
- Metro
- San Francisco-Oakland-Berkeley, CA
- Population (ZIP)
- 76,947
- Household income
- $107,785
- Rent vs Own
- Severe rent burden
- 2573.0
Population outlook (Alameda County) Hauer SSP2
- Today (2025)
- 1,928,884 people
- By 2030
- 2,069,146 · +7.3%
- By 2040
- 2,338,405 · +21.2%
- By 2050
- 2,586,608 · +34.1%
- By 2075
- 3,061,911 · +58.7%
- By 2100
- 3,234,133 · +67.7%
Race, ethnicity, and origin ACS 2023
- Neighborhood character
- Highly diverse neighborhood (Simpson 0.70)
- Race & ethnicity
- Hispanic / Latino 45% Asian 28% Two or more races 13% White 11% Black 7% Pacific Islander 4% Native American 1%
- Hispanic origin (detail)
- Mexican 33% Puerto Rican 1%
- Common ancestry
- Russian 1% Italian 1% Lithuanian 1%
- Foreign-born
- 46% · Canada, China, Vietnam
- Languages at home
- 34% English-only · Spanish 37% Tagalog/Filipino 8% Other Indo-European 7%
Political lean MEDSL · Alameda
- 2024 margin
- Solid D (+53.6) · D 74.6% · R 21.0% · Other 4.4%
- 2008→2024 swing
- -5.9pp toward R · 2008: 59.5pp · 2024: 53.6pp
- All cycles
- 2024: D+53.6 2020: D+62.5 2016: D+64.4 2012: D+59.8 2008: D+59.5
Not yet ingested
- Civics
- —
Market trends
- HPI YoY
- ▼ -907.12%
- Current HPI
- 315.6082
- Rent YoY
- ▲ 2.58%
- Metro
- San Francisco-Oakland-Berkeley, CA
- State GDP YoY
- ▲ 3.21%
- F500 in state
- 116
Industry mix (Fortune 500 HQ in CA)
| Industry | F500 HQs | Revenue |
|---|---|---|
| Technology | 27 | $1,492B |
|
||
| Financial Services | 3 | $174B |
|
||
| Retail | 3 | $44B |
|
||
| Insurance | 3 | $26B |
|
||
| Media / Entertainment | 2 | $115B |
|
||
| Pharmaceuticals / Biotech | 2 | $62B |
|
||
Price history
5 events — show timeline
- 2026-06-14 Listed $259,800 bridgeMLS, Bay East AOR, or Contra Costa AOR
- 2012-02-16 Listing Removed — bridgeMLS, Bay East AOR, or Contra Costa AOR
- 2012-02-06 Pending — bridgeMLS, Bay East AOR, or Contra Costa AOR
- 2012-01-14 Price Changed — bridgeMLS, Bay East AOR, or Contra Costa AOR
- 2012-01-13 Listed — bridgeMLS, Bay East AOR, or Contra Costa AOR
Cash-flow waterfall
monthlySold comps — $/sqft
last 12 mo · ≤1 miLoading sold comps…