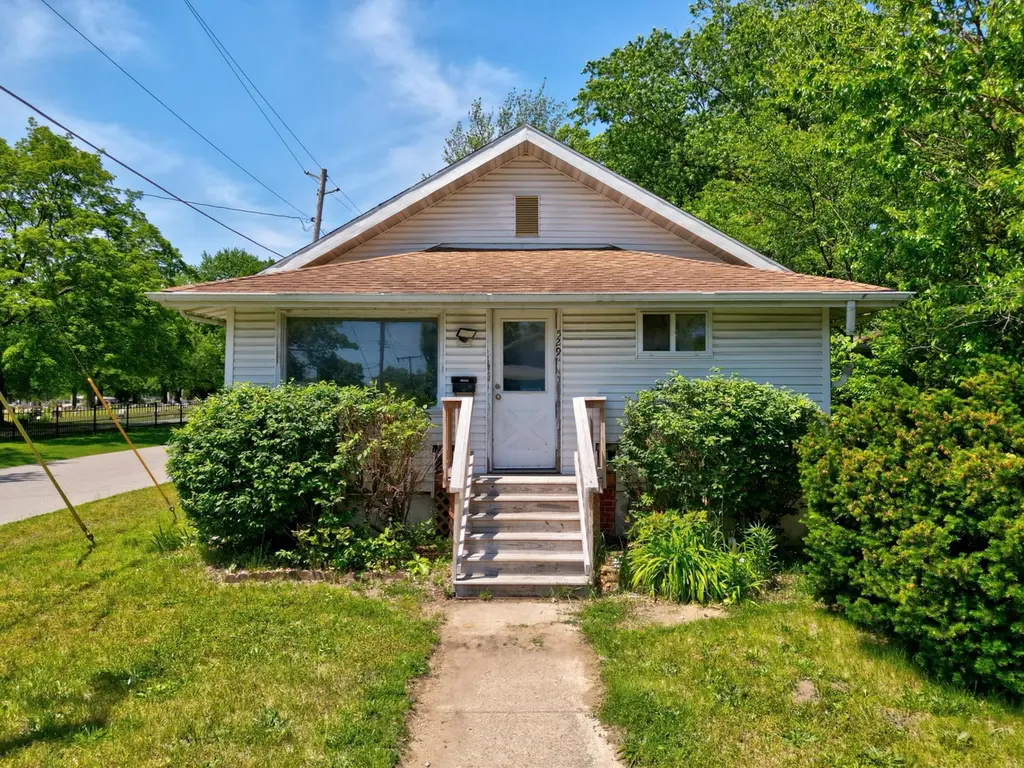
529 Jackson St · Michigan City, IN
Flood risk 4/10 · Minor
- FEMA flood zone
- X (unshaded)
- Chance of flooding over 30 yrs
- 0.22%
- Est. flood insurance / yr
- $473 – $860
Fire risk 1/10 · Minimal
- Est. fire insurance / yr
- $717 – $1,331
Heat risk 2/10 · Minimal
- Hot days now (above 100°F)
- 7 days/yr
- Hot days in 30 yrs
- 15 days/yr
Wind risk 2/10 · Minimal
- Chance of severe wind over 30 yrs
- —
Air-quality risk 3/10 · Minor
- Unhealthy air days now
- 2 days/yr
- Unhealthy air days in 30 yrs
- 3 days/yr
Risk factors via First Street. Map © Google.
Why this score? — see what drove the B+ grade
The composite is a weighted blend of 9 inputs, each scored 0–100. Each bar is that input's sub-score; the figure is the points it added to the 100-point composite (weight × sub-score).
- Cash flow +29.0/30.0
- ARV discount +15.0/15.0
- DSCR +10.0/10.0
- 1% rule +7.4/10.0
- Rent growth +4.9/5.0
- Livability +4.0/5.0
- Condition / age +2.5/5.0
- Schools +2.2/10.0
- Appreciation +0.0/10.0
$108,000
🖨 Deal sheet 📄 Offer letter ✓ Due diligence
Listing remarks
Looking for cash investors looking for a rehab or rental ! Important to Note the home on same block pending sale !! What an opportunity! Directly next to Greenwood cemetery- Currently a 2 bedroom but adding a 3rd may be possible! with 1000 square foot on the main level- AND an over sized living room & primary bedroom! Just under 2 miles from Washington park, Lake Michigan shoreline, the wonderful zoo and all things Michigan City has to offer! This home is vacant and can be closed fast! Would be a lucrative rental to add to any investors portfolio. Full basement has had the North wall completely rebuilt. This home is being sold as is- as seen!
Key facts
- Full basement
- North wall rebuilt
- 5,445 sq ft lot
Tags
Property features AI
Finance
- Other: Vacant occupant status
Exterior
- Parking: Off-street parking
- Utilities: Public water; Public sewer; Water connected
- Home design: One-story property; Built in 1880
- Construction: Unfinished basement
- Exterior features: City view; Chain link fencing
Interior
- Kitchen: Gas range; Range hood; Refrigerator
- Bedrooms: Primary bedroom; Second bedroom
- Flooring: Carpet flooring
- Bathrooms: 1 full bathroom; 1 half bathroom
- Heating & cooling: Forced air heating; Central air conditioning
- Interior features: No additional interior features listed; Basement is unfinished
- Laundry & utility: Washer; Dryer (laundry located on lower level)
Neighborhood map
What this means for you Summary
Snapshot
- This is a 3-bed/1.5-bath single-family listed at $108k.
Deal economics
- At list price, monthly cash flow is $369 ($4k/yr) — positive.
- The deal already cash-flows at list — no discount required.
- Meets the 1% rule at list price ($1k rent vs $108k).
- Recommended offer: $106k (1.5% below list) — sets the bar for market timing.
- Cap rate 10.4% vs local median 2.7% in Michigan City — top-decile yield for the area; either an underpriced asset or a hidden risk that comps aren't pricing in. Stress-test before assuming the spread holds.
Location & tenants
- Location reads 81/100 on livability (#15 in IN, #1,317 nationally) — a professional / high-income tenant draw. Strengths: commute A+, cost of living A+, housing A+; Watch: employment D, schools D-, amenities D-.
- Michigan City Area Schools (urban): math 23% / reading 28% proficiency, ranked #262 of 301 in IN (top 87%) — low school quality limits family demand, transient renter base, plan for 1-2y turnover; 68% free/reduced lunch — lower-income household profile, screen leases tightly.
- Market conditions: Rents rising fast (+9.7%/yr); 371 active listings in the ZIP; 7 comparable units currently listed for rent nearby; rentals lingering (median 44d on market — plan ~5-8 weeks vacancy on turnover, expect pricing pressure); 100% of comp listings sitting > 30 days — soft ceiling on asking rent; 216 units permitted in LaPorte County in 2024 (75 in 5+ unit buildings).
Forward outlook
- Local home prices are declining (-3.0%/yr); year-one equity from $747 of loan paydown is wiped out by about $3k of value loss. Plan a longer hold.
- LaPorte County population projected to shrink 7% by 2050 — rents likely to lag national; underwrite the cash flow, not the appreciation.
- At projected returns (-3.0% appreciation + 8.0% rent growth), your $30k cash investment doubles in ~6 years — after that, you're playing with house money.
Negotiation context
- It's been on market 20 days — a 2% lower offer ($106k) is reasonable based on typical stale-listing flexibility.
- 3 sale attempts since 27y ago; this cycle's ask has dropped $7k (6%) from the opening price — seller is motivated, your offer sets the floor, not the list.
- Current owner paid $34k; list at $108k implies a 218% gain — meaningful room to come down on a strong offer.
Risks & watch-outs
- Watch-outs: built in 1880 — expect roof / HVAC / electrical / plumbing capex.
Questions for the listing agent
- Built in 1880 — when were the roof, HVAC, electrical panel, plumbing, and water heater last replaced?
- Is there a deadline driving the sale (1031 exchange, divorce, estate, relocation)? That informs how much negotiation room exists.
- Schools are D-rated, which usually means shorter tenancies and higher turnover. Who's the typical renter profile here, and what's been the actual vacancy rate?
- What's the average days-on-market for RENTAL listings here right now (not sales)? A rising rental-DOM trend means longer vacancies and softer asking-rent achievability than the comps imply.
- What's the recent tenant-quality profile in this submarket — average credit score on applications, eviction rate, late-payment / NSF rate, and stable-employment percentage? A property-management company in the area should have these aggregated.
- How much new for-sale + rental construction is in the pipeline within 1–3 miles? Heavy new supply typically softens prices + rents 12–24 months out; constrained supply supports both.
Investment metrics
- 1% rule
- 1.24% ✓
- Cap rate
- 10.39%
- Cash-on-cash
- 14.64%
- DSCR
- 1.65
- GRM
- 6.7
CMA / ARV
- ARV (on-the-fly)
- $181,500
- Comps found
- 12
Show comp detail 12 sales within ~0.75 mi
| Address | Dist | Beds/Ba | Sqft | Sold | Price | $/sf | Match |
|---|---|---|---|---|---|---|---|
| 506 Jackson St | 0.05mi | 3/2.5 | 1,056 (-4%) | 8mo | $12,500 | $12 | 80 |
| 121 Faulknor St | 0.41mi | 3/1.5 | 1,040 (-6%) | 0mo | $155,000 | $149 | 71 |
| 624 Cleveland Ave | 0.30mi | 3/1.0 | 1,181 (+7%) | 1mo | $99,000 | $84 | 70 |
| 903 Greenwood Ave | 0.33mi | 3/1.0 | 1,008 (-8%) | 9mo | $167,000 | $166 | 62 |
| 726 Jackson St | 0.16mi | 3/1.5 | 1,254 (+14%) | 9mo | $175,000 | $140 | 62 |
| 629 Superior St | 0.48mi | 3/1.5 | 988 (-10%) | 0mo | $162,750 | $165 | 60 |
| 119 Dewey St | 0.37mi | 2/1.0 (-1) | 940 (-14%) | 0mo | $137,000 | $146 | 51 |
| 2941 Jackson St | 0.55mi | 3/1.0 | 988 (-10%) | 7mo | $167,600 | $170 | 49 |
| 817 E 11th St | 0.71mi | 3/1.0 | 1,000 (-9%) | 1mo | $165,000 | $165 | 49 |
| 715 Pearl St | 0.47mi | 2/1.0 (-1) | 953 (-13%) | 0mo | $168,750 | $177 | 48 |
| 165 Indian Rdg Dr #165 | 0.55mi | 2/2.0 (-1) | 1,180 (+7%) | 8mo | $218,000 | $185 | 48 |
| 506 Tremont St | 0.67mi | 3/1.5 | 1,248 (+14%) | 9mo | $183,000 | $147 | 39 |
Match score weights: distance 35% · size 25% · config 20% · recency 20%. Top-matched comps best support the ARV.
Projected returns pro-forma
-3.0% appreciation · 8.0% rent growth · sell at horizon
- IRR
- 10.4%
- Equity multiple
- 1.43×
- Total profit
- $13,067
- Equity at exit
- $16,103
- IRR
- 23.1%
- Equity multiple
- 3.44×
- Total profit
- $73,840
- Equity at exit
- $9,338
Cash invested: $30,240 (down + closing). Projections, not guarantees.
Landlord ↔ Tenant lean methodology
- Overall (STATE)
- 90 Strongly Landlord-Friendly
- State Indiana
- 90 Strongly Landlord-Friendly · R+11
- County
- — inherits STATE
- City
- — inherits STATE
ZIP-level market 46360
- Rents YoY
- 9.7%
- Active inventory
- 371
- Price-to-rent
- 6.7×
Monthly cashflow live
- Estimated rent
- $1,342 high interval (Pro) →
- Mortgage (P&I)
- −$566
- Tax from tax record
- −$80 /mo · $955/yr
- Insurance
- −$45
- HOA
- −$0
- Vacancy / Maint / Mgmt
- −$282
- Net cashflow
- $369
Break-even live
UW: 25.0% down · 7.5% · 30yr · 1.5% tax · 5.0% vac · 8.0% maint · 8.0% mgmt
Financing live
Cash to close
- Down payment
- $27,000
- Closing costs
- $3,240
- Reserves months
- —
- Total cash needed
- —
Loan-product check · same deal, 3 products live
Conventional
25% down · 7.5% · 30yr
- Down + closing
- —
- Monthly P&I
- —
- Monthly cashflow
- —
- DSCR
- —
- Eligible?
- —
Personal DTI + credit; lowest rate.
DSCR
20% down · 8.5% · 30yr
- Down + closing
- —
- Monthly P&I
- —
- Monthly cashflow
- —
- DSCR
- —
- Eligible?
- —
No personal income docs; deal must DSCR.
Hard money
10% down · 12.0% · 12mo
- Down + closing
- —
- Monthly P&I
- —
- Monthly cashflow
- —
- DSCR
- —
- Eligible?
- —
Short-term bridge; refi at stabilization.
Rent comps 7 comps
| Address | Beds | Baths | Sqft | Rent | $/sqft | DOM | Units | Dist |
|---|---|---|---|---|---|---|---|---|
| 1810 E Barker Ave Michigan City, IN | 1.0–2.0 | 1.0 | 900 | $1,250 | $1.39 | 43d | 1 | 0.35mi |
| 121 S Porter St Unit A Michigan City, IN | 2.0 | 2.0 | 1050 | $925 | $0.88 | 43d | 1 | 0.40mi |
| 215 N Woodland Ave Michigan City, IN | 3.0 | 1.0 | 1112 | $1,395 | $1.25 | 43d | 1 | 0.51mi |
| 910 S Carroll Ave Michigan City, IN | 2.0–3.0 | 2.0 | 1187 | $1,600 | $1.35 | 43d | 3 | 0.72mi |
| 614 N Calumet Ave Michigan City, IN | 3.0 | 1.0 | 825 | $1,450 | $1.76 | 43d | 1 | 0.89mi |
| 416 E 9th St Unit 2 Michigan City, IN | 3.0 | 2.0 | 1400 | $1,325 | $0.95 | 43d | 1 | 1.00mi |
| 106 Ruby Ct Michigan City, IN | 2.0 | 1.0 | 744 | $1,195 | $1.61 | 43d | 1 | 1.23mi |
Listing history 18 events
-
2026-06-19days on market $108,000 Active 20 DOM
-
2026-06-18days on market $108,000 Active 19 DOM
-
2026-06-17remarks 667-char remark
-
2026-06-17price $108,000 Active 18 DOM
-
2026-06-17days on market $115,000 Active 18 DOM
-
2026-06-16days on market $115,000 Active 17 DOM
-
2026-06-15days on market $115,000 Active 16 DOM
-
2026-06-14days on market $115,000 Active 14 DOM
-
2026-06-13days on market $115,000 Active 13 DOM
-
2026-06-10days on market $115,000 Active 11 DOM
-
2026-06-09days on market $115,000 Active 10 DOM
-
2026-06-08days on market $115,000 Active 9 DOM
-
2026-06-07days on market $115,000 Active 8 DOM
-
2026-06-03days on market $115,000 Active 4 DOM
-
2026-06-02days on market $115,000 Active 3 DOM
-
2026-06-01days on market $115,000 Active 2 DOM
-
2026-05-30remarks 542-char remark
-
2026-05-30$115,000 Active 1 DOM
ⓘ Source: listings_history table (triggers on properties + properties_extension) + one-shot
backfill from property_details.listing_events for pre-trigger history.
Tax reassessment forecast IN · Partial reset (capped growth)
- Current annual tax
- $955 · $80/mo
- Projected year-2 tax
- $955 · $80/mo
- Expected delta
- $0/yr ($0/mo · 0.0%)
ⓘ Screening estimate from a state-policy table — verify with the county assessor before closing.
Climate risk First Street
- Flood 4/10 Moderate FEMA zone X (unshaded) · 22% chance over 30 yrs
- Wildfire 1/10 Low
- Heat 2/10 Low 7 d/yr ≥100°F today · 15 d/yr by 30 yrs out
- Wind 2/10 Low
- Air quality 3/10 Moderate 2 unhealthy d/yr today · 3 by 30 yrs out
Nearby sold comps map
Loading sold comps map…
Walkable amenities ~0.75 mi
Loading nearby amenities…
Taxation est. · year 1
- Rental income
- $16,098
- − Mortgage interest
- −$6,050
- − Property taxes
- −$955
- − Insurance
- −$540
- − Repairs & maintenance
- −$1,288
- − Management
- −$1,288
- − Depreciation
- −$3,142
- Taxable income
- $2,836
- Est. tax owed @ 24.0%
- −$681
- After-tax cash flow
- $3,746/yr
For passive investors: Depreciation is non-cash, so a rental often shows a tax loss while cash-flowing — sheltering income. Rental losses are passive: they offset passive income freely, and up to $25,000/yr can offset ordinary (W-2) income if you actively participate and your MAGI is under $100k (phasing out to $0 by $150k); unused losses carry forward. On sale, claimed depreciation is recaptured at up to 25%, and gains may owe capital-gains tax (a 1031 exchange can defer both). Figures are a year-1 estimate at your 24.0% rate — not tax advice; consult a CPA.
Schools (NCES district)
- District
- Michigan City Area Schools
- NCES district ID
- 1806570
- Math proficiency
- 23% ▼ -16.00%
- Reading proficiency
- 28% ▼ -10.00%
- Median HH income
- $42,629
- Composite
- 21.76/100
- National rank
- #8257
- State rank
- #262 of 301 in IN
Livability — Michigan City
- Score
- 81/100
- State rank
- #15
- US rank
- #1317
Category grades
Schools grade is shown separately in the Schools card above.
Census & demographics
- Census place
- Michigan City, IN
- County
- La Porte County · 88,580 people
- City population
- 43,817
- Metro
- Michigan City-La Porte, IN
- Population (ZIP)
- 43,817
- Household income
- $59,266
- Rent vs Own
- Severe rent burden
- 1152.0
Population outlook (LaPorte County) Hauer SSP2
- Today (2025)
- 109,757 people
- By 2030
- 108,288 · -1.3%
- By 2040
- 105,070 · -4.3%
- By 2050
- 102,330 · -6.8%
- By 2075
- 97,009 · -11.6%
- By 2100
- 86,459 · -21.2%
Race, ethnicity, and origin ACS 2023
- Neighborhood character
- Predominantly White (67%)
- Race & ethnicity
- White 67% Black 20% Hispanic / Latino 8% Two or more races 7%
- Hispanic origin (detail)
- Mexican 5%
- Common ancestry
- Romanian 11% Lithuanian 2% Iranian 1%
- Foreign-born
- 3% · Canada
- Languages at home
- 95% English-only · Spanish 3%
Political lean MEDSL · LaPorte
- 2024 margin
- R (+14.1) · D 42.1% · R 56.2% · Other 1.7%
- 2008→2024 swing
- -19.1pp toward R · 2008: 5.0pp · 2024: -14.1pp
- All cycles
- 2024: R+14.1 2020: R+7.2 2016: R+6.4 2012: D+12.6 2008: D+5.0
Not yet ingested
- Civics
- —
Market trends
- HPI YoY
- ▼ -210.27%
- Current HPI
- 206.0882
- Rent YoY
- ▲ 9.72%
- Metro
- Michigan City-La Porte, IN
- State GDP YoY
- ▲ 2.90%
- F500 in state
- 18
Industry mix (Fortune 500 HQ in IN)
| Industry | F500 HQs | Revenue |
|---|---|---|
| Industrial Machinery | 2 | $37B |
|
||
| Healthcare | 1 | $177B |
|
||
| Pharmaceuticals | 1 | $45B |
|
||
| Metals / Steel | 1 | $18B |
|
||
| Agriculture | 1 | $17B |
|
||
| Packaging | 1 | $12B |
|
||
Price history
+238.2% since first listed5 events — show timeline
- 2026-05-30 Listed $115,000 NIRA MLS as Distributed by MLS Grid
- 2000-03-24 Listed $69,000 NIRA MLS as Distributed by MLS Grid
- 2000-02-28 Listing Removed — NIRA MLS as Distributed by MLS Grid
- 1999-08-17 Listed $69,000 NIRA MLS as Distributed by MLS Grid
- 1998-02-24 Sold (Public Records) $34,000 Public Records
Property tax history
+9.8%/yrLatest (2024): $955 · +4.6% YoY. Source: county tax records.
Cash-flow waterfall
monthlySold comps — $/sqft
last 12 mo · ≤1 miLoading sold comps…