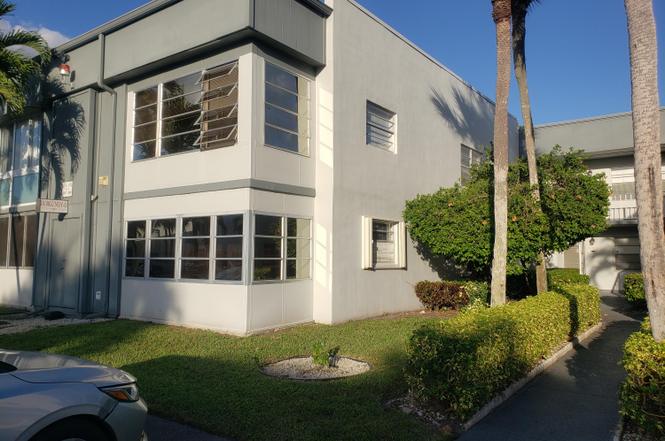
688 Burgundy O · Delray Beach, FL
Flood risk 1/10 · Minimal
- FEMA flood zone
- X (unshaded)
- Chance of flooding over 30 yrs
- 0.0%
- Est. flood insurance / yr
- $507 – $1,088
Fire risk 1/10 · Minimal
- Est. fire insurance / yr
- $947 – $1,759
Heat risk 9/10 · Severe
- Hot days now (above 106°F)
- 7 days/yr
- Hot days in 30 yrs
- 26 days/yr
Wind risk 10/10 · Severe
- Chance of severe wind over 30 yrs
- 99.0%
Air-quality risk 3/10 · Minor
- Unhealthy air days now
- 2 days/yr
- Unhealthy air days in 30 yrs
- 3 days/yr
Risk factors via First Street. Map © Google.
Why this score? — see what drove the B grade
The composite is a weighted blend of 9 inputs, each scored 0–100. Each bar is that input's sub-score; the figure is the points it added to the 100-point composite (weight × sub-score).
- Cash flow +30.0/30.0
- 1% rule +10.0/10.0
- DSCR +10.0/10.0
- ARV discount +7.5/15.0
- Schools +4.3/10.0
- Livability +3.9/5.0
- Rent growth +3.6/5.0
- Condition / age +2.5/5.0
- Appreciation +0.0/10.0
$69,000
🖨 Deal sheet 📄 Offer letter ✓ Due diligence
Listing remarks
1st Floor Move in Ready Condo with Glass Enclosed Florida Room with Brand New AC System and Water Heater, only steps to the Burgundy Pool Area, it's almost like having a Pool in your back yard. Kings Point is an active 55+ community offering, Local Area Buse service around the community and local shopping and medical offices. 1250 Seat Theater | 3 Multi-Million Dollar Club Houses | Tennis | Pickleball | Bocce Ball | to name a few as part the monthly Association Fees. There are also two 18 Hole Golf Courses One Executive and one par 3 Course designed by Arnold Palmer with very reasonable Green Fees that include Carts. Kings Point is also minutes away from city of Delray Fine Dining and Beach
Key facts
- Burgundy pool area
- Water heater
- Brand new ac system
Tags
Property features AI
Finance
- Other: Senior community; Pets not allowed; Community contains many units
- Financial info: Monthly association fee listed (amount provided in listing)
- HOA & community: Community association with monthly HOA fee; HOA amenities include: clubhouse, fitness center, indoor pool, outdoor pool, tennis courts, pickleball courts, shuffleboard court, bocce ball, basketball court, putting green, golf course, billiard room, library, café/restaurant, picnic area, courtesy bus, street lights
Exterior
- Parking: Assigned parking space; One open parking space
- Security: Gated community with guard; Security patrol
- Utilities: Public water; Public sewer; Three-phase electric; Cable available
- Home design: Condominium; Multi-level (split) layout; East-facing; Two stories total; Resale property
- Construction: Concrete/CBS construction
- Exterior features: Porch (glass-enclosed)
Interior
- Kitchen: Electric range; Refrigerator
- Bedrooms: One main-level bedroom
- Flooring: Ceramic tile; Vinyl
- Bathrooms: One full bathroom; One half bathroom
- Heating & cooling: Central heating; Central air conditioning
- Interior features: No special interior features listed; Single-hung metal windows
- Laundry & utility: No laundry appliances listed
Neighborhood map
What this means for you Summary
Snapshot
- This is a 1-bed/1.5-bath condo listed at $69k.
Deal economics
- At list price, monthly cash flow is $440 ($5k/yr) — positive.
- The deal already cash-flows at list — no discount required.
- Meets the 1% rule at list price ($2k rent vs $69k).
- Recommended offer: $61k (12.0% below list) — sets the bar for market timing.
- Cap rate 13.9% vs local median 4.3% in Delray Beach — top-decile yield for the area; either an underpriced asset or a hidden risk that comps aren't pricing in. Stress-test before assuming the spread holds.
Location & tenants
- Location reads 77/100 on livability (#202 in FL, #3,160 nationally) — a middle-class / working-renter tenant base. Strengths: housing A+, health & safety A+, commute A-; Watch: cost of living C-, crime D-, amenities F.
- Palm Beach (suburban): math 46% / reading 53% proficiency, ranked #34 of 73 in FL (top 47%) — families likely to look elsewhere, expect single-tenant / working-renter base with shorter leases.
- Market conditions: Rents rising fast (+4.3%/yr); 546 active listings in the ZIP; 40 comparable units currently listed for rent nearby; rentals at typical pace (median 25d on market — plan ~3-4 weeks tenant-placement turnaround); 3,974 units permitted in Palm Beach County in 2024 (1,012 in 5+ unit buildings).
- This rent runs 38% of the median local income ($62k/yr) — at the standard rent-burdened threshold; future hikes will face affordability resistance.
Forward outlook
- Local home prices are declining (-3.0%/yr); year-one equity from $477 of loan paydown is wiped out by about $2k of value loss. Plan a longer hold.
- Palm Beach County population projected at +30% by 2050 — long-run rental-demand tailwind backs the buy-and-hold thesis.
- At projected returns (-3.0% appreciation + 4.3% rent growth), your $19k cash investment doubles in ~5 years — after that, you're playing with house money.
Negotiation context
- It's been on market 202 days — a 12% lower offer ($61k) is reasonable based on typical stale-listing flexibility.
- 8 sale attempts since 27y ago; this cycle's ask is 5208% above the opening price — seller raised mid-cycle; expect resistance to lowballs.
- Current owner paid $47k; 47% above their basis — modest negotiation headroom, anchor on the comps not their cost.
Risks & watch-outs
- Watch-outs: HOA is 31% of rent.
- Climate carrying-cost: severe wind risk, 99% chance of damaging wind over 30y; extreme-heat days projected 7→26/yr by 2055 (HVAC capex compounding) — expect insurance premiums to compound above CPI over the hold.
Questions for the listing agent
- It's been on market 202 days. Have you received any prior offers? Is the seller open to a 12% concession, seller financing, or rate buy-down credit?
- Built in 1979 — when were the roof, HVAC, electrical panel, plumbing, and water heater last replaced?
- What does the HOA fee cover, when was the last increase, and are there any pending special assessments or reserve-fund shortfalls?
- Any open or pending special assessments — roof, HVAC, plumbing, elevator, façade? What's the per-unit balance and payoff schedule, and is the seller paying it off at close or rolling it to the buyer?
- Why hasn't it sold? Are there any deal-killer items the seller is aware of (foundation, flood, title, zoning, code violations)?
- Is there a deadline driving the sale (1031 exchange, divorce, estate, relocation)? That informs how much negotiation room exists.
- Schools are B-rated — typically a magnet for longer-tenancy family renters. What's the average tenant stay here, and is there a school-zone premium baked into asking?
- Crime grade is D in this area — have there been break-ins, vandalism, or insurance claims at this property in the last 3 years? What carrier currently insures it and at what premium?
- What's the average days-on-market for RENTAL listings here right now (not sales)? A rising rental-DOM trend means longer vacancies and softer asking-rent achievability than the comps imply.
- What's the recent tenant-quality profile in this submarket — average credit score on applications, eviction rate, late-payment / NSF rate, and stable-employment percentage? A property-management company in the area should have these aggregated.
- How much new apartment / multifamily construction is in the pipeline within 1–3 miles? Heavy new supply (>2% of stock underway) typically softens rents 12–24 months out; light construction supports rent growth.
Investment metrics
- 1% rule
- 2.84% ✓
- Cap rate
- 13.94%
- Cash-on-cash
- 27.32%
- DSCR
- 2.22
- GRM
- 2.9
CMA / ARV
No comps found within radius.
Projected returns pro-forma
-3.0% appreciation · 4.28% rent growth · sell at horizon
- IRR
- 24.1%
- Equity multiple
- 2.03×
- Total profit
- $19,805
- Equity at exit
- $10,288
- IRR
- 33.4%
- Equity multiple
- 4.40×
- Total profit
- $65,776
- Equity at exit
- $5,966
Cash invested: $19,320 (down + closing). Projections, not guarantees.
Landlord ↔ Tenant lean methodology
- Overall (STATE)
- 87 Strongly Landlord-Friendly
- State Florida
- 87 Strongly Landlord-Friendly · R+3
- County
- — inherits STATE
- City
- — inherits STATE
ZIP-level market 33484
- Rents YoY
- 4.3%
- Active inventory
- 546
- Price-to-rent
- 2.9×
Monthly cashflow live
- Estimated rent
- $1,959 high interval (Pro) →
- Mortgage (P&I)
- −$362
- Tax from tax record
- −$112 /mo · $1,347/yr
- Insurance
- −$29
- HOA
- −$605
- Vacancy / Maint / Mgmt
- −$411
- Net cashflow
- $440
Break-even live
UW: 25.0% down · 7.5% · 30yr · 1.5% tax · 5.0% vac · 8.0% maint · 8.0% mgmt
Financing live
Cash to close
- Down payment
- $17,250
- Closing costs
- $2,070
- Reserves months
- —
- Total cash needed
- —
Loan-product check · same deal, 3 products live
Conventional
25% down · 7.5% · 30yr
- Down + closing
- —
- Monthly P&I
- —
- Monthly cashflow
- —
- DSCR
- —
- Eligible?
- —
Personal DTI + credit; lowest rate.
DSCR
20% down · 8.5% · 30yr
- Down + closing
- —
- Monthly P&I
- —
- Monthly cashflow
- —
- DSCR
- —
- Eligible?
- —
No personal income docs; deal must DSCR.
Hard money
10% down · 12.0% · 12mo
- Down + closing
- —
- Monthly P&I
- —
- Monthly cashflow
- —
- DSCR
- —
- Eligible?
- —
Short-term bridge; refi at stabilization.
Rent comps 40 comps
| Address | Beds | Baths | Sqft | Rent | $/sqft | DOM | Units | Dist |
|---|---|---|---|---|---|---|---|---|
| 812 Burgundy Q Delray Beach, FL | 2.0 | 2.0 | 907 | $1,799 | $1.98 | 24d | 1 | 0.07mi |
| 416 Burgundy N Unit I Delray Beach, FL | 1.0 | 1.5 | 760 | $2,100 | $2.76 | 24d | 1 | 0.09mi |
| 519 Burgundy K Delray Beach, FL | 1.0 | 1.5 | 760 | $2,400 | $3.16 | 24d | 1 | 0.09mi |
| 548 Burgundy L Delray Beach, FL | 2.0 | 2.0 | 902 | $1,900 | $2.11 | 7d | 1 | 0.09mi |
| 767 Burgundy P Delray Beach, FL | 2.0 | 2.0 | 902 | $1,550 | $1.72 | 24d | 1 | 0.09mi |
| 313 Burgundy G Delray Beach, FL | 2.0 | 2.0 | 907 | $2,050 | $2.26 | 24d | 1 | 0.09mi |
| 998 Normandy Trl Unit 998 Delray Beach, FL | 2.0 | 2.0 | 907 | $1,800 | $1.98 | 15d | 1 | 0.10mi |
| 998 Normandy Trl Unit 998 Delray Beach, FL | 2.0 | 2.0 | 907 | $1,800 | $1.98 | 24d | 1 | 0.10mi |
| 481 Burgundy K Delray Beach, FL | 2.0 | 2.0 | 902 | $1,700 | $1.88 | 24d | 1 | 0.17mi |
| 949 Normandy Trl Unit 949 Delray Beach, FL | 2.0 | 2.0 | 907 | $3,500 | $3.86 | 24d | 1 | 0.18mi |
| 930 Normandy T Delray Beach, FL | 1.0 | 1.5 | 760 | $2,800 | $3.68 | 7d | 1 | 0.20mi |
| 5220 Las Verdes Cir #101 Delray Beach, FL | 2.0 | 2.0 | 876 | $1,950 | $2.23 | 5d | 1 | 0.21mi |
| 542 Normandy Ln Unit 542 Delray Beach, FL | 2.0 | 2.0 | 907 | $1,600 | $1.76 | 24d | 1 | 0.21mi |
| 5220 Las Verdes Cir Delray Beach, FL | 2.0 | 2.0 | 963 | $1,825 | $1.90 | 22d | 2 | 0.22mi |
| 468 Capri J Delray Beach, FL | 2.0 | 2.0 | 910 | $1,400 | $1.54 | 24d | 1 | 0.23mi |
| 5190 Las Verdes Cir #315 Delray Beach, FL | 2.0 | 2.0 | 930 | $2,000 | $2.15 | 7d | 1 | 0.24mi |
| 66 Capri B #66 Delray Beach, FL | 2.0 | 2.0 | 910 | $2,000 | $2.20 | 18d | 1 | 0.24mi |
| 115 Capri B Unit 115 Delray Beach, FL | 2.0 | 2.0 | 1044 | $2,000 | $1.92 | 24d | 1 | 0.27mi |
| 66 Capri B Unit B Delray Beach, FL | 2.0 | 2.0 | 910 | $2,000 | $2.20 | 14d | 1 | 0.27mi |
| 509 Capri Dr Unit 509 Delray Beach, FL | 2.0 | 2.0 | 910 | $2,500 | $2.75 | 2d | 1 | 0.28mi |
| 507 Capri Dr Delray Beach, FL | 2.0 | 2.0 | 910 | $2,200 | $2.42 | 24d | 1 | 0.28mi |
| 39 Burgundy a Delray Beach, FL | 2.0 | 2.0 | 902 | $1,400 | $1.55 | 24d | 1 | 0.29mi |
| 5299 Copperleaf Cir Delray Beach, FL | 2.0 | 2.0 | 1070 | $2,000 | $1.87 | 24d | 1 | 0.29mi |
| 452 Normandy J Delray Beach, FL | 2.0 | 2.0 | 907 | $1,600 | $1.76 | 24d | 1 | 0.30mi |
| 452 Normandy J Unit J Delray Beach, FL | 2.0 | 2.0 | 907 | $1,600 | $1.76 | 24d | 1 | 0.30mi |
| 207 Capri E #207 Delray Beach, FL | 2.0 | 2.0 | 910 | $1,700 | $1.87 | 7d | 1 | 0.30mi |
| 29 Burgundy a Delray Beach, FL | 2.0 | 2.0 | 902 | $1,800 | $2.00 | 24d | 1 | 0.31mi |
| 98 Capri C Delray Beach, FL | 1.0 | 1.5 | 795 | $1,695 | $2.13 | 24d | 1 | 0.33mi |
| 595 Normandy M Delray Beach, FL | 2.0 | 2.0 | 907 | $1,750 | $1.93 | 24d | 1 | 0.33mi |
| 5310 Las Verdes Cir #106 Delray Beach, FL | 2.0 | 2.0 | 1050 | $1,900 | $1.81 | 24d | 1 | 0.34mi |
| 522 Capri K Unit K Delray Beach, FL | 1.0 | 1.5 | 730 | $1,350 | $1.85 | 24d | 1 | 0.35mi |
| 5130 Las Verdes Cir #101 Delray Beach, FL | 2.0 | 2.0 | 1030 | $1,825 | $1.77 | 24d | 1 | 0.36mi |
| 15235 Lakes of Delray Blvd #299 Delray Beach, FL | 2.0 | 2.0 | 900 | $1,975 | $2.19 | 18d | 1 | 0.37mi |
| 974 Normandy Trl #974 Delray Beach, FL | 2.0 | 2.0 | 907 | $1,800 | $1.98 | 24d | 1 | 0.39mi |
| 556 Capri L Unit L Delray Beach, FL | 2.0 | 2.0 | 910 | $1,575 | $1.73 | 24d | 1 | 0.39mi |
| 560 Capri Ln Delray Beach, FL | 1.0 | 1.5 | 760 | $1,500 | $1.97 | 24d | 1 | 0.40mi |
| 794 Normandy Q Delray Beach, FL | 2.0 | 2.0 | 907 | $1,800 | $1.98 | 17d | 1 | 0.44mi |
| 120 Normandy C Delray Beach, FL | 1.0 | 1.5 | 760 | $1,495 | $1.97 | 7d | 1 | 0.46mi |
| 15109 Ashland Dr #323 Delray Beach, FL | 2.0 | 2.0 | 998 | $3,500 | $3.51 | 24d | 1 | 0.49mi |
| 960 Flanders T Delray Beach, FL | 1.0 | 1.5 | 760 | $1,500 | $1.97 | 24d | 1 | 0.50mi |
HOA detail condo
- Monthly dues
- $605 · $7,260/yr
- Likely covers
- waterpool
- Assessments
- None detected in remarks — confirm with the listing agent.
Listing history 30 events
-
2026-05-22status Pending
-
2026-05-01historical Active Under Contract
-
2026-05-01historical $1,300
-
2026-04-04$1,300
-
2026-04-04historical $1,400
-
2026-04-03price $69,000
-
2026-02-15price $1,400
-
2026-02-13price $72,500
-
2025-12-16price $82,000
-
2025-11-15$1,500
-
2025-10-31$92,000 Active
-
2024-12-19historical
-
2024-10-16historical $1,500
-
2024-09-16$1,500
-
2024-09-12status Active
-
2024-09-12price $98,900
-
2024-09-10historical
-
2024-06-21price $108,500
-
2024-05-30price $113,500
-
2024-04-26price $113,900
-
2024-04-10$114,900 Active
-
2016-09-27soldstatus $47,000
-
2014-07-15soldstatus $25,000
-
2002-07-22historical
-
2000-10-25soldstatus $19,500
-
2000-10-06soldstatus $19,500
-
2000-08-19historical
-
2000-07-10$25,500
-
1999-10-13$25,000
-
1991-06-11soldstatus $23,500
ⓘ Source: listings_history table (triggers on properties + properties_extension) + one-shot
backfill from property_details.listing_events for pre-trigger history.
Tax reassessment forecast FL · Resets to sale price
- Current annual tax
- $1,347 · $112/mo
- Projected year-2 tax
- $1,347 · $112/mo
- Expected delta
- $0/yr ($0/mo · 0.0%)
ⓘ Screening estimate from a state-policy table — verify with the county assessor before closing.
Climate risk First Street
- Flood 1/10 Low FEMA zone X (unshaded) · 0% chance over 30 yrs
- Wildfire 1/10 Low
- Heat 9/10 Extreme 7 d/yr ≥106°F today · 26 d/yr by 30 yrs out
- Wind 10/10 Extreme 99% chance of damaging wind over 30 yrs
- Air quality 3/10 Moderate 2 unhealthy d/yr today · 3 by 30 yrs out
Nearby sold comps map
Loading sold comps map…
Walkable amenities ~0.75 mi
Loading nearby amenities…
Taxation est. · year 1
- Rental income
- $23,510
- − Mortgage interest
- −$3,865
- − Property taxes
- −$1,347
- − Insurance
- −$345
- − Repairs & maintenance
- −$1,881
- − Management
- −$1,881
- − HOA
- −$7,260
- − Depreciation
- −$2,007
- Taxable income
- $4,923
- Est. tax owed @ 24.0%
- −$1,182
- After-tax cash flow
- $4,096/yr
For passive investors: Depreciation is non-cash, so a rental often shows a tax loss while cash-flowing — sheltering income. Rental losses are passive: they offset passive income freely, and up to $25,000/yr can offset ordinary (W-2) income if you actively participate and your MAGI is under $100k (phasing out to $0 by $150k); unused losses carry forward. On sale, claimed depreciation is recaptured at up to 25%, and gains may owe capital-gains tax (a 1031 exchange can defer both). Figures are a year-1 estimate at your 24.0% rate — not tax advice; consult a CPA.
Schools (NCES district)
- District
- Palm Beach
- NCES district ID
- 1201500
- Math proficiency
- 46% ▼ -16.00%
- Reading proficiency
- 53% ▼ -4.00%
- Median HH income
- $53,943
- Composite
- 42.72/100
- National rank
- #3160
- State rank
- #34 of 73 in FL
Livability — Delray Beach
- Score
- 77/100
- State rank
- #202
- US rank
- #3160
Category grades
Schools grade is shown separately in the Schools card above.
Census & demographics
- County
- Palm Beach County · 1,438,312 people
- City population
- 123,167
- Metro
- Miami-Fort Lauderdale-Pompano Beach, FL
- Population (ZIP)
- 26,208
- Household income
- $62,151
- Rent vs Own
- Severe rent burden
- 991.0
Population outlook (Palm Beach County) Hauer SSP2
- Today (2025)
- 1,637,487 people
- By 2030
- 1,743,255 · +6.5%
- By 2040
- 1,948,712 · +19.0%
- By 2050
- 2,132,979 · +30.3%
- By 2075
- 2,530,027 · +54.5%
- By 2100
- 2,706,979 · +65.3%
Race, ethnicity, and origin ACS 2023
- Neighborhood character
- Predominantly White (74%)
- Race & ethnicity
- White 74% Hispanic / Latino 14% Two or more races 10% Black 5% Asian 2%
- Hispanic origin (detail)
- Puerto Rican 2% Cuban 2%
- Common ancestry
- Scotch-Irish 7% Romanian 6% Italian 2%
- Foreign-born
- 23% · Canada, Jamaica, China
- Languages at home
- 76% English-only · Spanish 13% Russian/Polish/Slavic 3% French/Haitian/Cajun 3%
Political lean MEDSL · Palm Beach
- 2024 margin
- Toss-up / Even · D 50.0% · R 49.2%
- 2008→2024 swing
- -22.1pp toward R · 2008: 22.9pp · 2024: 0.8pp
- All cycles
- 2024: D+0.8 2020: D+12.8 2016: D+15.3 2012: D+17.0 2008: D+22.9
Not yet ingested
- Civics
- —
Market trends
- HPI YoY
- ▼ -232.73%
- Current HPI
- 254.5016
- Rent YoY
- ▲ 4.28%
- Metro
- Miami-Fort Lauderdale-Pompano Beach, FL
- State GDP YoY
- ▲ 3.28%
- F500 in state
- 36
Industry mix (Fortune 500 HQ in FL)
| Industry | F500 HQs | Revenue |
|---|---|---|
| Industrial Technology | 2 | $29B |
|
||
| Insurance | 2 | $17B |
|
||
| Retail | 1 | $60B |
|
||
| Technology Distribution | 1 | $58B |
|
||
| Homebuilding | 1 | $35B |
|
||
| Technology Manufacturing | 1 | $35B |
|
||
Price history
-94.5% since first listed30 events — show timeline
- 2026-05-22 Pending — Beaches MLS
- 2026-05-01 Contingent — Beaches MLS
- 2026-05-01 Rental Removed $1,300 RMLSFL
- 2026-04-04 Listed for Rent $1,300 RMLSFL
- 2026-04-04 Rental Removed $1,400 GFLMLS
- 2026-04-03 Price Changed $69,000 Beaches MLS
- 2026-02-15 Price Changed $1,400 GFLMLS
- 2026-02-13 Price Changed $72,500 Beaches MLS
- 2025-12-16 Price Changed $82,000 Beaches MLS
- 2025-11-15 Listed for Rent $1,500 GFLMLS
- 2025-10-31 Listed $92,000 Beaches MLS
- 2024-12-19 Listing Removed — MARMLS
- 2024-10-16 Rental Removed $1,500 MARMLS
- 2024-09-16 Listed for Rent $1,500 MARMLS
- 2024-09-12 Relisted — MARMLS
- 2024-09-12 Price Changed $98,900 MARMLS
- 2024-09-10 Listing Removed — MARMLS
- 2024-06-21 Price Changed $108,500 MARMLS
- 2024-05-30 Price Changed $113,500 MARMLS
- 2024-04-26 Price Changed $113,900 MARMLS
- 2024-04-10 Listed $114,900 MARMLS
- 2016-09-27 Sold (Public Records) $47,000 Public Records
- 2014-07-15 Sold (Public Records) $25,000 Public Records
- 2002-07-22 Listing Removed — Beaches MLS
- 2000-10-25 Sold (Public Records) $19,500 Public Records
- 2000-10-06 Sold (MLS) $19,500 Beaches MLS
- 2000-08-19 Listing Removed — Beaches MLS
- 2000-07-10 Listed $25,500 Beaches MLS
- 1999-10-13 Listed $25,000 Beaches MLS
- 1991-06-11 Sold (Public Records) $23,500 Public Records
Property tax history
+9.1%/yrLatest (2025): $1,347 · +59.7% YoY. Source: county tax records.
Cash-flow waterfall
monthlySold comps — $/sqft
last 12 mo · ≤1 miLoading sold comps…