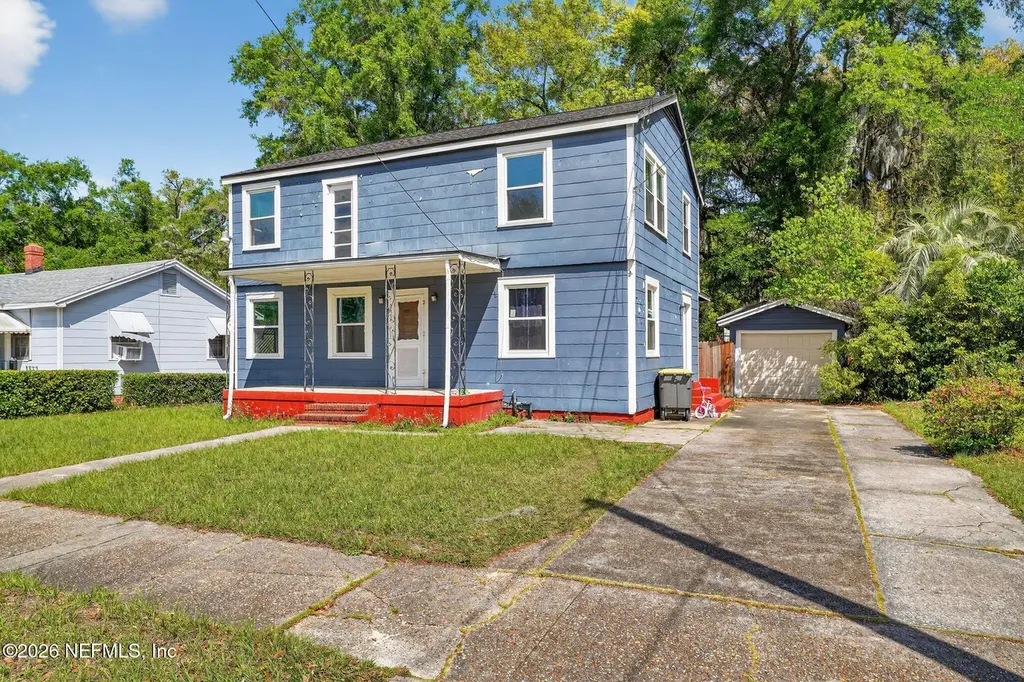
111 E 54th St · Jacksonville, FL
Flood risk No data
- FEMA flood zone
- —
- Chance of flooding over 30 yrs
- —
- Est. flood insurance / yr
- —
Fire risk No data
- Est. fire insurance / yr
- —
Heat risk No data
- Hot days now (above threshold)
- —
- Hot days in 30 yrs
- —
Wind risk No data
- Chance of severe wind over 30 yrs
- —
Air-quality risk No data
- Unhealthy air days now
- —
- Unhealthy air days in 30 yrs
- —
Risk factors via First Street. Map © Google.
Why this score? — see what drove the C- grade
The composite is a weighted blend of 9 inputs, each scored 0–100. Each bar is that input's sub-score; the figure is the points it added to the 100-point composite (weight × sub-score).
- ARV discount +15.0/15.0
- Cash flow +14.8/30.0
- DSCR +4.5/10.0
- 1% rule +4.3/10.0
- Livability +4.2/5.0
- Schools +3.9/10.0
- Condition / age +2.5/5.0
- Rent growth +2.2/5.0
- Appreciation +0.0/10.0
$169,000
🖨 Deal sheet (PDF) 📄 Offer letter ✓ Due diligence
Listing remarks MLS
Check out this charming spacious 4-bedroom, 2-bath home offering nearly 1,850 sq ft of living space on a generous lot with no HOA. This solid property features a functional layout with ample room for everyday living, entertaining, or future improvements. The large living areas and bedroom sizes offer flexibility, while the backyard includes an inground pool and additional space for outdoor enjoyment or storage. Conveniently located just minutes from Downtown Jacksonville with easy access to major roads, shopping, and dining.
Key facts
- Newer flooring
- Upgraded countertops
- Upgraded cabinetry
Tags
Property features AI
Finance
- HOA & community: Not a senior community
Exterior
- Parking: Garage (1 car)
- Utilities: Public sewer; Other utilities
- Home design: Single-family residence; Current use: Other
- Exterior features: Private pool; Other exterior features
Interior
- Kitchen: Dishwasher; Electric range; Microwave; Refrigerator
- Bedrooms: 4 bedrooms (main level)
- Bathrooms: 2 full bathrooms
- Heating & cooling: Electric heating; Central air conditioning
- Interior features: Four total rooms (living room, dining room, kitchen, plus additional room); Living room (approx. 16 x 14); Dining room (approx. 12 x 10); Kitchen (approx. 12 x 10)
Neighborhood map
What this means for you Summary
Snapshot
- This is a 4-bed/2.0-bath single-family listed at $169k.
Deal economics
- At list price, monthly cash flow is $45 ($542/yr) — positive.
- The deal already cash-flows at list — no discount required.
- To meet the 1% rule (rent ≥ 1% of price), the offer needs to be $158k (6.6% below list).
- Recommended offer: $158k (6.6% below list) — sets the bar for 1% rule.
- Cap rate 6.6% vs local median 3.9% in Jacksonville — top-decile yield for the area; either an underpriced asset or a hidden risk that comps aren't pricing in. Stress-test before assuming the spread holds.
Location & tenants
- Location reads 83/100 on livability (#50 in FL, #911 nationally) — a professional / high-income tenant draw. Strengths: amenities A+, commute A+, housing A+.
- Duval (urban): math 46% / reading 45% proficiency, ranked #48 of 73 in FL (top 66%) — families likely to look elsewhere, expect single-tenant / working-renter base with shorter leases.
- Zoned schools: North Shore Elementary (math 49% / reading 36%, grade F, #1,383 of 2,144 statewide, top 65%, 701 students, 86% FRL); Matthew W. Gilbert Middle School (math 26% / reading 17%, grade F, #553 of 571 statewide, top 97%, 688 students, 86% FRL); Andrew Jackson High School (math 30% / reading 26%, grade F, #464 of 667 statewide, top 70%, 870 students, 54% FRL) — zoned schools average 75% FRL vs 49% district-wide (26 pts higher); higher-poverty schools than district average — tighter screening recommended.
- Zoned-school proficiency averages 31% at this address vs 46% district-wide (-15 pts) — the specific schools serving this property underperform the Duval average; the district grade overstates school quality for this exact location.
- Market conditions: Rents soft (-1.4%/yr); 294 active listings in the ZIP; 4 comparable units currently listed for rent nearby; rentals at typical pace (median 26d on market — plan ~3-4 weeks tenant-placement turnaround); lower-income renter base — watch delinquency; 6,503 units permitted in Duval County in 2024 (1,131 in 5+ unit buildings).
- At $1,579/mo this rent would consume 46% of the median local household income ($41k/yr) (locally 1765% of renters already pay >50% of income on rent) — very limited rent-growth headroom before tenants either downsize or default.
Forward outlook
- Local home prices are declining (-3.0%/yr); year-one equity from $1k of loan paydown is wiped out by about $5k of value loss. Plan a longer hold.
- Duval County population projected at +19% by 2050 — long-run rental-demand tailwind backs the buy-and-hold thesis.
Negotiation context
- It's been on market 73 days — a 6% lower offer ($159k) is reasonable based on typical stale-listing flexibility.
- 8 sale attempts since 5y ago; this cycle's ask has dropped $16k (9%) from the opening price — seller is motivated, your offer sets the floor, not the list.
Risks & watch-outs
- Watch-outs: built in 1939 — expect roof / HVAC / electrical / plumbing capex.
Questions for the listing agent
- It's been on market 73 days. Have you received any prior offers? Is the seller open to a 7% concession, seller financing, or rate buy-down credit?
- Built in 1939 — when were the roof, HVAC, electrical panel, plumbing, and water heater last replaced?
- Why hasn't it sold? Are there any deal-killer items the seller is aware of (foundation, flood, title, zoning, code violations)?
- Is there a deadline driving the sale (1031 exchange, divorce, estate, relocation)? That informs how much negotiation room exists.
- Schools are B-rated — typically a magnet for longer-tenancy family renters. What's the average tenant stay here, and is there a school-zone premium baked into asking?
- What's the average days-on-market for RENTAL listings here right now (not sales)? A rising rental-DOM trend means longer vacancies and softer asking-rent achievability than the comps imply.
- What's the recent tenant-quality profile in this submarket — average credit score on applications, eviction rate, late-payment / NSF rate, and stable-employment percentage? A property-management company in the area should have these aggregated.
- How much new for-sale + rental construction is in the pipeline within 1–3 miles? Heavy new supply typically softens prices + rents 12–24 months out; constrained supply supports both.
Investment metrics
- 1% rule
- 0.93% ✗
- Cap rate
- 6.61%
- Cash-on-cash
- 1.15%
- DSCR
- 1.05
- GRM
- 8.9
CMA / ARV
- ARV (on-the-fly)
- $238,832
- Comps found
- 10
Show comp detail 10 sales within ~0.75 mi
| Address | Dist | Beds/Ba | Sqft | Sold | Price | $/sf | Match |
|---|---|---|---|---|---|---|---|
| 50 E 56th St | 0.09mi | 5/3.0 (+1) | 2,134 (+5%) | 16mo | $320,300 | $150 | 65 |
| 278 E 46th St | 0.34mi | 4/2.0 | 1,764 (-13%) | 1mo | $172,000 | $98 | 62 |
| 7431 Clinton St | 0.57mi | 3/2.0 (-1) | 2,027 (+0%) | 12mo | $239,000 | $118 | 58 |
| 418 E 46th St | 0.43mi | 4/2.0 | 1,922 (-5%) | 20mo | $97,000 | $50 | 55 |
| 6706 N Pearl St | 0.55mi | 3/2.5 (-1) | 1,984 (-2%) | 16mo | $260,000 | $131 | 51 |
| 132 W 65th St | 0.53mi | 4/3.0 | 1,940 (-4%) | 16mo | $320,000 | $165 | 50 |
| 77 W 55th St | 0.28mi | 3/1.0 (-1) | 1,800 (-11%) | 18mo | $100,000 | $56 | 44 |
| 255 W 66th St N | 0.74mi | 3/2.0 (-1) | 1,828 (-10%) | 3mo | $115,000 | $63 | 41 |
| 7462 Laura St N | 0.59mi | 3/2.5 (-1) | 1,824 (-10%) | 17mo | $276,000 | $151 | 35 |
| 5704 Perry St | 0.63mi | 4/2.5 | 1,725 (-15%) | 23mo | $203,000 | $118 | 25 |
Match score weights: distance 35% · size 25% · config 20% · recency 20%. Top-matched comps best support the ARV.
Projected returns pro-forma
-3.0% appreciation · 0.0% rent growth · sell at horizon
- IRR
- -18.0%
- Equity multiple
- 0.39×
- Total profit
- $-29,088
- Equity at exit
- $25,198
- IRR
- -17.7%
- Equity multiple
- 0.17×
- Total profit
- $-39,320
- Equity at exit
- $14,612
Cash invested: $47,320 (down + closing). Projections, not guarantees.
Landlord ↔ Tenant lean methodology
- Overall (STATE)
- 87 Strongly Landlord-Friendly
- State Florida
- 87 Strongly Landlord-Friendly · R+3
- County
- — inherits STATE
- City
- — inherits STATE
ZIP-level market 32208
- Home prices YoY
- -33.6%
- Rents YoY
- -1.4%
- Active inventory
- 294
- Price-to-rent
- 8.9×
Monthly cashflow live
- Estimated rent
- $1,579 medium interval (Pro) →
- Mortgage (P&I)
- −$886
- Tax from tax record
- −$245 /mo · $2,943/yr
- Insurance
- −$70
- HOA
- −$0
- Vacancy / Maint / Mgmt
- −$332
- Net cashflow
- $45
Break-even live
Sensitivity live
| Price | -10% $141 | -5% $93 | +0% $45 | +5% $-3 | +10% $-50 |
|---|---|---|---|---|---|
| Rent | -10% $-80 | -5% $-17 | +0% $45 | +5% $108 | +10% $170 |
| Rate | -1.0pp $130 | -0.5pp $88 | base $45 | +0.5pp $1 | +1.0pp $-43 |
UW: 25.0% down · 7.5% · 30yr · 1.5% tax · 5.0% vac · 8.0% maint · 8.0% mgmt
Financing live
Cash to close
- Down payment
- $42,250
- Closing costs
- $5,070
- Reserves months
- —
- Total cash needed
- —
Loan-product check · same deal, 3 products live
Conventional
25% down · 7.5% · 30yr
- Down + closing
- —
- Monthly P&I
- —
- Monthly cashflow
- —
- DSCR
- —
- Eligible?
- —
Personal DTI + credit; lowest rate.
DSCR
20% down · 8.5% · 30yr
- Down + closing
- —
- Monthly P&I
- —
- Monthly cashflow
- —
- DSCR
- —
- Eligible?
- —
No personal income docs; deal must DSCR.
Hard money
10% down · 12.0% · 12mo
- Down + closing
- —
- Monthly P&I
- —
- Monthly cashflow
- —
- DSCR
- —
- Eligible?
- —
Short-term bridge; refi at stabilization.
Rent comps 4 comps
| Address | Beds | Baths | Sqft | Rent | $/sqft | DOM | Units | Dist |
|---|---|---|---|---|---|---|---|---|
| 331 W 40th St Jacksonville, FL | 4.0 | 2.0 | 1536 | $1,375 | $0.90 | 6d | 1 | 0.86mi |
| 26 W 27th St Jacksonville, FL | 3.0 | 2.0 | 1512 | $1,300 | $0.86 | 25d | 1 | 1.31mi |
| 421 Golfair Blvd Jacksonville, FL | 4.0 | 2.5 | 1761 | $1,381 | $0.78 | 18d | 1 | 1.36mi |
| 6510 Avalon St Jacksonville, FL | 4.0 | 2.0 | 1488 | $1,425 | $0.96 | 25d | 1 | 1.36mi |
Listing history 49 events
-
2026-06-21days on market $169,000 Active 73 DOM
-
2026-06-18days on market $169,000 Active 70 DOM
-
2026-06-17days on market $169,000 Active 69 DOM
-
2026-06-16days on market $169,000 Active 68 DOM
-
2026-06-15days on market $169,000 Active 67 DOM
-
2026-06-13days on market $169,000 Active 64 DOM
-
2026-06-10days on market $169,000 Active 61 DOM
-
2026-06-08days on market $169,000 Active 60 DOM
-
2026-06-07days on market $169,000 Active 59 DOM
-
2026-06-05days on market $169,000 Active 56 DOM
-
2026-06-03days on market $169,000 Active 55 DOM
-
2026-06-02pricestatus $169,000 Active 54 DOM
-
2026-05-14price $175,000
-
2026-05-04price $177,000
-
2026-04-21price $178,000
-
2026-04-14price $179,000
-
2026-04-09price $184,000
-
2026-04-01$185,000 Active
-
2026-02-01historical 536-char remark
Show marketing remark (536 chars)
Check out this charming spacious 4-bedroom, 2-bath home offering nearly 1,850 sq ft of living space on a generous lot with no HOA. This solid property features a functional layout with ample room for everyday living, entertaining, or future improvements. The large living areas and bedroom sizes offer flexibility, while the backyard includes an inground pool and additional space for outdoor enjoyment or storage. Conveniently located just minutes from Downtown Jacksonville with easy access to major roads, shopping, and dining.
-
2026-01-15$190,000 Active 536-char remark
Show marketing remark (536 chars)
Check out this charming spacious 4-bedroom, 2-bath home offering nearly 1,850 sq ft of living space on a generous lot with no HOA. This solid property features a functional layout with ample room for everyday living, entertaining, or future improvements. The large living areas and bedroom sizes offer flexibility, while the backyard includes an inground pool and additional space for outdoor enjoyment or storage. Conveniently located just minutes from Downtown Jacksonville with easy access to major roads, shopping, and dining.
-
2024-04-01historical
-
2023-11-28price $220,000
-
2023-10-18price $275,000
-
2023-09-30$300,000 Active
-
2022-10-24soldstatus $185,000 Closed
-
2022-09-17status Pending
-
2022-09-13price $175,000
-
2022-09-12price $189,900
-
2022-08-31price $199,900
-
2022-08-29price $209,900
-
2022-08-26price $217,900
-
2022-08-24status Active
-
2022-08-16status Pending
-
2022-08-11price $219,900
-
2022-08-08price $224,900
-
2022-07-28price $229,900
-
2022-07-23price $239,900
-
2022-07-19$252,900 Active
-
2022-07-06status Pending
-
2022-07-05historical
-
2022-06-12price $239,900
-
2022-05-28price $245,000
-
2022-05-22price $240,000
-
2022-05-20price $252,000
-
2022-05-20status Active
-
2022-03-30status Pending
-
2022-03-22$245,000 Active
-
2021-08-11price $80,000
-
2021-08-06$85,000 Active
ⓘ Source: listings_history table (triggers on properties + properties_extension) + one-shot
backfill from property_details.listing_events for pre-trigger history.
Tax reassessment forecast FL · Resets to sale price
- Current annual tax
- $2,943 · $245/mo
- Projected year-2 tax
- $2,943 · $245/mo
- Expected delta
- $0/yr ($0/mo · 0.0%)
ⓘ Screening estimate from a state-policy table — verify with the county assessor before closing.
Nearby sold comps map
Loading sold comps map…
Walkable amenities ~0.75 mi
Loading nearby amenities…
Taxation est. · year 1
- Rental income
- $18,943
- − Mortgage interest
- −$9,467
- − Property taxes
- −$2,943
- − Insurance
- −$845
- − Repairs & maintenance
- −$1,515
- − Management
- −$1,515
- − Depreciation
- −$4,916
- Taxable loss
- −$2,258
- Est. tax savings @ 24.0%
- +$542
- After-tax cash flow
- $1,084/yr
For passive investors: Depreciation is non-cash, so a rental often shows a tax loss while cash-flowing — sheltering income. Rental losses are passive: they offset passive income freely, and up to $25,000/yr can offset ordinary (W-2) income if you actively participate and your MAGI is under $100k (phasing out to $0 by $150k); unused losses carry forward. On sale, claimed depreciation is recaptured at up to 25%, and gains may owe capital-gains tax (a 1031 exchange can defer both). Figures are a year-1 estimate at your 24.0% rate — not tax advice; consult a CPA.
Schools (NCES district)
- District
- Duval
- NCES district ID
- 1200480
- Math proficiency
- 46% ▼ -11.00%
- Reading proficiency
- 45% ▼ -4.00%
- Median HH income
- $48,987
- Composite
- 38.97/100
- National rank
- #4076
- State rank
- #48 of 73 in FL
Livability — Jacksonville
- Score
- 83/100
- State rank
- #50
- US rank
- #911
Category grades
Schools grade is shown separately in the Schools card above.
Census & demographics
- Census place
- Jacksonville, FL
- County
- Duval County · 1,015,274 people
- City population
- 979,034
- Metro
- Jacksonville, FL
- Population (ZIP)
- 32,699
- Household income
- $41,324
- Rent vs Own
- Severe rent burden
- 1765.0
Population outlook (Duval County) Hauer SSP2
- Today (2025)
- 1,013,010 people
- By 2030
- 1,059,228 · +4.6%
- By 2040
- 1,141,439 · +12.7%
- By 2050
- 1,205,258 · +19.0%
- By 2075
- 1,324,282 · +30.7%
- By 2100
- 1,319,620 · +30.3%
Race, ethnicity, and origin ACS 2023
- Neighborhood character
- Predominantly Black (77%)
- Race & ethnicity
- Black 77% White 16% Two or more races 4% Hispanic / Latino 3%
- Common ancestry
- Italian 1%
- Foreign-born
- 2% · Canada
- Languages at home
- 97% English-only · Spanish 2%
Political lean MEDSL · Duval
- 2024 margin
- Toss-up / Even · D 48.7% · R 50.1% · Other 1.2%
- 2008→2024 swing
- +0.4pp no change · 2008: -1.9pp · 2024: -1.5pp
- All cycles
- 2024: R+1.5 2020: D+3.8 2016: R+1.5 2012: R+3.6 2008: R+1.9
Not yet ingested
- Civics
- —
Market trends
- HPI YoY
- ▼ -110.56%
- Current HPI
- 217.9706
- Rent YoY
- ▼ -1.36%
- Metro
- Jacksonville, FL
- State GDP YoY
- ▲ 3.28%
- F500 in state
- 36
Industry mix (Fortune 500 HQ in FL)
| Industry | F500 HQs | Revenue |
|---|---|---|
| Industrial Technology | 2 | $29B |
|
||
| Insurance | 2 | $17B |
|
||
| Retail | 1 | $60B |
|
||
| Technology Distribution | 1 | $58B |
|
||
| Homebuilding | 1 | $35B |
|
||
| Technology Manufacturing | 1 | $35B |
|
||
Price history
+105.9% since first listed37 events — show timeline
- 2026-05-14 Price Changed $175,000 realMLS
- 2026-05-04 Price Changed $177,000 realMLS
- 2026-04-21 Price Changed $178,000 realMLS
- 2026-04-14 Price Changed $179,000 realMLS
- 2026-04-09 Price Changed $184,000 realMLS
- 2026-04-01 Listed $185,000 realMLS
- 2026-02-01 Listing Removed — realMLS
- 2026-01-15 Listed $190,000 realMLS
- 2024-04-01 Listing Removed — Daytona MLS
- 2023-11-28 Price Changed $220,000 Daytona MLS
- 2023-10-18 Price Changed $275,000 Daytona MLS
- 2023-09-30 Listed $300,000 Daytona MLS
- 2022-10-24 Sold (MLS) $185,000 Stellar MLS as Distributed by MLS Grid
- 2022-09-17 Pending — Stellar MLS as Distributed by MLS Grid
- 2022-09-13 Price Changed $175,000 Stellar MLS as Distributed by MLS Grid
- 2022-09-12 Price Changed $189,900 Stellar MLS as Distributed by MLS Grid
- 2022-08-31 Price Changed $199,900 Stellar MLS as Distributed by MLS Grid
- 2022-08-29 Price Changed $209,900 Stellar MLS as Distributed by MLS Grid
- 2022-08-26 Price Changed $217,900 Stellar MLS as Distributed by MLS Grid
- 2022-08-24 Relisted — Stellar MLS as Distributed by MLS Grid
- 2022-08-16 Pending — Stellar MLS as Distributed by MLS Grid
- 2022-08-11 Price Changed $219,900 Stellar MLS as Distributed by MLS Grid
- 2022-08-08 Price Changed $224,900 Stellar MLS as Distributed by MLS Grid
- 2022-07-28 Price Changed $229,900 Stellar MLS as Distributed by MLS Grid
- 2022-07-23 Price Changed $239,900 Stellar MLS as Distributed by MLS Grid
- 2022-07-19 Listed $252,900 Stellar MLS as Distributed by MLS Grid
- 2022-07-06 Pending — realMLS
- 2022-07-05 Listing Removed — realMLS
- 2022-06-12 Price Changed $239,900 realMLS
- 2022-05-28 Price Changed $245,000 realMLS
- 2022-05-22 Price Changed $240,000 realMLS
- 2022-05-20 Price Changed $252,000 realMLS
- 2022-05-20 Relisted — realMLS
- 2022-03-30 Pending — realMLS
- 2022-03-22 Listed $245,000 realMLS
- 2021-08-11 Price Changed $80,000 realMLS
- 2021-08-06 Listed $85,000 realMLS
Property tax history
+13.1%/yrLatest (2025): $2,943 · +9.3% YoY. Source: county tax records.
Cash-flow waterfall
monthlySold comps — $/sqft
last 12 mo · ≤1 miLoading sold comps…