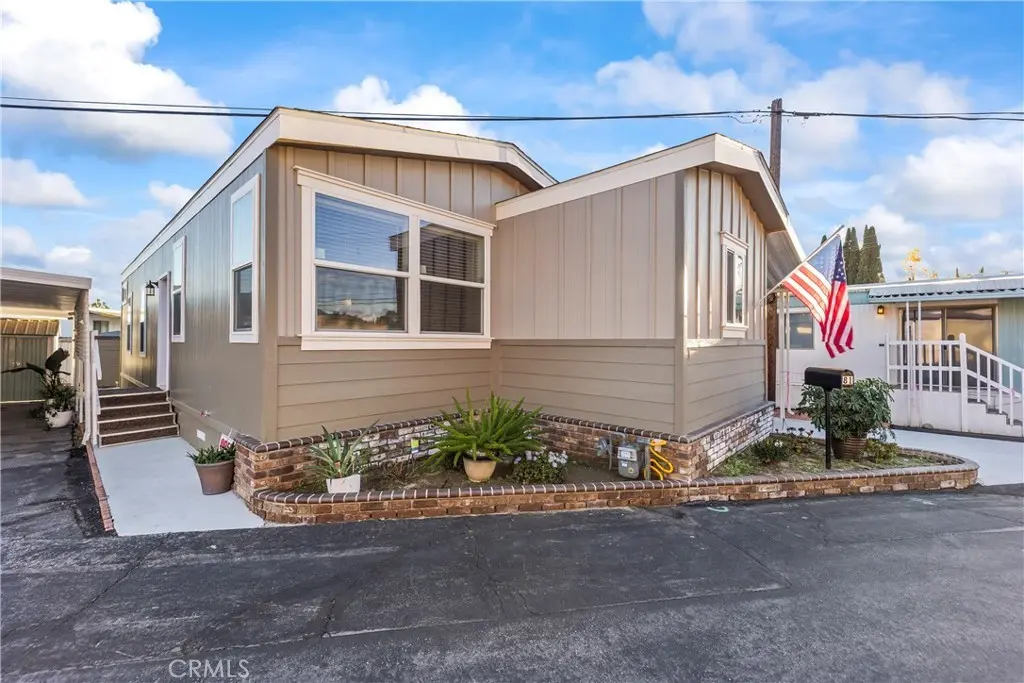
1020 BRADBOURNE Ave #81 · Duarte, CA
Flood risk 1/10 · Minimal
- FEMA flood zone
- X (unshaded)
- Chance of flooding over 30 yrs
- 0.0%
- Est. flood insurance / yr
- $507 – $1,088
Fire risk 6/10 · Moderate
- Est. fire insurance / yr
- $659 – $1,223
Heat risk 7/10 · Major
- Hot days now (above 100°F)
- 7 days/yr
- Hot days in 30 yrs
- 19 days/yr
Wind risk 1/10 · Minimal
- Chance of severe wind over 30 yrs
- —
Air-quality risk 7/10 · Major
- Unhealthy air days now
- 12 days/yr
- Unhealthy air days in 30 yrs
- 14 days/yr
Risk factors via First Street. Map © Google.
Why this score? — see what drove the C grade
The composite is a weighted blend of 9 inputs, each scored 0–100. Each bar is that input's sub-score; the figure is the points it added to the 100-point composite (weight × sub-score).
- Cash flow +23.2/30.0
- DSCR +7.5/10.0
- ARV discount +7.5/15.0
- 1% rule +6.0/10.0
- Livability +3.8/5.0
- Schools +3.4/10.0
- Condition / age +2.5/5.0
- Rent growth +1.9/5.0
- Appreciation +0.0/10.0
$269,900
🖨 Deal sheet 📄 Offer letter ✓ Due diligence
Listing remarks
BEAUTIFUL DOUBLE WIDE SKYLINE/CHANPION MANUFACTURED HOME (AKA. MOBILE HOME ) . .. . NESTED IN A GREAT 55+ SENIOR COMMUNITY IN THE CITY OF DUARTE, ON THE FOOTHILLS OF THE SAN GABRIEL MOUNTAINS. THIS HOME HAS ALL THE BELLS AND WHISTLES: FEATURES, QUARTZ COUNTER TOPS, STAILESS STEEL APPLIANCES ( REFRIGERATOR, GAS STOVE, OVER THE STOVE MICROWAVE, WASHING MACHINE & GAS DRYER, DISHWASHER > MADE BY WHIRLPOOL ) CENTRAL AIR AND HEAT, GORGEOUS VINYL WATERPROOF FLOORING, HIGH CEILINGS, RECESSED LIGHTING, COVERED CARPORT, OUTSIDE SITTING AREA, AND STORAGE SHED. .. . HOME IS CENTRALLY LOCTED NEAR SHOPPING MALLS, RESTAURANTS, CONVENIENCE STORES, SCHOOLS, PUBLIC TRANSPORTATION, CITY OF HOPE HO
Key facts
- Covered carport
- Central air and heat
- Recessed lighting
Tags
Property features AI
Finance
- Other: Lot is level with street and paved; listed lot descriptors include 0-1 unit/acre and lot level/flat
- Financial info: Land lease: $1,200 monthly (current)
- HOA & community: Senior community; Park name: TREELANE COMMUNITY PARK; Community features include street lighting and sidewalks; Manager approval required; Pets allowed with breed restrictions
Exterior
- Parking: Attached carport (2 carport spaces); Driveway with concrete paving and level driveway; 2 total parking spaces; Private road frontage; paved and maintained road
- Security: Carbon monoxide detector(s); Smoke detector(s)
- Utilities: Private water source; Private sewer; Electricity on property (standard, 220V available); Natural gas connected/available; Sewer and water connected; Cable and telephone available
- Home design: Mobile home (model: AMBER COVE); Double body type; Single-story; Entry level 1; Mobile home remains
- Construction: Cement board, brick and hardboard exterior with drywall interior walls; Composition/shingle roof; Pillar/post/pier foundation with pier jacks; Year built reported by seller
- Exterior features: Awning; Exterior lighting; Patio; One shed on property; Turnkey condition; South-facing with a view; Garden; Near public transit, park nearby, close to clubhouse, walkstreet
Interior
- Kitchen: Quartz countertops; Microwave; Gas range (also compatible with gas & electric range); Water heater unit
- Bedrooms: All bedrooms on main level
- Flooring: Vinyl flooring
- Bathrooms: 2 full bathrooms; Bathtub and shower (shower in tub)
- Heating & cooling: Central furnace heating; Central air conditioning
- Interior features: Front entry; One-level home; Carbon monoxide and smoke detectors; Double-pane windows with plantation shutters
- Laundry & utility: Washer and dryer included; Washer hookup; Gas dryer hookup and gas & electric dryer hookup; Laundry chute; Community laundry area
Neighborhood map
What this means for you Summary
Snapshot
- This is a 2-bed/2.0-bath manufactured listed at $270k.
Deal economics
- At list price, monthly cash flow is $490 ($6k/yr) — positive.
- The deal already cash-flows at list — no discount required.
- Meets the 1% rule at list price ($3k rent vs $270k).
- Recommended offer: $262k (3.0% below list) — sets the bar for market timing.
- Cap rate 8.5% vs local median 3.0% in Duarte — top-decile yield for the area; either an underpriced asset or a hidden risk that comps aren't pricing in. Stress-test before assuming the spread holds.
Location & tenants
- Location reads 76/100 on livability (#97 in CA, #3,529 nationally) — a middle-class / working-renter tenant base. Strengths: amenities A+, commute A+, employment A+; Watch: health & safety D, cost of living F.
- Duarte Unified (suburban): math 31% / reading 44% proficiency, ranked #241 of 517 in CA (top 47%) — families likely to look elsewhere, expect single-tenant / working-renter base with shorter leases.
- Market conditions: Rents soft (-2.5%/yr); 37 active listings in the ZIP; 8 comparable units currently listed for rent nearby; rentals lingering (median 44d on market — plan ~5-8 weeks vacancy on turnover, expect pricing pressure); 50% of comp listings sitting > 30 days — soft ceiling on asking rent; solid renter incomes; 19,697 units permitted in Los Angeles County in 2024 (9,426 in 5+ unit buildings).
- This rent runs 35% of the median local income ($103k/yr) — at the standard rent-burdened threshold; future hikes will face affordability resistance.
Forward outlook
- Local home prices are declining (-3.0%/yr); year-one equity from $2k of loan paydown is wiped out by about $8k of value loss. Plan a longer hold.
- Los Angeles County population projected at +9% by 2050 — modest demand growth; plan on rents tracking national, not racing it.
Negotiation context
- It's been on market 38 days — a 3% lower offer ($262k) is reasonable based on typical stale-listing flexibility.
- 8 sale attempts since 23y ago with the ask held roughly flat each time — persistent listings suggest the price (not the market) is what's stuck; bring a comps-based counter.
Risks & watch-outs
- Climate carrying-cost: major wildfire risk; extreme-heat days projected 7→19/yr by 2055 (HVAC capex compounding) — expect insurance premiums to compound above CPI over the hold.
Questions for the listing agent
- It's been on market 38 days. Have you received any prior offers? Is the seller open to a 3% concession, seller financing, or rate buy-down credit?
- Is there a deadline driving the sale (1031 exchange, divorce, estate, relocation)? That informs how much negotiation room exists.
- What's the average days-on-market for RENTAL listings here right now (not sales)? A rising rental-DOM trend means longer vacancies and softer asking-rent achievability than the comps imply.
- What's the recent tenant-quality profile in this submarket — average credit score on applications, eviction rate, late-payment / NSF rate, and stable-employment percentage? A property-management company in the area should have these aggregated.
- How much new for-sale + rental construction is in the pipeline within 1–3 miles? Heavy new supply typically softens prices + rents 12–24 months out; constrained supply supports both.
Investment metrics
- 1% rule
- 1.10% ✓
- Cap rate
- 8.47%
- Cash-on-cash
- 7.78%
- DSCR
- 1.35
- GRM
- 7.5
CMA / ARV
- ARV (median comp)
- $125,000
- List price
- $269,900
- Delta
- 115.92%
- Verdict
- OVERPRICED
- Comps
- 3 within 1.0 mi
Show comp detail 4 sales within ~0.75 mi
| Address | Dist | Beds/Ba | Sqft | Sold | Price | $/sf | Match |
|---|---|---|---|---|---|---|---|
| 1020 BRADBOURNE Ave #4 | 0.00mi | 3/2.0 (+1) | 960 (+9%) | 8mo | $158,000 | $165 | 73 |
| 1030 Bradbourne Ave #9 | 0.06mi | 2/1.5 | 956 (+9%) | 10mo | $77,400 | $81 | 73 |
| 1020 Bradourne Ave #72 | 0.00mi | 2/1.0 | 920 (+4%) | 21mo | $85,000 | $92 | 71 |
| 1030 Bradbourne Ave #44 | 0.06mi | 2/1.0 | 1,000 (+14%) | 2mo | $125,000 | $125 | 69 |
Match score weights: distance 35% · size 25% · config 20% · recency 20%. Top-matched comps best support the ARV.
Projected returns pro-forma
-3.0% appreciation · 0.0% rent growth · sell at horizon
- IRR
- -7.9%
- Equity multiple
- 0.72×
- Total profit
- $-21,224
- Equity at exit
- $40,243
- IRR
- -2.7%
- Equity multiple
- 0.84×
- Total profit
- $-11,884
- Equity at exit
- $23,336
Cash invested: $75,572 (down + closing). Projections, not guarantees.
Landlord ↔ Tenant lean methodology
- Overall (STATE)
- 18 Strongly Tenant-Friendly
- State California
- 18 Strongly Tenant-Friendly · D+13
- County
- — inherits STATE
- City
- — inherits STATE
ZIP-level market 91010
- Rents YoY
- -2.5%
- Active inventory
- 37
- Price-to-rent
- 7.5×
Monthly cashflow live
- Estimated rent
- $2,981 high interval (Pro) →
- Mortgage (P&I)
- −$1,415
- Tax est. 1.5%
- −$337 /mo · $4,048/yr
- Insurance
- −$112
- HOA
- −$0
- Vacancy / Maint / Mgmt
- −$626
- Net cashflow
- $490
Break-even live
UW: 25.0% down · 7.5% · 30yr · 1.5% tax · 5.0% vac · 8.0% maint · 8.0% mgmt
Financing live
Cash to close
- Down payment
- $67,475
- Closing costs
- $8,097
- Reserves months
- —
- Total cash needed
- —
Loan-product check · same deal, 3 products live
Conventional
25% down · 7.5% · 30yr
- Down + closing
- —
- Monthly P&I
- —
- Monthly cashflow
- —
- DSCR
- —
- Eligible?
- —
Personal DTI + credit; lowest rate.
DSCR
20% down · 8.5% · 30yr
- Down + closing
- —
- Monthly P&I
- —
- Monthly cashflow
- —
- DSCR
- —
- Eligible?
- —
No personal income docs; deal must DSCR.
Hard money
10% down · 12.0% · 12mo
- Down + closing
- —
- Monthly P&I
- —
- Monthly cashflow
- —
- DSCR
- —
- Eligible?
- —
Short-term bridge; refi at stabilization.
Rent comps 8 comps
| Address | Beds | Baths | Sqft | Rent | $/sqft | DOM | Units | Dist |
|---|---|---|---|---|---|---|---|---|
| 2222 Huntington Dr Duarte, CA | 2.0 | 1.0–2.0 | 753 | $2,685 | $3.56 | 1d | 6 | 0.17mi |
| 2305 Sesmas St Duarte, CA | 2.0 | 1.0 | 787 | $3,200 | $4.07 | 7d | 1 | 0.21mi |
| 1708 Second St Duarte, CA | 2.0 | 1.0 | 750 | $2,500 | $3.33 | 43d | 1 | 0.55mi |
| 1700 Fasana Rd Duarte, CA | 3.0 | 1.0–3.0 | 851 | $3,551 | $4.17 | 1d | 51 | 0.74mi |
| 1750 Fasana Rd Duarte, CA | 4.0 | 1.0–4.0 | 1480 | $4,087 | $2.76 | 1d | 37 | 0.74mi |
| 1608 Cotter Ave Duarte, CA | 1.0 | 1.0 | 650 | $3,100 | $4.77 | 43d | 1 | 0.94mi |
| 1353 Pengra St Duarte, CA | 3.0 | 2.0 | 1075 | $3,100 | $2.88 | 43d | 1 | 1.21mi |
| 1543 Delford Ave Unit 1/2 Duarte, CA | 3.0 | 2.0 | 1000 | $3,400 | $3.40 | 43d | 1 | 1.28mi |
Listing history 27 events
-
2026-06-18days on market $269,900 Active 38 DOM
-
2026-06-17days on market $269,900 Active 37 DOM
-
2026-06-16days on market $269,900 Active 36 DOM
-
2026-06-15days on market $269,900 Active 35 DOM
-
2026-06-13days on market $269,900 Active 33 DOM
-
2026-06-13days on market $269,900 Active 32 DOM
-
2026-06-09days on market $269,900 Active 29 DOM
-
2026-06-08days on market $269,900 Active 28 DOM
-
2026-06-07days on market $269,900 Active 27 DOM
-
2026-06-04days on market $269,900 Active 24 DOM
-
2026-06-03days on market $269,900 Active 23 DOM
-
2026-06-02days on market $269,900 Active 22 DOM
-
2026-06-01days on market $269,900 Active 21 DOM
-
2026-05-31days on market $269,900 Active 20 DOM
-
2026-05-11$269,900 Active 794-char remark
-
2026-03-19historical
-
2026-01-14status Active
-
2026-01-13price $275,000
-
2025-11-25historical
-
2025-11-15$295,000 Active
-
2024-12-07status Active
-
2024-09-20status Active
-
2024-06-23status Active
-
2024-06-14$75,000 Active
-
2024-06-11historical
-
2004-11-07historical
-
2003-11-07$17,000
ⓘ Source: listings_history table (triggers on properties + properties_extension) + one-shot
backfill from property_details.listing_events for pre-trigger history.
Climate risk First Street
- Flood 1/10 Low FEMA zone X (unshaded) · 0% chance over 30 yrs
- Wildfire 6/10 Major
- Heat 7/10 Severe 7 d/yr ≥100°F today · 19 d/yr by 30 yrs out
- Wind 1/10 Low
- Air quality 7/10 Severe 12 unhealthy d/yr today · 14 by 30 yrs out
Nearby sold comps map
Loading sold comps map…
Walkable amenities ~0.75 mi
Loading nearby amenities…
Taxation est. · year 1
- Rental income
- $35,774
- − Mortgage interest
- −$15,119
- − Property taxes
- −$4,048
- − Insurance
- −$1,350
- − Repairs & maintenance
- −$2,862
- − Management
- −$2,862
- − Depreciation
- −$7,852
- Taxable income
- $1,682
- Est. tax owed @ 24.0%
- −$404
- After-tax cash flow
- $5,475/yr
For passive investors: Depreciation is non-cash, so a rental often shows a tax loss while cash-flowing — sheltering income. Rental losses are passive: they offset passive income freely, and up to $25,000/yr can offset ordinary (W-2) income if you actively participate and your MAGI is under $100k (phasing out to $0 by $150k); unused losses carry forward. On sale, claimed depreciation is recaptured at up to 25%, and gains may owe capital-gains tax (a 1031 exchange can defer both). Figures are a year-1 estimate at your 24.0% rate — not tax advice; consult a CPA.
Schools (NCES district)
- District
- Duarte Unified
- NCES district ID
- 0611520
- Math proficiency
- 31% ▼ -10.00%
- Reading proficiency
- 44% ▼ -11.00%
- Median HH income
- $63,411
- Composite
- 33.66/100
- National rank
- #5392
- State rank
- #241 of 517 in CA
Livability — Duarte
- Score
- 76/100
- State rank
- #97
- US rank
- #3529
Category grades
Schools grade is shown separately in the Schools card above.
Census & demographics
- Census place
- Duarte, CA
- County
- Los Angeles County · 9,444,647 people
- City population
- 27,589
- Metro
- Los Angeles-Long Beach-Anaheim, CA
- Population (ZIP)
- 27,589
- Household income
- $102,705
- Rent vs Own
- Severe rent burden
- 844.0
Population outlook (Los Angeles County) Hauer SSP2
- Today (2025)
- 10,940,515 people
- By 2030
- 11,256,481 · +2.9%
- By 2040
- 11,729,929 · +7.2%
- By 2050
- 11,948,407 · +9.2%
- By 2075
- 11,818,114 · +8.0%
- By 2100
- 10,842,928 · -0.9%
Race, ethnicity, and origin ACS 2023
- Neighborhood character
- Diverse neighborhood (Simpson 0.62)
- Race & ethnicity
- Hispanic / Latino 56% Two or more races 21% White 20% Asian 16% Black 5% Native American 1%
- Hispanic origin (detail)
- Mexican 42%
- Common ancestry
- Lithuanian 2% Slovak 1% Romanian 1%
- Foreign-born
- 33% · Canada, China, South Korea
- Languages at home
- 42% English-only · Spanish 42% Chinese 6% Tagalog/Filipino 4%
Political lean MEDSL · Los Angeles
- 2024 margin
- Solid D (+32.9) · D 64.8% · R 31.9% · Other 3.3%
- 2008→2024 swing
- -7.4pp toward R · 2008: 40.4pp · 2024: 32.9pp
- All cycles
- 2024: D+32.9 2020: D+44.2 2016: D+48.0 2012: D+40.0 2008: D+40.4
Not yet ingested
- Civics
- —
Market trends
- HPI YoY
- ▼ -790.18%
- Current HPI
- 381.0753
- Rent YoY
- ▼ -2.46%
- Metro
- Los Angeles-Long Beach-Anaheim, CA
- State GDP YoY
- ▲ 3.21%
- F500 in state
- 116
Industry mix (Fortune 500 HQ in CA)
| Industry | F500 HQs | Revenue |
|---|---|---|
| Technology | 27 | $1,492B |
|
||
| Financial Services | 3 | $174B |
|
||
| Retail | 3 | $44B |
|
||
| Insurance | 3 | $26B |
|
||
| Media / Entertainment | 2 | $115B |
|
||
| Pharmaceuticals / Biotech | 2 | $62B |
|
||
Price history
+1487.6% since first listed13 events — show timeline
- 2026-05-11 Listed $269,900 CRMLS
- 2026-03-19 Listing Removed — CRMLS
- 2026-01-14 Relisted — CRMLS
- 2026-01-13 Price Changed $275,000 CRMLS
- 2025-11-25 Listing Removed — CRMLS
- 2025-11-15 Listed $295,000 CRMLS
- 2024-12-07 Relisted — CRMLS
- 2024-09-20 Relisted — CRMLS
- 2024-06-23 Relisted — CRMLS
- 2024-06-14 Listed $75,000 CRMLS
- 2024-06-11 Coming Soon — CRMLS
- 2004-11-07 Listing Removed — CRMLS
- 2003-11-07 Listed $17,000 CRMLS
Cash-flow waterfall
monthlySold comps — $/sqft
last 12 mo · ≤1 miLoading sold comps…