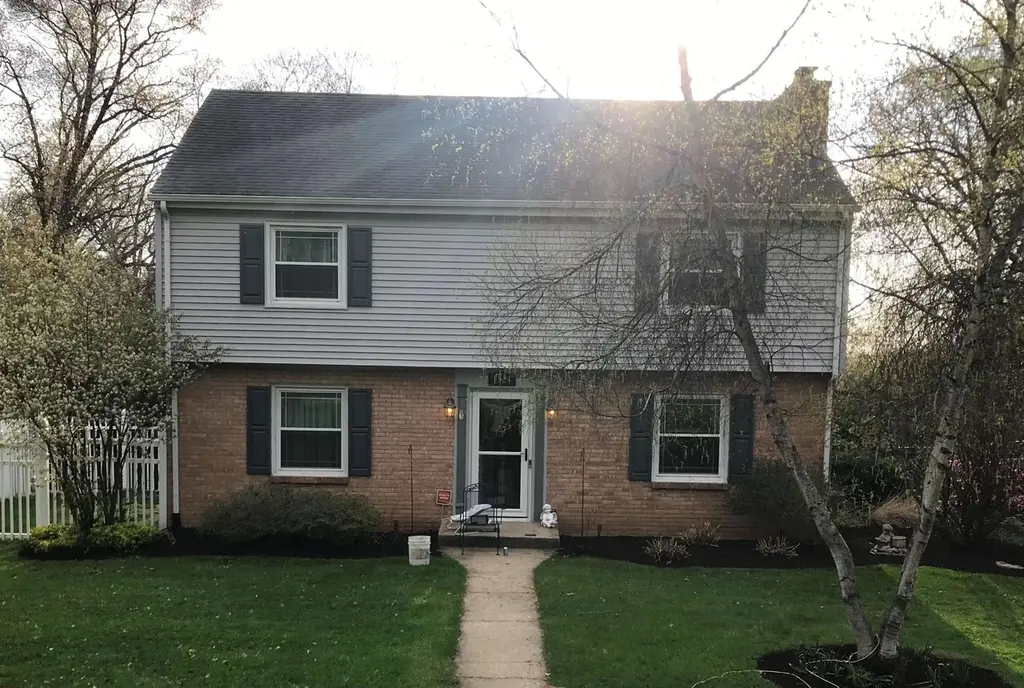
1924 Kings Hwy · Rockford, IL
Flood risk 1/10 · Minimal
- FEMA flood zone
- X (unshaded)
- Chance of flooding over 30 yrs
- 0.0%
- Est. flood insurance / yr
- $473 – $860
Fire risk 1/10 · Minimal
- Est. fire insurance / yr
- $804 – $1,492
Heat risk 2/10 · Minimal
- Hot days now (above 101°F)
- 7 days/yr
- Hot days in 30 yrs
- 14 days/yr
Wind risk 2/10 · Minimal
- Chance of severe wind over 30 yrs
- —
Air-quality risk 3/10 · Minor
- Unhealthy air days now
- 2 days/yr
- Unhealthy air days in 30 yrs
- 3 days/yr
Risk factors via First Street. Map © Google.
Why this score? — see what drove the F grade
The composite is a weighted blend of 9 inputs, each scored 0–100. Each bar is that input's sub-score; the figure is the points it added to the 100-point composite (weight × sub-score).
- Cash flow +14.1/30.0
- 1% rule +4.7/10.0
- DSCR +4.3/10.0
- Rent growth +4.0/5.0
- Livability +3.1/5.0
- Condition / age +2.5/5.0
- Schools +1.2/10.0
- ARV discount +0.0/15.0
- Appreciation +0.0/10.0
$275,000
🖨 Deal sheet (PDF) 📄 Offer letter ✓ Due diligence
Listing remarks MLS
SBR
Key facts
- 2 garage spots
- Built 1960
Neighborhood map
What this means for you Summary
Snapshot
- This is a 3-bed/1.5-bath single-family listed at $275k.
Deal economics
- At list price, monthly cash flow is $39 ($465/yr) — positive.
- The deal already cash-flows at list — no discount required.
- To meet the 1% rule (rent ≥ 1% of price), the offer needs to be $268k (2.6% below list).
- Recommended offer: $268k (2.6% below list) — sets the bar for 1% rule.
Location & tenants
- Location reads 62/100 on livability (#876 in IL) — a middle-class / working-renter tenant base. Strengths: cost of living A+, housing A+, health & safety A+; Watch: schools F, crime F, amenities F.
- Rockford SD 205 (urban): math 12% / reading 16% proficiency, ranked #533 of 620 in IL (top 86%) — low school quality limits family demand, transient renter base, plan for 1-2y turnover; 73% free/reduced lunch — lower-income household profile, screen leases tightly.
- Market conditions: Rents rising fast (+5.9%/yr); 157 active listings in the ZIP; 3 comparable units currently listed for rent nearby; rentals at typical pace (median 15d on market — plan ~3-4 weeks tenant-placement turnaround); solid renter incomes; 285 units permitted in Winnebago County in 2024 (0 in 5+ unit buildings).
- This rent runs 41% of the median local income ($79k/yr) — at the standard rent-burdened threshold; future hikes will face affordability resistance.
Forward outlook
- Local home prices are declining (-3.0%/yr); year-one equity from $2k of loan paydown is wiped out by about $8k of value loss. Plan a longer hold.
- Winnebago County population projected at -20% by 2050 — secular population decline; favor cash flow + early exit over multi-decade hold.
Negotiation context
- Only 0 days on market — expect competitive offers; lowballing is unlikely to land.
- 7 sale attempts since 13y ago with the ask held roughly flat each time — persistent listings suggest the price (not the market) is what's stuck; bring a comps-based counter.
Questions for the listing agent
- Built in 1960 — when were the roof, HVAC, electrical panel, plumbing, and water heater last replaced?
- Is there a deadline driving the sale (1031 exchange, divorce, estate, relocation)? That informs how much negotiation room exists.
- Schools are F-rated, which usually means shorter tenancies and higher turnover. Who's the typical renter profile here, and what's been the actual vacancy rate?
- Crime grade is F in this area — have there been break-ins, vandalism, or insurance claims at this property in the last 3 years? What carrier currently insures it and at what premium?
- The area grade is low — what's the realistic commute time and amenity access for the typical tenant pool here? Any planned neighborhood developments (good or bad) we should know about?
- What's the average days-on-market for RENTAL listings here right now (not sales)? A rising rental-DOM trend means longer vacancies and softer asking-rent achievability than the comps imply.
- What's the recent tenant-quality profile in this submarket — average credit score on applications, eviction rate, late-payment / NSF rate, and stable-employment percentage? A property-management company in the area should have these aggregated.
- How much new for-sale + rental construction is in the pipeline within 1–3 miles? Heavy new supply typically softens prices + rents 12–24 months out; constrained supply supports both.
Investment metrics
- 1% rule
- 0.97% ✗
- Cap rate
- 6.46%
- Cash-on-cash
- 0.60%
- DSCR
- 1.03
- GRM
- 8.6
CMA / ARV
- ARV (on-the-fly)
- $235,053
- Comps found
- 12
Show comp detail 12 sales within ~0.75 mi
| Address | Dist | Beds/Ba | Sqft | Sold | Price | $/sf | Match |
|---|---|---|---|---|---|---|---|
| 1303 Roncevalles Ave | 0.52mi | 3/2.0 | 1,999 (-0%) | 0mo | $222,000 | $111 | 73 |
| 1632 Arden Ave | 0.35mi | 3/1.5 | 1,814 (-10%) | 5mo | $215,501 | $119 | 63 |
| 1606 Roncevalles Ave | 0.32mi | 3/2.0 | 2,266 (+13%) | 0mo | $265,000 | $117 | 61 |
| 2615 Brendenwood Rd | 0.72mi | 3/1.5 | 1,977 (-2%) | 4mo | $184,000 | $93 | 61 |
| 1614 Fairview (sbr) Ct | 0.35mi | 3/1.5 | 1,736 (-14%) | 1mo | $230,500 | $133 | 60 |
| 1012 Chelsea Ave | 0.72mi | 3/2.0 | 2,066 (+3%) | 1mo | $240,000 | $116 | 59 |
| 3712 Pinecrest Rd | 0.36mi | 4/2.0 (+1) | 1,820 (-9%) | 2mo | $265,000 | $146 | 58 |
| 2812 Pelham Rd | 0.50mi | 3/1.0 | 2,208 (+10%) | 1mo | $130,000 | $59 | 58 |
| 1708 Parkview | 0.74mi | 3/2.5 | 1,956 (-3%) | 2mo | $305,000 | $156 | 56 |
| 2920 Buckingham Dr | 0.41mi | 3/1.5 | 1,734 (-14%) | 5mo | $200,000 | $115 | 54 |
| 2209 Edgebrook Dr | 0.66mi | 2/2.0 (-1) | 2,097 (+4%) | 4mo | $265,000 | $126 | 51 |
| 1111 Luther Ave Ave | 0.64mi | 3/1.0 | 1,752 (-13%) | 3mo | $180,000 | $103 | 44 |
Match score weights: distance 35% · size 25% · config 20% · recency 20%. Top-matched comps best support the ARV.
Projected returns pro-forma
-3.0% appreciation · 5.92% rent growth · sell at horizon
- IRR
- -11.8%
- Equity multiple
- 0.56×
- Total profit
- $-33,842
- Equity at exit
- $41,003
- IRR
- 1.5%
- Equity multiple
- 1.12×
- Total profit
- $9,617
- Equity at exit
- $23,777
Cash invested: $77,000 (down + closing). Projections, not guarantees.
Landlord ↔ Tenant lean methodology
- Overall (STATE)
- 43 Moderately Tenant-Leaning
- State Illinois
- 43 Moderately Tenant-Leaning · D+7
- County
- — inherits STATE
- City
- — inherits STATE
ZIP-level market 61107
- Home prices YoY
- -20.1%
- Rents YoY
- 5.9%
- Active inventory
- 157
- Price-to-rent
- 8.6×
Monthly cashflow live
- Estimated rent
- $2,679 medium interval (Pro) →
- Mortgage (P&I)
- −$1,442
- Tax from tax record
- −$521 /mo · $6,254/yr
- Insurance
- −$115
- HOA
- −$0
- Vacancy / Maint / Mgmt
- −$563
- Net cashflow
- $39
Break-even live
Sensitivity live
| Price | -10% $194 | -5% $117 | +0% $39 | +5% $-39 | +10% $-117 |
|---|---|---|---|---|---|
| Rent | -10% $-173 | -5% $-67 | +0% $39 | +5% $145 | +10% $250 |
| Rate | -1.0pp $177 | -0.5pp $109 | base $39 | +0.5pp $-32 | +1.0pp $-105 |
UW: 25.0% down · 7.5% · 30yr · 1.5% tax · 5.0% vac · 8.0% maint · 8.0% mgmt
Financing live
Cash to close
- Down payment
- $68,750
- Closing costs
- $8,250
- Reserves months
- —
- Total cash needed
- —
Loan-product check · same deal, 3 products live
Conventional
25% down · 7.5% · 30yr
- Down + closing
- —
- Monthly P&I
- —
- Monthly cashflow
- —
- DSCR
- —
- Eligible?
- —
Personal DTI + credit; lowest rate.
DSCR
20% down · 8.5% · 30yr
- Down + closing
- —
- Monthly P&I
- —
- Monthly cashflow
- —
- DSCR
- —
- Eligible?
- —
No personal income docs; deal must DSCR.
Hard money
10% down · 12.0% · 12mo
- Down + closing
- —
- Monthly P&I
- —
- Monthly cashflow
- —
- DSCR
- —
- Eligible?
- —
Short-term bridge; refi at stabilization.
Rent comps 3 comps
| Address | Beds | Baths | Sqft | Rent | $/sqft | DOM | Units | Dist |
|---|---|---|---|---|---|---|---|---|
| 4016 Eaton Dr Unit 1232695P Rockford, IL | 3.0 | 3.0 | 1722 | $4,169 | $2.42 | 14d | 1 | 0.96mi |
| 3121 Carefree Dr Rockford, IL | 4.0 | 2.5 | 3000 | $2,800 | $0.93 | 45d | 1 | 1.00mi |
| 4300 Eastridge Dr Unit 1 Rockford, IL | 3.0 | 2.0 | 1500 | $1,575 | $1.05 | 14d | 1 | 1.39mi |
Listing history 20 events
-
2026-05-05soldstatus $271,500
-
2026-03-19historical 3-char remark
Show marketing remark (3 chars)
SBR
-
2026-03-19$275,000 3-char remark
Show marketing remark (3 chars)
SBR
-
2026-03-19historical
Show marketing remark (3 chars)
SBR
-
2026-03-19$275,000
Show marketing remark (3 chars)
SBR
-
2019-03-15soldstatus $146,750
-
2019-03-13soldstatus $146,750 476-char remark
Show marketing remark (476 chars)
Location, location, location! Beautiful updated home with more than 2000 sq ft of living space. Newer stainless steel appliances, updated plumbing/electrical fixtures throughout. Formal living room with fireplace, formal dining room, huge main-floor family room perfect for entertaining. Updated full bath with double sinks, glass enclosed tub/shower. Spectacular hardwood floors. Private yard with deck and sprinkler system. Truly a home to be proud of and want to show off!
-
2018-12-05$152,500 476-char remark
Show marketing remark (476 chars)
Location, location, location! Beautiful updated home with more than 2000 sq ft of living space. Newer stainless steel appliances, updated plumbing/electrical fixtures throughout. Formal living room with fireplace, formal dining room, huge main-floor family room perfect for entertaining. Updated full bath with double sinks, glass enclosed tub/shower. Spectacular hardwood floors. Private yard with deck and sprinkler system. Truly a home to be proud of and want to show off!
-
2014-08-19soldstatus $133,500
-
2014-08-15soldstatus $133,500 Closed Sale
-
2014-08-15soldstatus $133,500
-
2014-07-19status Pending
-
2014-07-14$138,900 New
-
2014-07-14$138,900
-
2014-07-08historical
-
2014-05-28status Pending
-
2014-05-08New
-
2013-11-11historical
-
2013-07-16New
-
2009-05-04soldstatus $126,000
ⓘ Source: listings_history table (triggers on properties + properties_extension) + one-shot
backfill from property_details.listing_events for pre-trigger history.
Tax reassessment forecast IL · Partial reset (capped growth)
- Current annual tax
- $6,254 · $521/mo
- Projected year-2 tax
- $6,254 · $521/mo
- Expected delta
- $0/yr ($0/mo · 0.0%)
ⓘ Screening estimate from a state-policy table — verify with the county assessor before closing.
Climate risk First Street
- Flood 1/10 Low FEMA zone X (unshaded) · 0% chance over 30 yrs
- Wildfire 1/10 Low
- Heat 2/10 Low 7 d/yr ≥101°F today · 14 d/yr by 30 yrs out
- Wind 2/10 Low
- Air quality 3/10 Moderate 2 unhealthy d/yr today · 3 by 30 yrs out
Nearby sold comps map
Loading sold comps map…
Walkable amenities ~0.75 mi
Loading nearby amenities…
Taxation est. · year 1
- Rental income
- $32,151
- − Mortgage interest
- −$15,404
- − Property taxes
- −$6,254
- − Insurance
- −$1,375
- − Repairs & maintenance
- −$2,572
- − Management
- −$2,572
- − Depreciation
- −$8,000
- Taxable loss
- −$4,026
- Est. tax savings @ 24.0%
- +$966
- After-tax cash flow
- $1,431/yr
For passive investors: Depreciation is non-cash, so a rental often shows a tax loss while cash-flowing — sheltering income. Rental losses are passive: they offset passive income freely, and up to $25,000/yr can offset ordinary (W-2) income if you actively participate and your MAGI is under $100k (phasing out to $0 by $150k); unused losses carry forward. On sale, claimed depreciation is recaptured at up to 25%, and gains may owe capital-gains tax (a 1031 exchange can defer both). Figures are a year-1 estimate at your 24.0% rate — not tax advice; consult a CPA.
Schools (NCES district)
- District
- Rockford SD 205
- NCES district ID
- 1734510
- Math proficiency
- 12% ▼ -2.00%
- Reading proficiency
- 16% ▼ -3.00%
- Median HH income
- $42,533
- Composite
- 12.21/100
- National rank
- #9649
- State rank
- #533 of 620 in IL
Livability — Rockford
- Score
- 62/100
- State rank
- #876
- US rank
- #17035
Category grades
Schools grade is shown separately in the Schools card above.
Census & demographics
- Census place
- Rockford, IL
- County
- Winnebago County · 147,297 people
- City population
- 147,297
- Metro
- Rockford, IL
- Population (ZIP)
- 30,765
- Household income
- $78,574
- Rent vs Own
- Severe rent burden
- 981.0
Population outlook (Winnebago County) Hauer SSP2
- Today (2025)
- 271,080 people
- By 2030
- 260,684 · -3.8%
- By 2040
- 238,405 · -12.1%
- By 2050
- 216,129 · -20.3%
- By 2075
- 172,882 · -36.2%
- By 2100
- 135,336 · -50.1%
Race, ethnicity, and origin ACS 2023
- Neighborhood character
- Predominantly White (68%)
- Race & ethnicity
- White 68% Hispanic / Latino 15% Black 9% Two or more races 9% Asian 4% Native American 1%
- Hispanic origin (detail)
- Mexican 11% Puerto Rican 1%
- Common ancestry
- Romanian 6% Portuguese 4% Lithuanian 2%
- Foreign-born
- 10% · Canada, China
- Languages at home
- 83% English-only · Spanish 11% Arabic 1% Other Indo-European 1%
Political lean MEDSL · Winnebago
- 2024 margin
- Toss-up / Even · D 49.5% · R 49.0% · Other 1.5%
- 2008→2024 swing
- -12.2pp toward R · 2008: 12.8pp · 2024: 0.6pp
- All cycles
- 2024: D+0.6 2020: D+2.5 2016: R+1.2 2012: D+5.7 2008: D+12.8
Not yet ingested
- Civics
- —
Market trends
- HPI YoY
- ▼ -62.46%
- Current HPI
- 248.8598
- Rent YoY
- ▲ 5.92%
- Metro
- Rockford, IL
- State GDP YoY
- ▲ 1.59%
- F500 in state
- 60
Industry mix (Fortune 500 HQ in IL)
| Industry | F500 HQs | Revenue |
|---|---|---|
| Insurance | 4 | $201B |
|
||
| Consumer Goods | 4 | $87B |
|
||
| Industrial Machinery | 3 | $64B |
|
||
| Healthcare | 2 | $55B |
|
||
| Retail / Pharmacy | 1 | $148B |
|
||
| Agriculture / Food | 1 | $86B |
|
||
Price history
+115.5% since first listed20 events — show timeline
- 2026-05-05 Sold (Public Records) $271,500 Public Records
- 2026-03-19 Listed $275,000 MRED as Distributed by MLS Grid
- 2026-03-19 Listing Removed — MRED as Distributed by MLS Grid
- 2026-03-19 Listed $275,000 NWIAR
- 2026-03-19 Delisted — NWIAR
- 2019-03-15 Sold (Public Records) $146,750 Public Records
- 2019-03-13 Sold (MLS) $146,750 NWIAR
- 2018-12-05 Listed $152,500 NWIAR
- 2014-08-19 Sold (Public Records) $133,500 Public Records
- 2014-08-15 Sold (MLS) $133,500 MRED as Distributed by MLS Grid
- 2014-08-15 Sold (MLS) $133,500 NWIAR
- 2014-07-19 Pending — MRED as Distributed by MLS Grid
- 2014-07-14 Listed $138,900 MRED as Distributed by MLS Grid
- 2014-07-14 Listed $138,900 NWIAR
- 2014-07-08 Listing Removed — MRED as Distributed by MLS Grid
- 2014-05-28 Pending — MRED as Distributed by MLS Grid
- 2014-05-08 Listed — MRED as Distributed by MLS Grid
- 2013-11-11 Listing Removed — MRED as Distributed by MLS Grid
- 2013-07-16 Listed — MRED as Distributed by MLS Grid
- 2009-05-04 Sold (Public Records) $126,000 Public Records
Property tax history
+3.3%/yrLatest (2024): $6,254 · +4.8% YoY. Source: county tax records.
Cash-flow waterfall
monthlySold comps — $/sqft
last 12 mo · ≤1 miLoading sold comps…