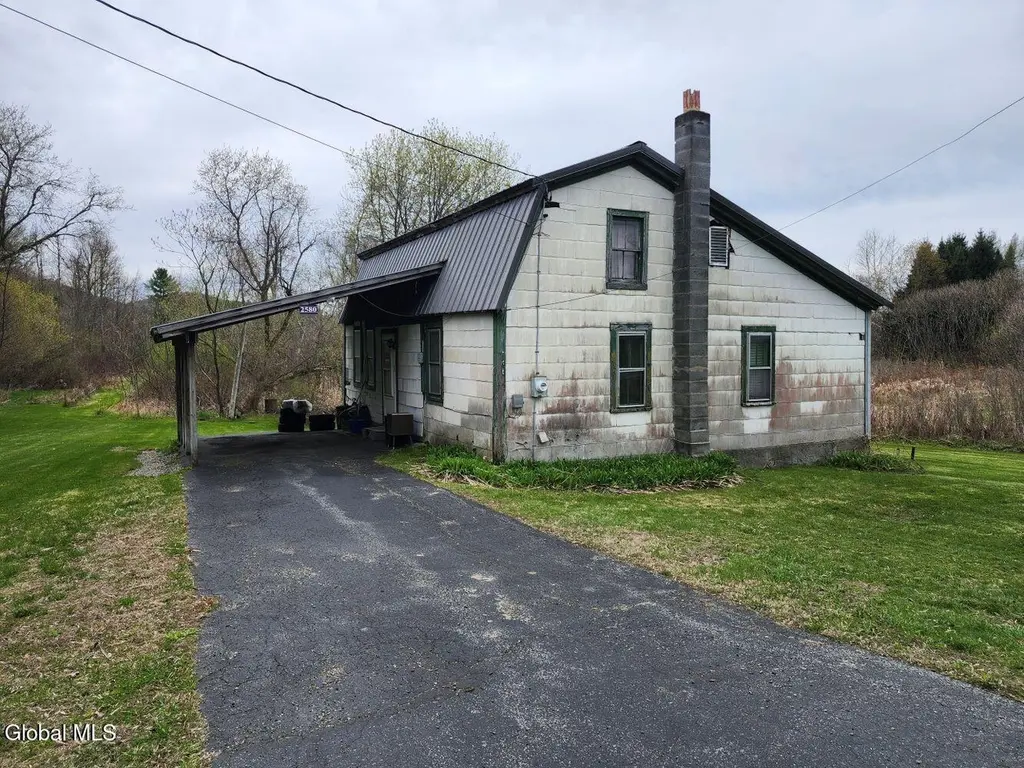
2580 County Route 17 · North Granville, NY
Flood risk 6/10 · Moderate
- FEMA flood zone
- X
- Chance of flooding over 30 yrs
- 0.74%
- Est. flood insurance / yr
- $473 – $860
Fire risk 3/10 · Minor
- Est. fire insurance / yr
- $691 – $1,283
Heat risk 3/10 · Minor
- Hot days now (above 95°F)
- 7 days/yr
- Hot days in 30 yrs
- 16 days/yr
Wind risk 2/10 · Minimal
- Chance of severe wind over 30 yrs
- 4.0%
Air-quality risk 2/10 · Minimal
- Unhealthy air days now
- 0 days/yr
- Unhealthy air days in 30 yrs
- 1 days/yr
Risk factors via First Street. Map © Google.
Why this score? — see what drove the B grade
The composite is a weighted blend of 9 inputs, each scored 0–100. Each bar is that input's sub-score; the figure is the points it added to the 100-point composite (weight × sub-score).
- Cash flow +30.0/30.0
- 1% rule +10.0/10.0
- DSCR +10.0/10.0
- ARV discount +7.5/15.0
- Appreciation +4.4/10.0
- Schools +3.4/10.0
- Rent growth +2.5/5.0
- Livability +2.5/5.0
- Condition / age +2.5/5.0
$42,000
🖨 Deal sheet 📄 Offer letter ✓ Due diligence
Listing remarks
Lots of potential is found in this 2 bedroom, farmhouse, situated on 1.8 acres in a quiet country location. There's a nice 3-seasons room off the kitchen, a modern oil hot-air heating system, 100 amp electrical service, municipal water, a paved driveway and attached car port. The mostly level lot has a small seasonal stream that runs through it and there's a small meadow in the back, perfect for gardening or animals. The property is being sold as. Cash or rehab loan only.
Key facts
- 3-seasons room
- Municipal water
- Attached car port
Tags
Property features AI
Exterior
- Parking: Paved parking, carport and driveway for a total of 3 parking spaces
- Utilities: Public water; Septic tank; 100 amp electric service with circuit breakers
- Home design: Single family residence; 1,200 sq ft living area
- Construction: Combination and stone foundation; Asbestos, shingle, Tex 11 and vinyl siding
- Exterior features: Metal roof; Paved driveway; Storm doors; Stream and swamp on the property; Level, cleared lot with road frontage
Interior
- Kitchen: Range; Refrigerator
- Bedrooms: Two bedrooms on the second floor
- Flooring: Vinyl; Carpet; Linoleum
- Bathrooms: One full bathroom (first floor)
- Heating & cooling: Forced air oil heating
- Interior features: Paddle fan; 3-season room; Den; Living room
- Laundry & utility: Washer and dryer; Laundry on the main level; Electric water heater
Neighborhood map
What this means for you Summary
Snapshot
- This is a 2-bed/1.0-bath single-family listed at $42k.
Deal economics
- At list price, monthly cash flow is $560 ($7k/yr) — positive.
- The deal already cash-flows at list — no discount required.
- Meets the 1% rule at list price ($1k rent vs $42k).
Location & tenants
- Location reads: area grade B — affects rentability + tenant quality, not the cash-flow math above.
- Granville Central School District (town): math 38% / reading 43% proficiency, ranked #521 of 590 in NY (top 88%) — families likely to look elsewhere, expect single-tenant / working-renter base with shorter leases.
- Zoned schools: Granville Junior-Senior High School (math 57% / reading 42%, grade D, #974 of 1,100 statewide, top 91%, 496 students, 40% FRL) — zoned schools at 40% FRL track the district average.
- Market conditions: 59 active listings in the ZIP; 106 units permitted in Washington County in 2024 (0 in 5+ unit buildings).
Forward outlook
- Local home prices are declining (-1.3%/yr); year-one equity from $290 of loan paydown is wiped out by about $545 of value loss. Plan a longer hold.
- Washington County population projected at -20% by 2050 — secular population decline; favor cash flow + early exit over multi-decade hold.
- At projected returns (-1.3% appreciation + 3.0% rent growth), your $12k cash investment doubles in ~2 years — after that, you're playing with house money.
Negotiation context
- Only 3 days on market — expect competitive offers; lowballing is unlikely to land.
Risks & watch-outs
- Watch-outs: property tax is 3.2% of price; built in 1880 — expect roof / HVAC / electrical / plumbing capex.
- Climate carrying-cost: major flood risk — expect insurance premiums to compound above CPI over the hold.
Questions for the listing agent
- Built in 1880 — when were the roof, HVAC, electrical panel, plumbing, and water heater last replaced?
- Property tax is high relative to price — has the assessment been appealed recently, and will the sale trigger a re-assessment?
- Is there a deadline driving the sale (1031 exchange, divorce, estate, relocation)? That informs how much negotiation room exists.
- What's the average days-on-market for RENTAL listings here right now (not sales)? A rising rental-DOM trend means longer vacancies and softer asking-rent achievability than the comps imply.
- What's the recent tenant-quality profile in this submarket — average credit score on applications, eviction rate, late-payment / NSF rate, and stable-employment percentage? A property-management company in the area should have these aggregated.
- How much new for-sale + rental construction is in the pipeline within 1–3 miles? Heavy new supply typically softens prices + rents 12–24 months out; constrained supply supports both.
Investment metrics
- 1% rule
- 2.74% ✓
- Cap rate
- 22.30%
- Cash-on-cash
- 57.18%
- DSCR
- 3.54
- GRM
- 3.0
CMA / ARV
- ARV (median comp)
- $233,669
- List price
- $42,000
- Delta
- -82.03%
- Verdict
- UNDERPRICED
- Comps
- 12 within 1.0 mi
Show comp detail 2 sales within ~0.75 mi
| Address | Dist | Beds/Ba | Sqft | Sold | Price | $/sf | Match |
|---|---|---|---|---|---|---|---|
| 10459 State Route 22 | 0.53mi | 3/1.0 (+1) | 1,141 (-5%) | 10mo | $120,000 | $105 | 53 |
| 10538 State Route 22 | 0.66mi | 3/1.0 (+1) | 1,193 (-1%) | 22mo | $207,000 | $174 | 45 |
Match score weights: distance 35% · size 25% · config 20% · recency 20%. Top-matched comps best support the ARV.
Projected returns pro-forma
-1.3% appreciation · 3.0% rent growth · sell at horizon
- IRR
- 57.5%
- Equity multiple
- 3.72×
- Total profit
- $32,019
- Equity at exit
- $9,542
- IRR
- 61.0%
- Equity multiple
- 7.54×
- Total profit
- $76,905
- Equity at exit
- $9,521
Cash invested: $11,760 (down + closing). Projections, not guarantees.
Landlord ↔ Tenant lean methodology
- Overall (STATE)
- 15 Strongly Tenant-Friendly
- State New York
- 15 Strongly Tenant-Friendly · D+10
- County
- — inherits STATE
- City
- — inherits STATE
ZIP-level market 12832
- Home prices YoY
- -0.4%
- Active inventory
- 59
- Price-to-rent
- 3.0×
Monthly cashflow live
- Estimated rent
- $1,152 medium interval (Pro) →
- Mortgage (P&I)
- −$220
- Tax from tax record
- −$112 /mo · $1,343/yr
- Insurance
- −$18
- HOA
- −$0
- Vacancy / Maint / Mgmt
- −$242
- Net cashflow
- $560
Break-even live
UW: 25.0% down · 7.5% · 30yr · 1.5% tax · 5.0% vac · 8.0% maint · 8.0% mgmt
Financing live
Cash to close
- Down payment
- $10,500
- Closing costs
- $1,260
- Reserves months
- —
- Total cash needed
- —
Loan-product check · same deal, 3 products live
Conventional
25% down · 7.5% · 30yr
- Down + closing
- —
- Monthly P&I
- —
- Monthly cashflow
- —
- DSCR
- —
- Eligible?
- —
Personal DTI + credit; lowest rate.
DSCR
20% down · 8.5% · 30yr
- Down + closing
- —
- Monthly P&I
- —
- Monthly cashflow
- —
- DSCR
- —
- Eligible?
- —
No personal income docs; deal must DSCR.
Hard money
10% down · 12.0% · 12mo
- Down + closing
- —
- Monthly P&I
- —
- Monthly cashflow
- —
- DSCR
- —
- Eligible?
- —
Short-term bridge; refi at stabilization.
Listing history 2 events
-
2026-05-05status Pending 477-char remark
-
2026-04-30$42,000 Active 477-char remark
ⓘ Source: listings_history table (triggers on properties + properties_extension) + one-shot
backfill from property_details.listing_events for pre-trigger history.
Tax reassessment forecast NY · Partial reset (capped growth)
- Current annual tax
- $1,343 · $112/mo
- Projected year-2 tax
- $1,343 · $112/mo
- Expected delta
- $0/yr ($0/mo · 0.0%)
ⓘ Screening estimate from a state-policy table — verify with the county assessor before closing.
Climate risk First Street
- Flood 6/10 Major FEMA zone X · 74% chance over 30 yrs
- Wildfire 3/10 Moderate
- Heat 3/10 Moderate 7 d/yr ≥95°F today · 16 d/yr by 30 yrs out
- Wind 2/10 Low 4% chance of damaging wind over 30 yrs
- Air quality 2/10 Low 0 unhealthy d/yr today · 1 by 30 yrs out
Nearby sold comps map
Loading sold comps map…
Walkable amenities ~0.75 mi
Loading nearby amenities…
Taxation est. · year 1
- Rental income
- $13,822
- − Mortgage interest
- −$2,353
- − Property taxes
- −$1,343
- − Insurance
- −$210
- − Repairs & maintenance
- −$1,106
- − Management
- −$1,106
- − Depreciation
- −$1,222
- Taxable income
- $6,484
- Est. tax owed @ 24.0%
- −$1,556
- After-tax cash flow
- $5,168/yr
For passive investors: Depreciation is non-cash, so a rental often shows a tax loss while cash-flowing — sheltering income. Rental losses are passive: they offset passive income freely, and up to $25,000/yr can offset ordinary (W-2) income if you actively participate and your MAGI is under $100k (phasing out to $0 by $150k); unused losses carry forward. On sale, claimed depreciation is recaptured at up to 25%, and gains may owe capital-gains tax (a 1031 exchange can defer both). Figures are a year-1 estimate at your 24.0% rate — not tax advice; consult a CPA.
Schools (NCES district)
- District
- Granville Central School District
- NCES district ID
- 3612450
- Math proficiency
- 38% ▼ -5.00%
- Reading proficiency
- 43% ▼ -3.00%
- Median HH income
- $43,936
- Composite
- 34.32/100
- National rank
- #5237
- State rank
- #521 of 590 in NY
Livability — North Granville
No livability data for this city. (Only ~50 U.S. cities are tracked.)
Census & demographics
- Census place
- North Granville, NY
- Population (ZIP)
- 6,395
Population outlook (Washington County) Hauer SSP2
- Today (2025)
- 59,576 people
- By 2030
- 57,618 · -3.3%
- By 2040
- 52,751 · -11.5%
- By 2050
- 47,514 · -20.2%
- By 2075
- 35,690 · -40.1%
- By 2100
- 24,807 · -58.4%
Race, ethnicity, and origin ACS 2023
- Neighborhood character
- Predominantly White (88%)
- Race & ethnicity
- White 88% Two or more races 6% Black 2% Hispanic / Latino 2% Asian 2%
- Common ancestry
- Lithuanian 7% Romanian 4% Iranian 1%
- Foreign-born
- 3% · Canada
- Languages at home
- 98% English-only · Spanish 1%
Political lean MEDSL · Washington
- 2024 margin
- Strong R (+21.2) · D 39.4% · R 60.6%
- 2008→2024 swing
- -22.0pp toward R · 2008: 0.8pp · 2024: -21.2pp
- All cycles
- 2024: R+21.2 2020: R+15.6 2016: R+20.2 2012: D+1.6 2008: D+0.8
Not yet ingested
- Civics
- —
Market trends
- HPI YoY
- ▼ -1.30%
- Current HPI
- 326.4556
- Rent YoY
- —
- Metro
- —
- State GDP YoY
- ▲ 2.60%
- F500 in state
- 92
Industry mix (Fortune 500 HQ in NY)
| Industry | F500 HQs | Revenue |
|---|---|---|
| Financial Services | 10 | $950B |
|
||
| Consumer Goods | 9 | $162B |
|
||
| Insurance | 4 | $225B |
|
||
| Telecommunications | 2 | $144B |
|
||
| Pharmaceuticals | 2 | $112B |
|
||
| Media / Entertainment | 2 | $69B |
|
||
Price history
-10.7% since first listed3 events — show timeline
- 2026-06-16 Sold (MLS) $37,500 Global MLS
- 2026-05-05 Pending — Global MLS
- 2026-04-30 Listed $42,000 Global MLS
Property tax history
+11.3%/yrLatest (2025): $1,343 · +2.7% YoY. Source: county tax records.
Cash-flow waterfall
monthlySold comps — $/sqft
last 12 mo · ≤1 miLoading sold comps…