 9-Plex
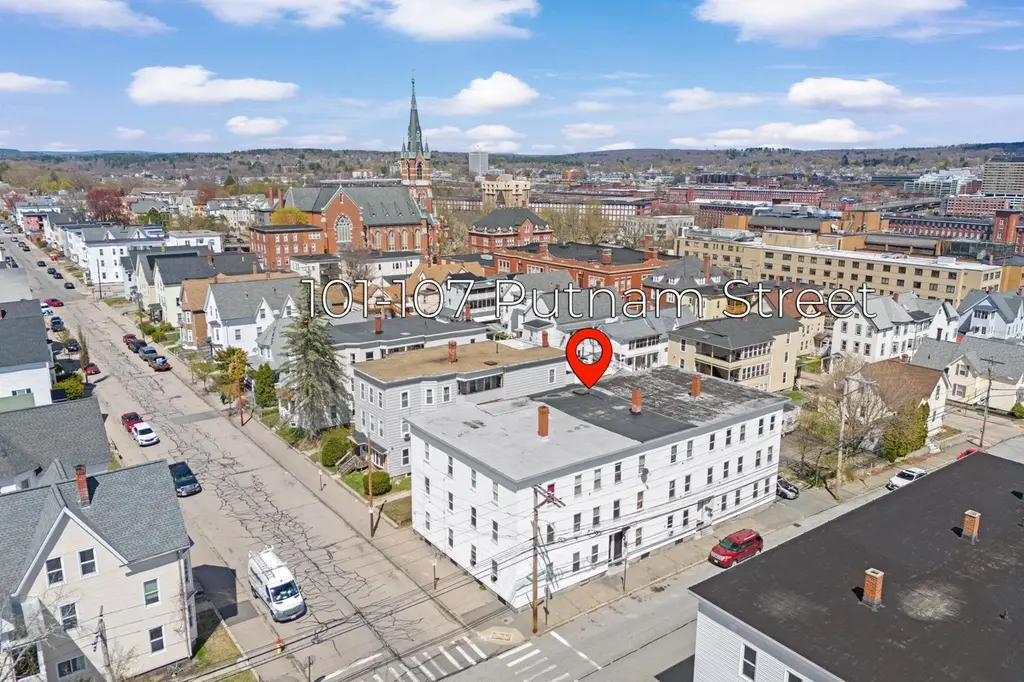
101-107 Putnam St · Manchester, NH
Flood risk 1/10 · Minimal
- FEMA flood zone
- X (unshaded)
- Chance of flooding over 30 yrs
- 0.0%
- Est. flood insurance / yr
- $507 – $1,088
Fire risk 1/10 · Minimal
- Est. fire insurance / yr
- $507 – $941
Heat risk 4/10 · Minor
- Hot days now (above 95°F)
- 7 days/yr
- Hot days in 30 yrs
- 16 days/yr
Wind risk 5/10 · Moderate
- Chance of severe wind over 30 yrs
- 24.0%
Air-quality risk 2/10 · Minimal
- Unhealthy air days now
- 1 days/yr
- Unhealthy air days in 30 yrs
- 2 days/yr
Risk factors via First Street. Map © Google.
Why this score? — see what drove the C grade
The composite is a weighted blend of 9 inputs, each scored 0–100. Each bar is that input's sub-score; the figure is the points it added to the 100-point composite (weight × sub-score).
- Cash flow +25.7/30.0
- DSCR +8.6/10.0
- ARV discount +7.5/15.0
- 1% rule +6.3/10.0
- Livability +4.2/5.0
- Rent growth +3.2/5.0
- Condition / age +2.5/5.0
- Schools +1.9/10.0
- Appreciation +0.0/10.0
$1,899,900
🖨 Deal sheet 📄 Offer letter ✓ Due diligence
Multi-family units
County records classify this as Multi-Family (5+ Unit). Listing-text estimate: 9 units. confirmed
5+ unit building — per-unit beds/baths from public records are typically unavailable; the breakdown below (if shown) is an estimate from the listing text.
Listing remarks MLS
This 9-unit residential building strikes a solid balance between cash flow, efficiency, and long-term value making it a prime opportunity for investors looking for a dependable income property. The building offers a practical mix of layouts: three 4-bedroom/1-bathroom units and six 3-bedroom/1-bathroom units. The layouts are efficiently designed with good natural light, and each unit includes washer and dryer hookups for added tenant convenience. The unit mix appeals to a broad range of renters, supporting consistent occupancy. For investors, the numbers speak for themselves: a diverse unit mix, low-maintenance layout, and strong tenant demand add up to a property built for steady, reliable returns well into the future.
Key facts
- 0.36 acre lot
- Built 1890
- Listed 50 days
Neighborhood map
What this means for you Summary
Snapshot
- This is a 3×4bd/1ba + 6×3bd/1ba units multifamily listed at $1.90M.
Deal economics
- At list price, monthly cash flow is $5k ($55k/yr) — positive. Per door: $509/mo.
- The deal already cash-flows at list — no discount required.
- Meets the 1% rule at list price ($22k rent vs $1.90M).
- Recommended offer: $1.84M (3.0% below list) — sets the bar for market timing.
- Cap rate 9.2% vs local median 3.1% in Manchester — top-decile yield for the area; either an underpriced asset or a hidden risk that comps aren't pricing in. Stress-test before assuming the spread holds.
Location & tenants
- Location reads 83/100 on livability (#10 in NH, #879 nationally) — a professional / high-income tenant draw. Strengths: amenities A+, commute A+, housing A+.
- Manchester School District (urban): math 14% / reading 27% proficiency, ranked #96 of 98 in NH (top 98%) — low school quality limits family demand, transient renter base, plan for 1-2y turnover.
- Market conditions: Rents rising (+3.0%/yr); 71 active listings in the ZIP; 981 units permitted in Hillsborough County in 2024 (381 in 5+ unit buildings).
- At $21,533/mo this rent would consume 348% of the median local household income ($74k/yr) (locally 1368% of renters already pay >50% of income on rent) — very limited rent-growth headroom before tenants either downsize or default.
Forward outlook
- Local home prices are declining (-3.0%/yr); year-one equity from $13k of loan paydown is wiped out by about $57k of value loss. Plan a longer hold.
- Hillsborough County population projected to shrink 8% by 2050 — rents likely to lag national; underwrite the cash flow, not the appreciation.
Negotiation context
- It's been on market 50 days — a 3% lower offer ($1.84M) is reasonable based on typical stale-listing flexibility.
- 5 sale attempts since 22y ago; this cycle's ask has dropped $100k (5%) from the opening price — seller is motivated, your offer sets the floor, not the list.
- Current owner paid $1.32M; 43% above their basis — modest negotiation headroom, anchor on the comps not their cost.
Risks & watch-outs
- Watch-outs: built in 1890 — expect roof / HVAC / electrical / plumbing capex.
- Climate carrying-cost: moderate wind risk, 24% chance of damaging wind over 30y — expect insurance premiums to compound above CPI over the hold.
Questions for the listing agent
- It's been on market 50 days. Have you received any prior offers? Is the seller open to a 3% concession, seller financing, or rate buy-down credit?
- Can we see the unit-by-unit rent roll, current vacancy, and any below-market leases? What's the average tenancy length?
- What capital expenditures (roof, boiler, parking lot, exteriors) have been made in the last 5 years, and what's planned in the next 2?
- Built in 1890 — when were the roof, HVAC, electrical panel, plumbing, and water heater last replaced?
- Is there a deadline driving the sale (1031 exchange, divorce, estate, relocation)? That informs how much negotiation room exists.
- What's the average days-on-market for RENTAL listings here right now (not sales)? A rising rental-DOM trend means longer vacancies and softer asking-rent achievability than the comps imply.
- What's the recent tenant-quality profile in this submarket — average credit score on applications, eviction rate, late-payment / NSF rate, and stable-employment percentage? A property-management company in the area should have these aggregated.
- How much new apartment / multifamily construction is in the pipeline within 1–3 miles? Heavy new supply (>2% of stock underway) typically softens rents 12–24 months out; light construction supports rent growth.
Investment metrics
- 1% rule
- 1.13% ✓
- Cap rate
- 9.18%
- Cash-on-cash
- 10.33%
- DSCR
- 1.46
- GRM
- 7.4
CMA / ARV
- ARV (median comp)
- $1,154,083
- List price
- $1,899,900
- Delta
- 64.62%
- Verdict
- OVERPRICED
- Comps
- 3 within 1.0 mi
Projected returns pro-forma
-3.0% appreciation · 2.96% rent growth · sell at horizon
- IRR
- -0.9%
- Equity multiple
- 0.97×
- Total profit
- $-17,270
- Equity at exit
- $283,281
- IRR
- 8.8%
- Equity multiple
- 1.67×
- Total profit
- $356,426
- Equity at exit
- $164,269
Cash invested: $531,972 (down + closing). Projections, not guarantees.
Landlord ↔ Tenant lean methodology
- Overall (STATE)
- 56 Moderately Landlord-Leaning
- State New Hampshire
- 56 Moderately Landlord-Leaning · D+1
- County
- — inherits STATE
- City
- — inherits STATE
ZIP-level market 03102
- Home prices YoY
- -16.2%
- Rents YoY
- 3.0%
- Active inventory
- 71
- Price-to-rent
- 63.5×
Monthly cashflow live
- Estimated rent
- $21,533 high interval (Pro) →
- Mortgage (P&I)
- −$9,963
- Tax from tax record
- −$1,678 /mo · $20,140/yr
- Insurance
- −$792
- HOA
- −$0
- Vacancy / Maint / Mgmt
- −$4,522
- Net cashflow
- $4,578
Break-even live
9-unit breakdown (identical units grouped — click to expand)
| Units | Beds | Baths | Est. rent |
|---|---|---|---|
| 3× units | 4 | 1 | $7,476 |
| #1 | 4 | 1 | $2,492 |
| #2 | 4 | 1 | $2,492 |
| #3 | 4 | 1 | $2,492 |
| 6× units | 3 | 1 | $14,058 |
| #4 | 3 | 1 | $2,343 |
| #5 | 3 | 1 | $2,343 |
| #6 | 3 | 1 | $2,343 |
| #7 | 3 | 1 | $2,343 |
| #8 | 3 | 1 | $2,343 |
| #9 | 3 | 1 | $2,343 |
| Total (9 units) | $21,533 | ||
UW: 25.0% down · 7.5% · 30yr · 1.5% tax · 5.0% vac · 8.0% maint · 8.0% mgmt
Financing live
Cash to close
- Down payment
- $474,975
- Closing costs
- $56,997
- Reserves months
- —
- Total cash needed
- —
Loan-product check · same deal, 3 products live
Conventional
25% down · 7.5% · 30yr
- Down + closing
- —
- Monthly P&I
- —
- Monthly cashflow
- —
- DSCR
- —
- Eligible?
- —
Personal DTI + credit; lowest rate.
DSCR
20% down · 8.5% · 30yr
- Down + closing
- —
- Monthly P&I
- —
- Monthly cashflow
- —
- DSCR
- —
- Eligible?
- —
No personal income docs; deal must DSCR.
Hard money
10% down · 12.0% · 12mo
- Down + closing
- —
- Monthly P&I
- —
- Monthly cashflow
- —
- DSCR
- —
- Eligible?
- —
Short-term bridge; refi at stabilization.
Listing history 31 events
-
2026-06-18days on market $1,899,900 Active 50 DOM
-
2026-06-17days on market $1,899,900 Active 49 DOM
-
2026-06-16days on market $1,899,900 Active 48 DOM
-
2026-06-15pricedays on market $1,899,900 Active 47 DOM
-
2026-06-14days on market $2,000,000 Active 45 DOM
-
2026-06-13days on market $2,000,000 Active 44 DOM
-
2026-06-10days on market $2,000,000 Active 42 DOM
-
2026-06-09days on market $2,000,000 Active 41 DOM
-
2026-06-08days on market $2,000,000 Active 40 DOM
-
2026-06-07days on market $2,000,000 Active 39 DOM
-
2026-06-03days on market $2,000,000 Active 35 DOM
-
2026-06-02days on market $2,000,000 Active 34 DOM
-
2026-06-01days on market $2,000,000 Active 33 DOM
-
2026-05-31days on market $2,000,000 Active 32 DOM
-
2026-05-30days on market $2,000,000 Active 31 DOM
-
2026-04-29$2,000,000 Active 729-char remark
Show marketing remark (729 chars)
This 9-unit residential building strikes a solid balance between cash flow, efficiency, and long-term value making it a prime opportunity for investors looking for a dependable income property. The building offers a practical mix of layouts: three 4-bedroom/1-bathroom units and six 3-bedroom/1-bathroom units. The layouts are efficiently designed with good natural light, and each unit includes washer and dryer hookups for added tenant convenience. The unit mix appeals to a broad range of renters, supporting consistent occupancy. For investors, the numbers speak for themselves: a diverse unit mix, low-maintenance layout, and strong tenant demand add up to a property built for steady, reliable returns well into the future.
-
2021-12-22soldstatus $1,325,000 Closed 340-char remark
Show marketing remark (340 chars)
BACK TO THE MARKET -- Gross income $168,780 NOI $132,475.97 Cap rate 9.5% Investors take note: Rare opportunity to own a 9 unit multi family consisting of highly sought after 3 and 4 bedroom units. This building consists of six 3 bedrooms and three 4 bedrooms with washer dryer hookups in each unit and the tenants pay their own utilities.
-
2021-12-22soldstatus $1,325,000
Show marketing remark (340 chars)
BACK TO THE MARKET -- Gross income $168,780 NOI $132,475.97 Cap rate 9.5% Investors take note: Rare opportunity to own a 9 unit multi family consisting of highly sought after 3 and 4 bedroom units. This building consists of six 3 bedrooms and three 4 bedrooms with washer dryer hookups in each unit and the tenants pay their own utilities.
-
2021-10-25status Pending 340-char remark
Show marketing remark (340 chars)
BACK TO THE MARKET -- Gross income $168,780 NOI $132,475.97 Cap rate 9.5% Investors take note: Rare opportunity to own a 9 unit multi family consisting of highly sought after 3 and 4 bedroom units. This building consists of six 3 bedrooms and three 4 bedrooms with washer dryer hookups in each unit and the tenants pay their own utilities.
-
2021-10-07status Active 340-char remark
Show marketing remark (340 chars)
BACK TO THE MARKET -- Gross income $168,780 NOI $132,475.97 Cap rate 9.5% Investors take note: Rare opportunity to own a 9 unit multi family consisting of highly sought after 3 and 4 bedroom units. This building consists of six 3 bedrooms and three 4 bedrooms with washer dryer hookups in each unit and the tenants pay their own utilities.
-
2021-09-14status Pending 340-char remark
Show marketing remark (340 chars)
BACK TO THE MARKET -- Gross income $168,780 NOI $132,475.97 Cap rate 9.5% Investors take note: Rare opportunity to own a 9 unit multi family consisting of highly sought after 3 and 4 bedroom units. This building consists of six 3 bedrooms and three 4 bedrooms with washer dryer hookups in each unit and the tenants pay their own utilities.
-
2021-09-02$1,400,000 Active 340-char remark
Show marketing remark (340 chars)
BACK TO THE MARKET -- Gross income $168,780 NOI $132,475.97 Cap rate 9.5% Investors take note: Rare opportunity to own a 9 unit multi family consisting of highly sought after 3 and 4 bedroom units. This building consists of six 3 bedrooms and three 4 bedrooms with washer dryer hookups in each unit and the tenants pay their own utilities.
-
2019-12-20soldstatus $800,000 Closed
-
2019-12-20soldstatus $800,000
-
2019-10-26status Pending
-
2019-10-22$750,000 Active
-
2004-07-06soldstatus $500,000
-
2004-07-02soldstatus $500,000
-
2004-07-01historical
-
2004-06-30$529,000
-
2004-04-14soldstatus $400,000
ⓘ Source: listings_history table (triggers on properties + properties_extension) + one-shot
backfill from property_details.listing_events for pre-trigger history.
Tax reassessment forecast NH · Partial reset (capped growth)
- Current annual tax
- $20,140 · $1,678/mo
- Projected year-2 tax
- $30,779 · $2,565/mo
- Expected delta
- +$10,639/yr (+$887/mo · 52.8%)
ⓘ Screening estimate from a state-policy table — verify with the county assessor before closing.
Climate risk First Street
- Flood 1/10 Low FEMA zone X (unshaded) · 0% chance over 30 yrs
- Wildfire 1/10 Low
- Heat 4/10 Moderate 7 d/yr ≥95°F today · 16 d/yr by 30 yrs out
- Wind 5/10 Major 24% chance of damaging wind over 30 yrs
- Air quality 2/10 Low 1 unhealthy d/yr today · 2 by 30 yrs out
Nearby sold comps map
Loading sold comps map…
Walkable amenities ~0.75 mi
Loading nearby amenities…
Taxation est. · year 1
- Rental income
- $258,396
- − Mortgage interest
- −$106,424
- − Property taxes
- −$20,140
- − Insurance
- −$9,500
- − Repairs & maintenance
- −$20,672
- − Management
- −$20,672
- − Depreciation
- −$55,270
- Taxable income
- $25,719
- Est. tax owed @ 24.0%
- −$6,173
- After-tax cash flow
- $48,761/yr
For passive investors: Depreciation is non-cash, so a rental often shows a tax loss while cash-flowing — sheltering income. Rental losses are passive: they offset passive income freely, and up to $25,000/yr can offset ordinary (W-2) income if you actively participate and your MAGI is under $100k (phasing out to $0 by $150k); unused losses carry forward. On sale, claimed depreciation is recaptured at up to 25%, and gains may owe capital-gains tax (a 1031 exchange can defer both). Figures are a year-1 estimate at your 24.0% rate — not tax advice; consult a CPA.
Schools (NCES district)
- District
- Manchester School District
- NCES district ID
- 3304590
- Math proficiency
- 14% ▼ -10.00%
- Reading proficiency
- 27% ▼ -6.00%
- Median HH income
- $54,096
- Composite
- 18.67/100
- National rank
- #8886
- State rank
- #96 of 98 in NH
Livability — Manchester
- Score
- 83/100
- State rank
- #10
- US rank
- #879
Category grades
Schools grade is shown separately in the Schools card above.
Census & demographics
- Census place
- Manchester, NH
- County
- Hillsborough County · 309,362 people
- City population
- 110,172
- Metro
- Manchester-Nashua, NH
- Population (ZIP)
- 33,959
- Household income
- $74,327
- Rent vs Own
- Severe rent burden
- 1368.0
Population outlook (Hillsborough County) Hauer SSP2
- Today (2025)
- 412,771 people
- By 2030
- 410,974 · -0.4%
- By 2040
- 399,959 · -3.1%
- By 2050
- 381,542 · -7.6%
- By 2075
- 339,855 · -17.7%
- By 2100
- 289,270 · -29.9%
Race, ethnicity, and origin ACS 2023
- Neighborhood character
- Predominantly White (75%)
- Race & ethnicity
- White 75% Hispanic / Latino 9% Two or more races 8% Black 6% Asian 5%
- Hispanic origin (detail)
- Mexican 1% Puerto Rican 3% Dominican 2%
- Common ancestry
- Lithuanian 11% Romanian 3% Slovak 3%
- Foreign-born
- 14% · Canada, China, India
- Languages at home
- 81% English-only · Spanish 5% French/Haitian/Cajun 5% Other Indo-European 3%
Political lean MEDSL · Hillsborough
- 2024 margin
- Toss-up / Even · D 50.9% · R 48.0% · Other 1.0%
- 2008→2024 swing
- -0.9pp no change · 2008: 3.8pp · 2024: 2.9pp
- All cycles
- 2024: D+2.9 2020: D+7.7 2016: R+0.2 2012: D+1.7 2008: D+3.8
Not yet ingested
- Civics
- —
Market trends
- HPI YoY
- ▼ -68.62%
- Current HPI
- 355.9606
- Rent YoY
- ▲ 2.96%
- Metro
- Manchester-Nashua, NH
- State GDP YoY
- —
- F500 in state
- 0
Price history
+400.0% since first listed16 events — show timeline
- 2026-04-29 Listed $2,000,000 PrimeMLS
- 2021-12-22 Sold (Public Records) $1,325,000 Public Records
- 2021-12-22 Sold (MLS) $1,325,000 PrimeMLS
- 2021-10-25 Pending — PrimeMLS
- 2021-10-07 Relisted — PrimeMLS
- 2021-09-14 Pending — PrimeMLS
- 2021-09-02 Listed $1,400,000 PrimeMLS
- 2019-12-20 Sold (Public Records) $800,000 Public Records
- 2019-12-20 Sold (MLS) $800,000 PrimeMLS
- 2019-10-26 Pending — PrimeMLS
- 2019-10-22 Listed $750,000 PrimeMLS
- 2004-07-06 Sold (MLS) $500,000 PrimeMLS
- 2004-07-02 Sold (Public Records) $500,000 Public Records
- 2004-07-01 Delisted — PrimeMLS
- 2004-06-30 Listed $529,000 PrimeMLS
- 2004-04-14 Sold (Public Records) $400,000 Public Records
Property tax history
+6.7%/yrLatest (2024): $20,140 · +3.8% YoY. Source: county tax records.
Cash-flow waterfall
monthlySold comps — $/sqft
last 12 mo · ≤1 miLoading sold comps…