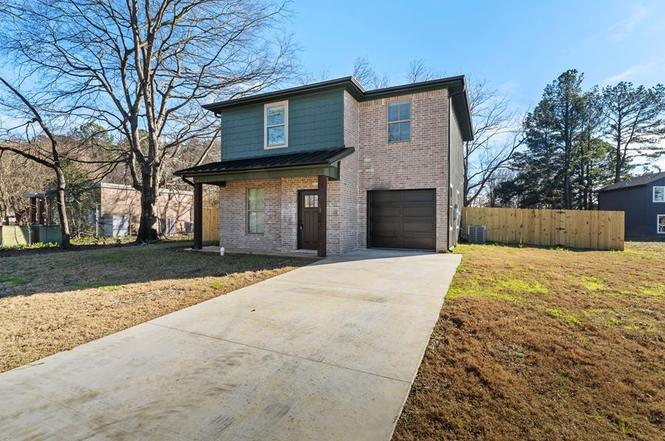
3105 Bethany Ln · Texarkana, TX
Flood risk No data
- FEMA flood zone
- —
- Chance of flooding over 30 yrs
- —
- Est. flood insurance / yr
- —
Fire risk No data
- Est. fire insurance / yr
- —
Heat risk No data
- Hot days now (above threshold)
- —
- Hot days in 30 yrs
- —
Wind risk No data
- Chance of severe wind over 30 yrs
- —
Air-quality risk No data
- Unhealthy air days now
- —
- Unhealthy air days in 30 yrs
- —
Risk factors via First Street. Map © Google.
Why this score? — see what drove the D grade
The composite is a weighted blend of 9 inputs, each scored 0–100. Each bar is that input's sub-score; the figure is the points it added to the 100-point composite (weight × sub-score).
- Cash flow +12.9/30.0
- ARV discount +7.5/15.0
- Schools +5.6/10.0
- DSCR +3.9/10.0
- Livability +3.9/5.0
- 1% rule +3.7/10.0
- Rent growth +2.5/5.0
- Condition / age +2.5/5.0
- Appreciation +0.0/10.0
$252,000
🖨 Deal sheet 📄 Offer letter ✓ Due diligence
Listing remarks
Welcome to 3105 Bethany Ln in Texarkana, TX — a thoughtfully designed new construction home offering modern finishes, functional living, and timeless style. This 3-bedroom, 2.5-bath residence features an open-concept layout filled with natural light and elevated design touches throughout. Brand-new. Designed to last. Schedule your private showing today.
Key facts
- 7,405 sq ft lot
- Garage
- Built 2025
Property features AI
Exterior
- Parking: Attached garage facing front; One covered parking space (one garage space, total 1 parking space)
- Utilities: Public water; Public sewer
- Home design: Single-family residence; Two stories; New construction; Brick construction; Slab foundation
- Construction: Brick exterior; Shingle roof; Slab foundation; Built as new construction
- Exterior features: Covered patio/porch; Privacy wood fencing; Shingle roof; Concrete road frontage on a city street
Interior
- Kitchen: Dishwasher; Gas range; Microwave
- Bathrooms: Two full bathrooms; One half bathroom
- Heating & cooling: Central heating (natural gas); Central electric air conditioning
- Interior features: Breakfast bar; One fireplace
- Laundry & utility: Tankless water heater
Neighborhood map
What this means for you Summary
Snapshot
- This is a 3-bed/2.5-bath land listed at $252k.
Deal economics
- At list price, monthly cash flow is $-17 ($-199/yr) — negative.
- To cash-flow at today's rent, offer at most $250k (1.0% below list).
- To meet the 1% rule (rent ≥ 1% of price), the offer needs to be $218k (13.4% below list).
- Recommended offer: $218k (13.4% below list) — sets the bar for 1% rule.
- Cap rate 6.2% vs local median 4.3% in Texarkana — top-decile yield for the area; either an underpriced asset or a hidden risk that comps aren't pricing in. Stress-test before assuming the spread holds.
Location & tenants
- Location reads 77/100 on livability (#93 in TX, #3,241 nationally) — a middle-class / working-renter tenant base. Strengths: cost of living A+, housing A+, health & safety A+; Watch: amenities D+, schools D, crime D.
- Pleasant Grove ISD (urban): math 63% / reading 65% proficiency, ranked #30 of 826 in TX (top 4%) — acceptable for families but not a draw, mixed tenant base, ~2y average lease.
- Market conditions: 298 active listings in the ZIP; 8 comparable units currently listed for rent nearby; rentals lingering (median 44d on market — plan ~5-8 weeks vacancy on turnover, expect pricing pressure); 100% of comp listings sitting > 30 days — soft ceiling on asking rent; 137 units permitted in Bowie County in 2024 (5 in 5+ unit buildings).
- This rent runs 36% of the median local income ($72k/yr) — at the standard rent-burdened threshold; future hikes will face affordability resistance.
Forward outlook
- Local home prices are declining (-3.0%/yr); year-one equity from $2k of loan paydown is wiped out by about $8k of value loss. Plan a longer hold.
Negotiation context
- It's been on market 107 days — a 9% lower offer ($229k) is reasonable based on typical stale-listing flexibility.
Questions for the listing agent
- What do current leases actually rent for vs. the listed asking? Can we see a recent rent roll and the last 12 months of T-12 income?
- It's been on market 107 days. Have you received any prior offers? Is the seller open to a 13% concession, seller financing, or rate buy-down credit?
- Why hasn't it sold? Are there any deal-killer items the seller is aware of (foundation, flood, title, zoning, code violations)?
- Is there a deadline driving the sale (1031 exchange, divorce, estate, relocation)? That informs how much negotiation room exists.
- Schools are D-rated, which usually means shorter tenancies and higher turnover. Who's the typical renter profile here, and what's been the actual vacancy rate?
- Crime grade is D in this area — have there been break-ins, vandalism, or insurance claims at this property in the last 3 years? What carrier currently insures it and at what premium?
- The area grade is low — what's the realistic commute time and amenity access for the typical tenant pool here? Any planned neighborhood developments (good or bad) we should know about?
- What's the average days-on-market for RENTAL listings here right now (not sales)? A rising rental-DOM trend means longer vacancies and softer asking-rent achievability than the comps imply.
- What's the recent tenant-quality profile in this submarket — average credit score on applications, eviction rate, late-payment / NSF rate, and stable-employment percentage? A property-management company in the area should have these aggregated.
- How much new for-sale + rental construction is in the pipeline within 1–3 miles? Heavy new supply typically softens prices + rents 12–24 months out; constrained supply supports both.
Investment metrics
- 1% rule
- 0.87% ✗
- Cap rate
- 6.21%
- Cash-on-cash
- -0.28%
- DSCR
- 0.99
- GRM
- 9.6
CMA / ARV
No comps found within radius.
Projected returns pro-forma
-3.0% appreciation · 3.0% rent growth · sell at horizon
- IRR
- -16.8%
- Equity multiple
- 0.41×
- Total profit
- $-41,858
- Equity at exit
- $37,574
- IRR
- -8.6%
- Equity multiple
- 0.47×
- Total profit
- $-37,675
- Equity at exit
- $21,788
Cash invested: $70,560 (down + closing). Projections, not guarantees.
Landlord ↔ Tenant lean methodology
- Overall (STATE)
- 87 Strongly Landlord-Friendly
- State Texas
- 87 Strongly Landlord-Friendly · R+5
- County
- — inherits STATE
- City
- — inherits STATE
ZIP-level market 75503
- Home prices YoY
- -21.0%
- Active inventory
- 298
- Price-to-rent
- 9.6×
Monthly cashflow live
- Estimated rent
- $2,183 high interval (Pro) →
- Mortgage (P&I)
- −$1,322
- Tax est. 1.5%
- −$315 /mo · $3,780/yr
- Insurance
- −$105
- HOA
- −$0
- Vacancy / Maint / Mgmt
- −$459
- Net cashflow
- $-17
Break-even live
UW: 25.0% down · 7.5% · 30yr · 1.5% tax · 5.0% vac · 8.0% maint · 8.0% mgmt
Financing live
Cash to close
- Down payment
- $63,000
- Closing costs
- $7,560
- Reserves months
- —
- Total cash needed
- —
Loan-product check · same deal, 3 products live
Conventional
25% down · 7.5% · 30yr
- Down + closing
- —
- Monthly P&I
- —
- Monthly cashflow
- —
- DSCR
- —
- Eligible?
- —
Personal DTI + credit; lowest rate.
DSCR
20% down · 8.5% · 30yr
- Down + closing
- —
- Monthly P&I
- —
- Monthly cashflow
- —
- DSCR
- —
- Eligible?
- —
No personal income docs; deal must DSCR.
Hard money
10% down · 12.0% · 12mo
- Down + closing
- —
- Monthly P&I
- —
- Monthly cashflow
- —
- DSCR
- —
- Eligible?
- —
Short-term bridge; refi at stabilization.
Rent comps 8 comps
| Address | Beds | Baths | Sqft | Rent | $/sqft | DOM | Units | Dist |
|---|---|---|---|---|---|---|---|---|
| 3008 Brittney Ln Texarkana, TX | 3.0 | 2.0 | 1566 | $1,895 | $1.21 | 43d | 1 | 0.15mi |
| 3113 Clear Creek Dr Texarkana, TX | 2.0 | 2.0 | 1015 | $1,050 | $1.03 | 43d | 1 | 0.34mi |
| 3514 Skyline Blvd Texarkana, TX | 3.0 | 2.0 | 1635 | $4,000 | $2.45 | 43d | 1 | 0.35mi |
| 3516 Skyline Blvd Texarkana, TX | 3.0 | 2.0 | 1635 | $4,000 | $2.45 | 43d | 1 | 0.35mi |
| 6 Fernwood Dr Unit B Texarkana, TX | 3.0 | 2.5 | 1691 | $1,695 | $1.00 | 43d | 1 | 0.78mi |
| 3515 Arista Blvd Texarkana, TX | 1.0–3.0 | 1.0–2.0 | 1130 | $1,600 | $1.42 | 43d | 27 | 1.10mi |
| 3478 Brooke Pl Unit 3427 Texarkana, TX | 3.0 | 2.5 | 1440 | $1,600 | $1.11 | 43d | 1 | 1.11mi |
| 5911 Richmond Rd Texarkana, TX | 1.0–3.0 | 1.0–2.0 | 1049 | $2,000 | $1.91 | 43d | 14 | 1.36mi |
Listing history 3 events
-
2026-04-30status Pending
-
2026-04-23price $252,000
-
2026-01-13$269,000 Active
ⓘ Source: listings_history table (triggers on properties + properties_extension) + one-shot
backfill from property_details.listing_events for pre-trigger history.
Nearby sold comps map
Loading sold comps map…
Walkable amenities ~0.75 mi
Loading nearby amenities…
Taxation est. · year 1
- Rental income
- $26,202
- − Mortgage interest
- −$14,116
- − Property taxes
- −$3,780
- − Insurance
- −$1,260
- − Repairs & maintenance
- −$2,096
- − Management
- −$2,096
- − Depreciation
- −$7,331
- Taxable loss
- −$4,478
- Est. tax savings @ 24.0%
- +$1,075
- After-tax cash flow
- $876/yr
For passive investors: Depreciation is non-cash, so a rental often shows a tax loss while cash-flowing — sheltering income. Rental losses are passive: they offset passive income freely, and up to $25,000/yr can offset ordinary (W-2) income if you actively participate and your MAGI is under $100k (phasing out to $0 by $150k); unused losses carry forward. On sale, claimed depreciation is recaptured at up to 25%, and gains may owe capital-gains tax (a 1031 exchange can defer both). Figures are a year-1 estimate at your 24.0% rate — not tax advice; consult a CPA.
Schools (NCES district)
- District
- Pleasant Grove ISD
- NCES district ID
- 4835130
- Math proficiency
- 63% ▲ 3.00%
- Reading proficiency
- 65% ▲ 6.00%
- Median HH income
- $69,316
- Composite
- 56.24/100
- National rank
- #1175
- State rank
- #30 of 826 in TX
Livability — Texarkana
- Score
- 77/100
- State rank
- #93
- US rank
- #3241
Category grades
Schools grade is shown separately in the Schools card above.
Census & demographics
- Census place
- Texarkana, TX
- County
- Bowie County · 61,238 people
- City population
- 61,238
- Metro
- Texarkana, TX-AR
- Population (ZIP)
- 26,372
- Household income
- $72,159
- Rent vs Own
- Severe rent burden
- 773.0
Population outlook (Bowie County) Hauer SSP2
- Today (2025)
- 94,699 people
- By 2030
- 94,824 · +0.1%
- By 2040
- 94,870 · +0.2%
- By 2050
- 93,686 · -1.1%
- By 2075
- 90,082 · -4.9%
- By 2100
- 76,579 · -19.1%
Race, ethnicity, and origin ACS 2023
- Neighborhood character
- Majority White (63%)
- Race & ethnicity
- White 63% Black 23% Hispanic / Latino 7% Two or more races 5% Asian 3%
- Hispanic origin (detail)
- Mexican 6%
- Common ancestry
- Slovak 2% Serbian 1% Lithuanian 1%
- Foreign-born
- 5% · Canada, Vietnam, South Korea
- Languages at home
- 92% English-only · Spanish 6% Other Indo-European 1%
Political lean MEDSL · Bowie
- 2024 margin
- Solid R (+48.7) · D 25.3% · R 74.0%
- 2008→2024 swing
- -10.8pp toward R · 2008: -37.9pp · 2024: -48.7pp
- All cycles
- 2024: R+48.7 2020: R+42.8 2016: R+46.6 2012: R+41.5 2008: R+37.9
Not yet ingested
- Civics
- —
Market trends
- HPI YoY
- ▼ -48.09%
- Current HPI
- 181.3052
- Rent YoY
- —
- Metro
- Texarkana, TX-AR
- State GDP YoY
- ▲ 3.95%
- F500 in state
- 110
Industry mix (Fortune 500 HQ in TX)
| Industry | F500 HQs | Revenue |
|---|---|---|
| Energy | 16 | $1,198B |
|
||
| Technology | 5 | $198B |
|
||
| Engineering / Construction | 4 | $72B |
|
||
| Energy Services | 3 | $60B |
|
||
| Utilities | 3 | $41B |
|
||
| Healthcare | 2 | $330B |
|
||
Price history
-6.3% since first listed3 events — show timeline
- 2026-04-30 Pending — TBOR
- 2026-04-23 Price Changed $252,000 TBOR
- 2026-01-13 Listed $269,000 TBOR
Cash-flow waterfall
monthlySold comps — $/sqft
last 12 mo · ≤1 miLoading sold comps…