 Fourplex
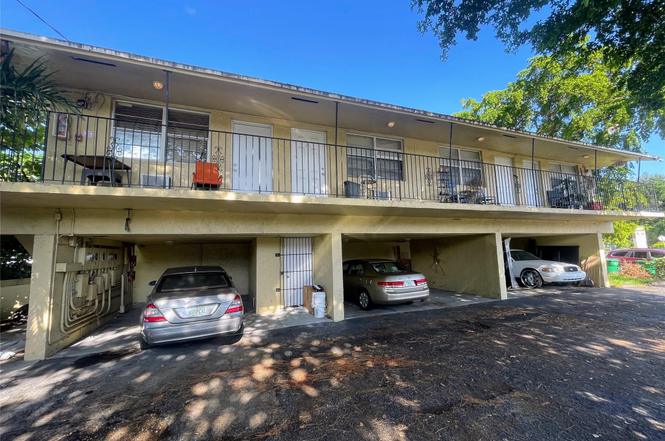
2800 W Sunrise Blvd · Washington Park, FL
Flood risk 1/10 · Minimal
- FEMA flood zone
- X (shaded)
- Chance of flooding over 30 yrs
- 0.0%
- Est. flood insurance / yr
- $507 – $1,088
Fire risk 1/10 · Minimal
- Est. fire insurance / yr
- $947 – $1,759
Heat risk 10/10 · Severe
- Hot days now (above 105°F)
- 7 days/yr
- Hot days in 30 yrs
- 26 days/yr
Wind risk 10/10 · Severe
- Chance of severe wind over 30 yrs
- 99.0%
Air-quality risk 2/10 · Minimal
- Unhealthy air days now
- 2 days/yr
- Unhealthy air days in 30 yrs
- 2 days/yr
Risk factors via First Street. Map © Google.
Why this score? — see what drove the C- grade
The composite is a weighted blend of 9 inputs, each scored 0–100. Each bar is that input's sub-score; the figure is the points it added to the 100-point composite (weight × sub-score).
- Cash flow +25.6/30.0
- DSCR +8.5/10.0
- 1% rule +6.8/10.0
- Schools +4.1/10.0
- Livability +3.9/5.0
- Rent growth +3.2/5.0
- Condition / age +2.5/5.0
- ARV discount +0.0/15.0
- Appreciation +0.0/10.0
$589,490
🖨 Deal sheet 📄 Offer letter ✓ Due diligence
Multi-family units
County records classify this as Multi-Family (2-4 Unit). Listing-text estimate: 4 units. confirmed
Listing remarks
Fully rented legal 4-unit, two-story building located on a commercial lot directly on Sunrise Blvd. All units are occupied. Two of the four units are under market rents, offering upside potential through rent increases after closing.
Key facts
- Legal 4-unit
- Two-story building
- Commercial lot
Tags
Property features AI
Finance
- Financial info: 4 total units
- HOA & community: Association covers sewer, trash, and water
Exterior
- Utilities: Public water; Public sewer; Cable not available
- Home design: Quadruplex; 2 stories; Resale condition
- Construction: Block construction; Composition and shingle roof
- Exterior features: Not waterfront
Interior
- Flooring: Laminate
- Heating & cooling: Separate meters for heating; Ceiling fans; Wall/window cooling units
- Interior features: Laminate flooring
Neighborhood map
What this means for you Summary
Snapshot
- This is a 4 × 2-bed/1.5-bath units multifamily listed at $589k.
Deal economics
- At list price, monthly cash flow is $1k ($17k/yr) — positive. Per door: $350/mo.
- The deal already cash-flows at list — no discount required.
- Meets the 1% rule at list price ($7k rent vs $589k).
- Recommended offer: $536k (9.0% below list) — sets the bar for market timing.
Location & tenants
- Location reads 78/100 on livability (#164 in FL, #2,458 nationally) — a middle-class / working-renter tenant base. Strengths: crime A+, health & safety A+, commute A-; Watch: amenities F, employment F.
- Broward (suburban): math 42% / reading 53% proficiency, ranked #46 of 73 in FL (top 63%) — families likely to look elsewhere, expect single-tenant / working-renter base with shorter leases.
- Market conditions: Rents rising (+2.8%/yr); 585 active listings in the ZIP; 40 comparable units currently listed for rent nearby; rentals at typical pace (median 22d on market — plan ~3-4 weeks tenant-placement turnaround); 2,111 units permitted in Broward County in 2024 (1,265 in 5+ unit buildings).
- At $6,928/mo this rent would consume 154% of the median local household income ($54k/yr) (locally 5068% of renters already pay >50% of income on rent) — very limited rent-growth headroom before tenants either downsize or default.
Forward outlook
- Local home prices are declining (-3.0%/yr); year-one equity from $4k of loan paydown is wiped out by about $18k of value loss. Plan a longer hold.
- Broward County population projected at +34% by 2050 — long-run rental-demand tailwind backs the buy-and-hold thesis.
Negotiation context
- It's been on market 98 days — a 9% lower offer ($536k) is reasonable based on typical stale-listing flexibility.
- 2 sale attempts with the ask held roughly flat each time — persistent listings suggest the price (not the market) is what's stuck; bring a comps-based counter.
Risks & watch-outs
- Climate carrying-cost: severe wind risk, 99% chance of damaging wind over 30y; extreme-heat days projected 7→26/yr by 2055 (HVAC capex compounding) — expect insurance premiums to compound above CPI over the hold.
Questions for the listing agent
- It's been on market 98 days. Have you received any prior offers? Is the seller open to a 9% concession, seller financing, or rate buy-down credit?
- Can we see the unit-by-unit rent roll, current vacancy, and any below-market leases? What's the average tenancy length?
- What capital expenditures (roof, boiler, parking lot, exteriors) have been made in the last 5 years, and what's planned in the next 2?
- Why hasn't it sold? Are there any deal-killer items the seller is aware of (foundation, flood, title, zoning, code violations)?
- Is there a deadline driving the sale (1031 exchange, divorce, estate, relocation)? That informs how much negotiation room exists.
- Schools are B-rated — typically a magnet for longer-tenancy family renters. What's the average tenant stay here, and is there a school-zone premium baked into asking?
- What's the average days-on-market for RENTAL listings here right now (not sales)? A rising rental-DOM trend means longer vacancies and softer asking-rent achievability than the comps imply.
- What's the recent tenant-quality profile in this submarket — average credit score on applications, eviction rate, late-payment / NSF rate, and stable-employment percentage? A property-management company in the area should have these aggregated.
- How much new apartment / multifamily construction is in the pipeline within 1–3 miles? Heavy new supply (>2% of stock underway) typically softens rents 12–24 months out; light construction supports rent growth.
Investment metrics
- 1% rule
- 1.18% ✓
- Cap rate
- 9.14%
- Cash-on-cash
- 10.17%
- DSCR
- 1.45
- GRM
- 7.1
CMA / ARV
- ARV (on-the-fly)
- $490,722
- Comps found
- 2
Show comp detail 2 sales within ~0.75 mi
| Address | Dist | Beds/Ba | Sqft | Sold | Price | $/sf | Match |
|---|---|---|---|---|---|---|---|
| 2500 Franklin Dr | 0.37mi | 4/3.0 | 1,697 (-2%) | 16mo | $480,000 | $283 | 66 |
| 2751 NW 14th Ct | 0.55mi | 6/3.0 | 1,797 (+4%) | 9mo | $485,000 | $270 | 61 |
Match score weights: distance 35% · size 25% · config 20% · recency 20%. Top-matched comps best support the ARV.
Projected returns pro-forma
-3.0% appreciation · 2.78% rent growth · sell at horizon
- IRR
- -1.3%
- Equity multiple
- 0.95×
- Total profit
- $-7,827
- Equity at exit
- $87,895
- IRR
- 8.2%
- Equity multiple
- 1.62×
- Total profit
- $102,116
- Equity at exit
- $50,968
Cash invested: $165,057 (down + closing). Projections, not guarantees.
Landlord ↔ Tenant lean methodology
- Overall (STATE)
- 87 Strongly Landlord-Friendly
- State Florida
- 87 Strongly Landlord-Friendly · R+3
- County
- — inherits STATE
- City
- — inherits STATE
ZIP-level market 33311
- Rents YoY
- 2.8%
- Active inventory
- 585
- Price-to-rent
- 28.4×
Monthly cashflow live
- Estimated rent
- $6,928 medium interval (Pro) →
- Mortgage (P&I)
- −$3,091
- Tax est. 1.5%
- −$737 /mo · $8,842/yr
- Insurance
- −$246
- HOA
- −$0
- Vacancy / Maint / Mgmt
- −$1,455
- Net cashflow
- $1,399
Break-even live
4-unit breakdown (identical units grouped — click to expand)
| Units | Beds | Baths | Est. rent |
|---|---|---|---|
| 4× units | 2 | 1.5 | $6,928 |
| #1 | 2 | 1.5 | $1,732 |
| #2 | 2 | 1.5 | $1,732 |
| #3 | 2 | 1.5 | $1,732 |
| #4 | 2 | 1.5 | $1,732 |
| Total (4 units) | $6,928 | ||
UW: 25.0% down · 7.5% · 30yr · 1.5% tax · 5.0% vac · 8.0% maint · 8.0% mgmt
Financing live
Cash to close
- Down payment
- $147,372
- Closing costs
- $17,685
- Reserves months
- —
- Total cash needed
- —
Loan-product check · same deal, 3 products live
Conventional
25% down · 7.5% · 30yr
- Down + closing
- —
- Monthly P&I
- —
- Monthly cashflow
- —
- DSCR
- —
- Eligible?
- —
Personal DTI + credit; lowest rate.
DSCR
20% down · 8.5% · 30yr
- Down + closing
- —
- Monthly P&I
- —
- Monthly cashflow
- —
- DSCR
- —
- Eligible?
- —
No personal income docs; deal must DSCR.
Hard money
10% down · 12.0% · 12mo
- Down + closing
- —
- Monthly P&I
- —
- Monthly cashflow
- —
- DSCR
- —
- Eligible?
- —
Short-term bridge; refi at stabilization.
Rent comps 40 comps
| Address | Beds | Baths | Sqft | Rent | $/sqft | DOM | Units | Dist |
|---|---|---|---|---|---|---|---|---|
| 2862 NW 11th St Fort Lauderdale, FL | 3.0 | 2.5 | 1800 | $3,300 | $1.83 | 24d | 1 | 0.15mi |
| 1123 NW 27th Ave Unit 1 Fort Lauderdale, FL | 3.0 | 1.0 | 1617 | $2,400 | $1.48 | 7d | 1 | 0.26mi |
| 1123 NW 27th Ave Unit 1 Fort Lauderdale, FL | 3.0 | 1.0 | 1617 | $2,400 | $1.48 | 24d | 1 | 0.26mi |
| 2810 NW 8th Ct Fort Lauderdale, FL | 3.0 | 2.0 | 1435 | $2,850 | $1.99 | 24d | 1 | 0.26mi |
| 1230 NW 29th Way Fort Lauderdale, FL | 3.0 | 1.0 | 1275 | $2,395 | $1.88 | 24d | 1 | 0.34mi |
| 2900 NW 8th St Fort Lauderdale, FL | 1.0 | 1.0 | 1300 | $1,300 | $1.00 | 18d | 1 | 0.36mi |
| 2804 NW 7th Ct Fort Lauderdale, FL | 3.0 | 2.0 | 1381 | $1,300 | $0.94 | 24d | 1 | 0.36mi |
| 2804 NW 7th Ct Unit 2804 Fort Lauderdale, FL | 3.0 | 2.0 | 1381 | $3,500 | $2.53 | 20d | 1 | 0.36mi |
| 1201 NW 30th Ave Unit 1-4 Fort Lauderdale, FL | 2.0 | 1.0 | 2208 | $1,850 | $0.84 | 16d | 1 | 0.37mi |
| 2451 NW 8th Pl Unit 1 Fort Lauderdale, FL | 2.0 | 1.0 | 1250 | $1,525 | $1.22 | 21d | 1 | 0.38mi |
| 2435 NW 8th Pl Unit 2 Fort Lauderdale, FL | 2.0 | 1.0 | 1250 | $1,500 | $1.20 | 21d | 1 | 0.40mi |
| 2435 NW 8th Pl Unit 2 Fort Lauderdale, FL | 2.0 | 1.0 | 1250 | $1,500 | $1.20 | 1d | 1 | 0.40mi |
| 2850 NW 7th St Fort Lauderdale, FL | 3.0 | 2.0 | 1169 | $3,000 | $2.57 | 24d | 1 | 0.41mi |
| 918 NW 24th Ave Fort Lauderdale, FL | 3.0 | 1.0 | 1332 | $2,300 | $1.73 | 24d | 1 | 0.44mi |
| 2845 NW 13th Ct Unit 1 Fort Lauderdale, FL | 2.0 | 1.0 | 1250 | $1,950 | $1.56 | 20d | 1 | 0.45mi |
| 2856 NW 14th St #1 Fort Lauderdale, FL | 3.0 | 2.0 | 1440 | $2,800 | $1.94 | 7d | 1 | 0.47mi |
| 2856 NW 14th St Unit 2 Fort Lauderdale, FL | 2.0 | 1.0 | 1440 | $2,100 | $1.46 | 7d | 1 | 0.47mi |
| 1070 NW 23rd Rd Fort Lauderdale, FL | 3.0 | 1.0 | 1160 | $2,800 | $2.41 | 24d | 1 | 0.49mi |
| 2835 NW 14th St Unit 1 Fort Lauderdale, FL | 3.0 | 2.0 | 1630 | $2,990 | $1.83 | 24d | 1 | 0.50mi |
| 2401 NW 7th St Fort Lauderdale, FL | 3.0 | 2.0 | 1300 | $3,600 | $2.77 | 24d | 1 | 0.52mi |
| 2780 NW 15th St Fort Lauderdale, FL | 3.0 | 2.5 | 1622 | $3,200 | $1.97 | 24d | 1 | 0.57mi |
| 2620 NW 14th Ct Unit 2620 Fort Lauderdale, FL | 3.0 | 2.0 | 1080 | $2,900 | $2.69 | 2d | 1 | 0.57mi |
| 1121 NW 23rd Ter Fort Lauderdale, FL | 3.0 | 2.0 | 1364 | $2,646 | $1.94 | 5d | 1 | 0.60mi |
| 2360 NW 14th St Fort Lauderdale, FL | 3.0 | 2.0 | 1489 | $3,200 | $2.15 | 24d | 1 | 0.65mi |
| 720 NW 33rd Ter Lauderhill, FL | 3.0 | 1.0 | 1340 | $2,560 | $1.91 | 21d | 1 | 0.65mi |
| 720 NW 33rd Ter Unit 1 Fort Lauderdale, FL | 1.0 | 1.0 | 1340 | $1,280 | $0.96 | 21d | 1 | 0.65mi |
| 2201 NW 6th Ct Unit 2201 Fort Lauderdale, FL | 1.0 | 1.0 | 1176 | $1,100 | $0.94 | 21d | 1 | 0.68mi |
| 2201 NW 6th Ct Unit 2201 Fort Lauderdale, FL | 1.0 | 1.0 | 1176 | $1,100 | $0.94 | 7d | 1 | 0.68mi |
| 891 NW 34th Way Lauderhill, FL | 3.0 | 2.0 | 1283 | $2,950 | $2.30 | 24d | 1 | 0.80mi |
| 1564 NW 31st Way Lauderhill, FL | 3.0 | 2.0 | 1126 | $2,400 | $2.13 | 24d | 1 | 0.81mi |
| 2530 NW 17th St Fort Lauderdale, FL | 1.0 | 1.0 | 1071 | $985 | $0.92 | 24d | 1 | 0.85mi |
| 204 NW 28th Ave Unit 1 Fort Lauderdale, FL | 2.0 | 1.0 | 1236 | $1,850 | $1.50 | 2d | 1 | 0.85mi |
| 1370 NW 34th Way #1370 Lauderhill, FL | 3.0 | 2.0 | 1360 | $2,650 | $1.95 | 20d | 1 | 0.88mi |
| 116 NW 28th Ave Unit 1-2 Fort Lauderdale, FL | 2.0 | 2.0 | 2001 | $2,000 | $1.00 | 24d | 1 | 0.90mi |
| 3429 NW 13th St Fort Lauderdale, FL | 3.0 | 2.5 | 1120 | $2,595 | $2.32 | 24d | 1 | 0.93mi |
| 3416 NW 14th Ct Fort Lauderdale, FL | 2.0 | 2.5 | 1248 | $2,090 | $1.67 | 24d | 1 | 0.94mi |
| 10 NW 28th Way Fort Lauderdale, FL | 3.0 | 1.0 | 1232 | $1,950 | $1.58 | 3d | 1 | 0.96mi |
| 3484 NW 13th St Fort Lauderdale, FL | 2.0 | 2.5 | 1120 | $2,100 | $1.88 | 24d | 1 | 0.97mi |
| 1816 NW 25th Ter Unit 1 Fort Lauderdale, FL | 2.0 | 1.0 | 1100 | $2,500 | $2.27 | 19d | 1 | 0.99mi |
| 3507 NW 13th St Unit 3507 Lauderhill, FL | 2.0 | 2.5 | 1120 | $2,450 | $2.19 | 5d | 1 | 1.02mi |
Listing history 26 events
-
2026-06-18days on market $589,490 Active 98 DOM
-
2026-06-17days on market $589,490 Active 97 DOM
-
2026-06-16days on market $589,490 Active 96 DOM
-
2026-06-15days on market $589,490 Active 95 DOM
-
2026-06-13days on market $589,490 Active 93 DOM
-
2026-06-09days on market $589,490 Active 89 DOM
-
2026-06-08days on market $589,490 Active 88 DOM
-
2026-06-07days on market $589,490 Active 87 DOM
-
2026-06-04days on market $589,490 Active 84 DOM
-
2026-06-03days on market $589,490 Active 83 DOM
-
2026-06-02days on market $589,490 Active 82 DOM
-
2026-06-01days on market $589,490 Active 81 DOM
-
2026-05-31days on market $589,490 Active 80 DOM
-
2026-05-21price $589,990
-
2026-05-14price $590,490
-
2026-05-13status Active
-
2026-05-12historical
-
2026-05-07price $590,990
-
2026-04-30price $591,990
-
2026-04-23price $592,990
-
2026-04-16price $593,990
-
2026-04-02price $595,990
-
2026-03-26price $596,990
-
2026-03-19price $597,990
-
2026-03-12price $598,990
-
2026-02-12$599,990 Active
ⓘ Source: listings_history table (triggers on properties + properties_extension) + one-shot
backfill from property_details.listing_events for pre-trigger history.
Climate risk First Street
- Flood 1/10 Low FEMA zone X (shaded) · 0% chance over 30 yrs
- Wildfire 1/10 Low
- Heat 10/10 Extreme 7 d/yr ≥105°F today · 26 d/yr by 30 yrs out
- Wind 10/10 Extreme 99% chance of damaging wind over 30 yrs
- Air quality 2/10 Low 2 unhealthy d/yr today · 2 by 30 yrs out
Nearby sold comps map
Loading sold comps map…
Walkable amenities ~0.75 mi
Loading nearby amenities…
Taxation est. · year 1
- Rental income
- $83,136
- − Mortgage interest
- −$33,021
- − Property taxes
- −$8,842
- − Insurance
- −$2,947
- − Repairs & maintenance
- −$6,651
- − Management
- −$6,651
- − Depreciation
- −$17,149
- Taxable income
- $7,875
- Est. tax owed @ 24.0%
- −$1,890
- After-tax cash flow
- $14,901/yr
For passive investors: Depreciation is non-cash, so a rental often shows a tax loss while cash-flowing — sheltering income. Rental losses are passive: they offset passive income freely, and up to $25,000/yr can offset ordinary (W-2) income if you actively participate and your MAGI is under $100k (phasing out to $0 by $150k); unused losses carry forward. On sale, claimed depreciation is recaptured at up to 25%, and gains may owe capital-gains tax (a 1031 exchange can defer both). Figures are a year-1 estimate at your 24.0% rate — not tax advice; consult a CPA.
Schools (NCES district)
- District
- Broward
- NCES district ID
- 1200180
- Math proficiency
- 42% ▼ -18.00%
- Reading proficiency
- 53% ▼ -5.00%
- Median HH income
- $52,139
- Composite
- 40.88/100
- National rank
- #3621
- State rank
- #46 of 73 in FL
Livability — Washington Park
- Score
- 78/100
- State rank
- #164
- US rank
- #2458
Category grades
Schools grade is shown separately in the Schools card above.
Census & demographics
- Census place
- Washington Park, FL
- County
- Broward County · 1,963,430 people
- Metro
- Miami-Fort Lauderdale-Pompano Beach, FL
- Population (ZIP)
- 74,898
- Household income
- $53,973
- Rent vs Own
- Severe rent burden
- 5068.0
Population outlook (Broward County) Hauer SSP2
- Today (2025)
- 2,207,033 people
- By 2030
- 2,360,704 · +7.0%
- By 2040
- 2,661,208 · +20.6%
- By 2050
- 2,946,698 · +33.5%
- By 2075
- 3,602,273 · +63.2%
- By 2100
- 3,970,984 · +79.9%
Race, ethnicity, and origin ACS 2023
- Neighborhood character
- Predominantly Black (77%)
- Race & ethnicity
- Black 77% Two or more races 9% White 9% Hispanic / Latino 9%
- Hispanic origin (detail)
- Mexican 1% Puerto Rican 2% Cuban 1%
- Common ancestry
- Hispanic 15% Lithuanian 1% Romanian 0%
- Foreign-born
- 24% · Canada, Jamaica
- Languages at home
- 78% English-only · French/Haitian/Cajun 14% Spanish 6% Other Indo-European 1%
Political lean MEDSL · Broward
- 2024 margin
- D (+17.0) · D 58.0% · R 41.0%
- 2008→2024 swing
- -17.8pp toward R · 2008: 34.7pp · 2024: 17.0pp
- All cycles
- 2024: D+17.0 2020: D+29.8 2016: D+35.0 2012: D+34.9 2008: D+34.7
Not yet ingested
- Civics
- —
Market trends
- HPI YoY
- ▼ -300.68%
- Current HPI
- 535.2504
- Rent YoY
- ▲ 2.78%
- Metro
- Miami-Fort Lauderdale-Pompano Beach, FL
- State GDP YoY
- ▲ 3.28%
- F500 in state
- 36
Industry mix (Fortune 500 HQ in FL)
| Industry | F500 HQs | Revenue |
|---|---|---|
| Industrial Technology | 2 | $29B |
|
||
| Insurance | 2 | $17B |
|
||
| Retail | 1 | $60B |
|
||
| Technology Distribution | 1 | $58B |
|
||
| Homebuilding | 1 | $35B |
|
||
| Technology Manufacturing | 1 | $35B |
|
||
Price history
-1.7% since first listed13 events — show timeline
- 2026-05-21 Price Changed $589,990 Beaches MLS
- 2026-05-14 Price Changed $590,490 Beaches MLS
- 2026-05-13 Relisted — Beaches MLS
- 2026-05-12 Listing Removed — Beaches MLS
- 2026-05-07 Price Changed $590,990 Beaches MLS
- 2026-04-30 Price Changed $591,990 Beaches MLS
- 2026-04-23 Price Changed $592,990 Beaches MLS
- 2026-04-16 Price Changed $593,990 Beaches MLS
- 2026-04-02 Price Changed $595,990 Beaches MLS
- 2026-03-26 Price Changed $596,990 Beaches MLS
- 2026-03-19 Price Changed $597,990 Beaches MLS
- 2026-03-12 Price Changed $598,990 Beaches MLS
- 2026-02-12 Listed $599,990 Beaches MLS
Cash-flow waterfall
monthlySold comps — $/sqft
last 12 mo · ≤1 miLoading sold comps…