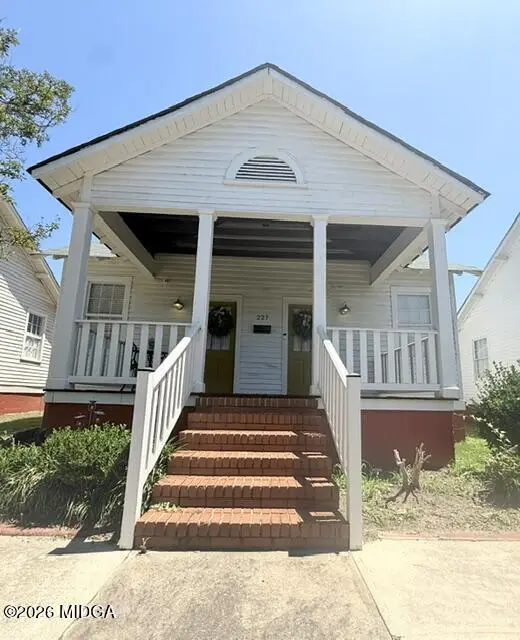
227 Schell Ave · Macon-Bibb County, GA
Flood risk 1/10 · Minimal
- FEMA flood zone
- X (unshaded)
- Chance of flooding over 30 yrs
- 0.0%
- Est. flood insurance / yr
- $507 – $1,088
Fire risk 1/10 · Minimal
- Est. fire insurance / yr
- $963 – $1,789
Heat risk 7/10 · Major
- Hot days now (above 108°F)
- 7 days/yr
- Hot days in 30 yrs
- 17 days/yr
Wind risk 6/10 · Moderate
- Chance of severe wind over 30 yrs
- 65.0%
Air-quality risk 4/10 · Minor
- Unhealthy air days now
- 5 days/yr
- Unhealthy air days in 30 yrs
- 5 days/yr
Risk factors via First Street. Map © Google.
Why this score? — see what drove the D grade
The composite is a weighted blend of 9 inputs, each scored 0–100. Each bar is that input's sub-score; the figure is the points it added to the 100-point composite (weight × sub-score).
- Cash flow +12.5/30.0
- ARV discount +7.5/15.0
- Appreciation +7.2/10.0
- Rent growth +5.0/5.0
- DSCR +3.7/10.0
- 1% rule +2.8/10.0
- Livability +2.5/5.0
- Condition / age +2.5/5.0
- Schools +1.2/10.0
$150,000
🖨 Deal sheet (PDF) 📄 Offer letter ✓ Due diligence
Listing remarks MLS
Cannot be rented. Historic Mill Village that has been thoughtfully renovated over the past several years! Literally, right at the back gate to the (soon to be) Ocmulgee National Park. Walking distance to downtown Macon and the Bicentennial Park
Key facts
- Total renovation
- 4,356 sq ft lot
- Built 1900
Tags
Property features AI
Finance
- Other: Lot approximately 0.1 acre
- HOA & community: Has homeowners association
Exterior
- Parking: Parking lot
- Security: Smoke detectors
- Utilities: Public water; Public sewer
- Home design: Single-family residence; One level; Residential property; Updated/remodeled
- Construction: Brick, frame, and wood siding construction; Pillar/post/pier foundation; Built on one level
- Exterior features: Shingle roof; Park nearby
Interior
- Kitchen: Dishwasher; Electric range; Microwave; Refrigerator
- Bedrooms: Total of 4 rooms
- Flooring: Hardwood
- Bathrooms: 1 full bathroom
- Heating & cooling: Central heating; Heat pump for heating and cooling
- Interior features: Hardwood floors; Decorative fireplace in the living room (2 fireplaces total); Updated/remodeled condition; No basement
- Laundry & utility: Dedicated laundry room
Neighborhood map
What this means for you Summary
Snapshot
- This is a 2-bed/2.0-bath single-family listed at $150k.
Deal economics
- At list price, monthly cash flow is $-23 ($-271/yr) — negative.
- To cash-flow at today's rent, offer at most $146k (2.7% below list).
- To meet the 1% rule (rent ≥ 1% of price), the offer needs to be $117k (22.0% below list).
- Recommended offer: $117k (22.0% below list) — sets the bar for 1% rule.
Location & tenants
- Location reads: area grade D — affects rentability + tenant quality, not the cash-flow math above.
- Bibb County (urban): math 11% / reading 18% proficiency, ranked #161 of 174 in GA (top 92%) — low school quality limits family demand, transient renter base, plan for 1-2y turnover; 75% free/reduced lunch — lower-income household profile, screen leases tightly.
- Zoned schools: Burdell Elementary School (math 12% / reading 17%, grade F, #996 of 1,228 statewide, top 83%, 442 students, 100% FRL); Appling Middle School (math 7% / reading 14%, grade F, #429 of 470 statewide, top 91%, 648 students, 100% FRL); Northeast High School (math 2% / reading 5%, grade F, #413 of 424 statewide, top 99%, 742 students, 100% FRL) — zoned schools average 100% FRL vs 75% district-wide (25 pts higher); higher-poverty schools than district average — tighter screening recommended.
- Market conditions: Rents rising fast (+10.8%/yr); 123 active listings in the ZIP; 40 comparable units currently listed for rent nearby; rentals lingering (median 46d on market — plan ~5-8 weeks vacancy on turnover, expect pricing pressure); 55% of comp listings sitting > 30 days — soft ceiling on asking rent; lower-income renter base — watch delinquency; 154 units permitted in Bibb County in 2024 (0 in 5+ unit buildings).
Forward outlook
- In year one you build about $8k of equity ($1k loan paydown + $6k appreciation (4.3% local appreciation)).
- Bibb County population projected at -12% by 2050 — secular population decline; favor cash flow + early exit over multi-decade hold.
- At projected returns (4.3% appreciation + 8.0% rent growth), your $42k cash investment doubles in ~5 years — after that, you're playing with house money.
- By year 5, paydown + projected appreciation supports a ~$32k cash-out refi (75% LTV) — recoverable capital for the next deal without selling this one.
Negotiation context
- Only 14 days on market — expect competitive offers; lowballing is unlikely to land.
- 3 sale attempts since 6y ago with the ask held roughly flat each time — persistent listings suggest the price (not the market) is what's stuck; bring a comps-based counter.
- Current owner paid $125k; 20% above their basis — modest negotiation headroom, anchor on the comps not their cost.
Risks & watch-outs
- Watch-outs: built in 1900 — expect roof / HVAC / electrical / plumbing capex.
- Climate carrying-cost: major wind risk, 65% chance of damaging wind over 30y; extreme-heat days projected 7→17/yr by 2055 (HVAC capex compounding) — expect insurance premiums to compound above CPI over the hold.
Questions for the listing agent
- What do current leases actually rent for vs. the listed asking? Can we see a recent rent roll and the last 12 months of T-12 income?
- Built in 1900 — when were the roof, HVAC, electrical panel, plumbing, and water heater last replaced?
- Is there a deadline driving the sale (1031 exchange, divorce, estate, relocation)? That informs how much negotiation room exists.
- The area grade is low — what's the realistic commute time and amenity access for the typical tenant pool here? Any planned neighborhood developments (good or bad) we should know about?
- What's the average days-on-market for RENTAL listings here right now (not sales)? A rising rental-DOM trend means longer vacancies and softer asking-rent achievability than the comps imply.
- What's the recent tenant-quality profile in this submarket — average credit score on applications, eviction rate, late-payment / NSF rate, and stable-employment percentage? A property-management company in the area should have these aggregated.
- How much new for-sale + rental construction is in the pipeline within 1–3 miles? Heavy new supply typically softens prices + rents 12–24 months out; constrained supply supports both.
Investment metrics
- 1% rule
- 0.78% ✗
- Cap rate
- 6.11%
- Cash-on-cash
- -0.65%
- DSCR
- 0.97
- GRM
- 10.7
CMA / ARV
- ARV (on-the-fly)
- $84,624
- Comps found
- 4
Show comp detail 4 sales within ~0.75 mi
| Address | Dist | Beds/Ba | Sqft | Sold | Price | $/sf | Match |
|---|---|---|---|---|---|---|---|
| 261 Balkcom Ave | 0.20mi | 3/1.0 (+1) | 1,006 (-2%) | 1mo | $80,300 | $80 | 77 |
| 227 Schell Ave | 0.00mi | 1/1.0 (-1) | 1,032 (0%) | 18mo | $125,000 | $121 | 76 |
| 260 Balkcom Ave | 0.18mi | 3/2.0 (+1) | 1,180 (+14%) | 10mo | $97,000 | $82 | 54 |
| 1058 Emery Hwy | 0.61mi | 3/1.0 (+1) | 884 (-14%) | 11mo | $17,000 | $19 | 29 |
Match score weights: distance 35% · size 25% · config 20% · recency 20%. Top-matched comps best support the ARV.
Projected returns pro-forma
4.31% appreciation · 8.0% rent growth · sell at horizon
- IRR
- 12.7%
- Equity multiple
- 1.80×
- Total profit
- $33,455
- Equity at exit
- $78,805
- IRR
- 15.9%
- Equity multiple
- 3.86×
- Total profit
- $120,164
- Equity at exit
- $131,137
Cash invested: $42,000 (down + closing). Projections, not guarantees.
Landlord ↔ Tenant lean methodology
- Overall (STATE)
- 90 Strongly Landlord-Friendly
- State Georgia
- 90 Strongly Landlord-Friendly · R+3
- County
- — inherits STATE
- City
- — inherits STATE
ZIP-level market 31217
- Home prices YoY
- 2.1%
- Rents YoY
- 10.8%
- Active inventory
- 123
- Price-to-rent
- 10.7×
Monthly cashflow live
- Estimated rent
- $1,171 high interval (Pro) →
- Mortgage (P&I)
- −$787
- Tax from tax record
- −$98 /mo · $1,179/yr
- Insurance
- −$62
- HOA
- −$0
- Vacancy / Maint / Mgmt
- −$246
- Net cashflow
- $-23
Break-even live
Sensitivity live
| Price | -10% $62 | -5% $20 | +0% $-23 | +5% $-65 | +10% $-108 |
|---|---|---|---|---|---|
| Rent | -10% $-115 | -5% $-69 | +0% $-23 | +5% $24 | +10% $70 |
| Rate | -1.0pp $53 | -0.5pp $16 | base $-23 | +0.5pp $-61 | +1.0pp $-101 |
UW: 25.0% down · 7.5% · 30yr · 1.5% tax · 5.0% vac · 8.0% maint · 8.0% mgmt
Financing live
Cash to close
- Down payment
- $37,500
- Closing costs
- $4,500
- Reserves months
- —
- Total cash needed
- —
Loan-product check · same deal, 3 products live
Conventional
25% down · 7.5% · 30yr
- Down + closing
- —
- Monthly P&I
- —
- Monthly cashflow
- —
- DSCR
- —
- Eligible?
- —
Personal DTI + credit; lowest rate.
DSCR
20% down · 8.5% · 30yr
- Down + closing
- —
- Monthly P&I
- —
- Monthly cashflow
- —
- DSCR
- —
- Eligible?
- —
No personal income docs; deal must DSCR.
Hard money
10% down · 12.0% · 12mo
- Down + closing
- —
- Monthly P&I
- —
- Monthly cashflow
- —
- DSCR
- —
- Eligible?
- —
Short-term bridge; refi at stabilization.
Rent comps 40 comps
| Address | Beds | Baths | Sqft | Rent | $/sqft | DOM | Units | Dist |
|---|---|---|---|---|---|---|---|---|
| 390 Cowan St Unit 394 Macon, GA | 2.0 | 1.5 | 1166 | $900 | $0.77 | 22d | 1 | 0.59mi |
| 382 Cowan St Macon, GA | 2.0 | 1.5 | 1166 | $900 | $0.77 | 45d | 1 | 0.60mi |
| 378 Cowan St Unit 382 Macon, GA | 2.0 | 1.5 | 1166 | $900 | $0.77 | 22d | 1 | 0.60mi |
| 1143 Woolfolk St Unit 3 Macon, GA | 2.0 | 1.0 | 900 | $800 | $0.89 | 45d | 1 | 0.73mi |
| 1233 Woolfolk Ter Macon, GA | 2.0 | 1.0 | 740 | $750 | $1.01 | 15d | 1 | 0.82mi |
| 610 Mulberry St Unit 7 Macon, GA | 1.0 | 1.0 | 871 | $1,475 | $1.69 | 45d | 1 | 0.86mi |
| 610 Mulberry St Unit 5 Macon, GA | 1.0 | 1.0 | 776 | $1,375 | $1.77 | 45d | 1 | 0.86mi |
| 610 Mulberry St Unit 6 Macon, GA | 1.0 | 1.0 | 778 | $1,600 | $2.06 | 45d | 1 | 0.86mi |
| 853 North Ave Macon, GA | 2.0 | 1.5 | 950 | $865 | $0.91 | 45d | 1 | 0.86mi |
| 370 Cherry St Macon, GA | 2.0 | 2.0 | 1500 | $1,400 | $0.93 | 45d | 1 | 0.87mi |
| 462 Cherry St Macon, GA | 2.0 | 1.0–2.0 | 988 | $3,000 | $3.03 | 15d | 25 | 0.89mi |
| 450 3rd St Macon, GA | 1.0 | 1.0 | 700 | $1,300 | $1.86 | 45d | 1 | 0.93mi |
| 476 3rd St Macon, GA | 2.0 | 1.0 | 942 | $1,850 | $1.96 | 15d | 8 | 0.96mi |
| 888 Walnut Street Ln Macon, GA | 1.0 | 1.0 | 765 | $925 | $1.21 | 45d | 1 | 0.98mi |
| 854 Trinity Pl Macon, GA | 2.0 | 1.0 | 1260 | $875 | $0.69 | 45d | 1 | 0.99mi |
| 466 Poplar St Unit 1 Macon, GA | 1.0 | 1.0 | 809 | $1,195 | $1.48 | 45d | 1 | 0.99mi |
| 470 Poplar St Unit 201 Macon, GA | 1.0 | 1.0 | 700 | $1,295 | $1.85 | 45d | 1 | 1.00mi |
| 470 Poplar St Unit 202 Macon, GA | 2.0 | 2.0 | 1000 | $1,425 | $1.43 | 45d | 1 | 1.00mi |
| 476 Poplar St Unit 1 Macon, GA | 1.0 | 1.0 | 794 | $1,195 | $1.51 | 45d | 1 | 1.00mi |
| 526 3rd St Unit 3 Macon, GA | 1.0 | 1.0 | 1000 | $1,295 | $1.29 | 45d | 1 | 1.00mi |
| 482 Poplar St Macon, GA | 1.0–2.0 | 1.0–2.0 | 850 | $1,425 | $1.68 | 22d | 4 | 1.00mi |
| 955 Walnut St Unit B Macon, GA | 2.0 | 1.0 | 840 | $1,075 | $1.28 | 45d | 1 | 1.00mi |
| 895 Mulberry St Unit A Macon, GA | 1.0 | 1.0 | 807 | $1,075 | $1.33 | 45d | 1 | 1.01mi |
| 720 Baker St Macon, GA | 2.0 | 1.0 | 1020 | $900 | $0.88 | 46d | 1 | 1.04mi |
| 941 Hill Park Unit 2 Macon, GA | 2.0 | 1.0 | 800 | $850 | $1.06 | 22d | 1 | 1.04mi |
| 484 1st St #300 Macon, GA | 2.0 | 1.0 | 1400 | $1,625 | $1.16 | 15d | 1 | 1.04mi |
| 1161 Boulevard Macon, GA | 2.0 | 1.5 | 1050 | $1,300 | $1.24 | 15d | 1 | 1.06mi |
| 530 2nd St Unit B Macon, GA | 1.0 | 1.0 | 760 | $1,275 | $1.68 | 15d | 1 | 1.06mi |
| 384 Spring St Unit 1 Macon, GA | 3.0 | 2.0 | 1200 | $1,250 | $1.04 | 45d | 1 | 1.08mi |
| 1069 Boulevard Macon, GA | 2.0 | 1.0 | 832 | $900 | $1.08 | 15d | 1 | 1.10mi |
| 952 Georgia Ave Macon, GA | 2.0 | 2.0 | 1115 | $1,295 | $1.16 | 45d | 1 | 1.11mi |
| 1108 Boulevard Unit 4 Macon, GA | 1.0 | 1.0 | 918 | $1,045 | $1.14 | 22d | 1 | 1.11mi |
| 952 Georgia Ave Unit 3 Macon, GA | 2.0 | 1.0 | 900 | $950 | $1.06 | 15d | 1 | 1.12mi |
| 1224 Appling Ct Apt B Macon, GA | 2.0 | 1.0 | 1000 | $925 | $0.93 | 22d | 1 | 1.13mi |
| 218 Orange St Macon, GA | 2.0 | 1.0 | 1100 | $1,300 | $1.18 | 22d | 1 | 1.18mi |
| 147 Orange St Macon, GA | 3.0 | 2.0 | 1500 | $1,695 | $1.13 | 15d | 1 | 1.19mi |
| 991 Magnolia St Unit 3 Macon, GA | 1.0 | 1.0 | 800 | $750 | $0.94 | 45d | 1 | 1.23mi |
| 813 Forsyth St Unit C Macon, GA | 2.0 | 2.0 | 1105 | $1,400 | $1.27 | 15d | 1 | 1.26mi |
| 1094 Georgia Ave Unit C Macon, GA | 1.0 | 1.0 | 1125 | $1,350 | $1.20 | 15d | 1 | 1.27mi |
| 841 Forsyth St Macon, GA | 1.0 | 1.0 | 780 | $1,400 | $1.79 | 45d | 1 | 1.29mi |
Listing history 12 events
-
2026-06-21days on market $150,000 Active 14 DOM
-
2026-06-19days on market $150,000 Active 12 DOM
-
2026-06-18days on market $150,000 Active 11 DOM
-
2026-06-17days on market $150,000 Active 10 DOM
-
2026-06-16days on market $150,000 Active 9 DOM
-
2026-06-15days on market $150,000 Active 8 DOM
-
2026-06-14days on market $150,000 Active 6 DOM
-
2026-06-13days on market $150,000 Active 5 DOM
-
2026-06-10days on market $150,000 Active 3 DOM
-
2026-06-09days on market $150,000 Active 2 DOM
-
2026-06-07remarks 288-char remark
-
2026-06-07$150,000 Active 1 DOM
ⓘ Source: listings_history table (triggers on properties + properties_extension) + one-shot
backfill from property_details.listing_events for pre-trigger history.
Tax reassessment forecast GA · Resets to sale price
- Current annual tax
- $1,179 · $98/mo
- Projected year-2 tax
- $1,380 · $115/mo
- Expected delta
- +$201/yr (+$17/mo · 17.1%)
ⓘ Screening estimate from a state-policy table — verify with the county assessor before closing.
Climate risk First Street
- Flood 1/10 Low FEMA zone X (unshaded) · 0% chance over 30 yrs
- Wildfire 1/10 Low
- Heat 7/10 Severe 7 d/yr ≥108°F today · 17 d/yr by 30 yrs out
- Wind 6/10 Major 65% chance of damaging wind over 30 yrs
- Air quality 4/10 Moderate 5 unhealthy d/yr today · 5 by 30 yrs out
Nearby sold comps map
Loading sold comps map…
Walkable amenities ~0.75 mi
Loading nearby amenities…
Taxation est. · year 1
- Rental income
- $14,047
- − Mortgage interest
- −$8,402
- − Property taxes
- −$1,179
- − Insurance
- −$750
- − Repairs & maintenance
- −$1,124
- − Management
- −$1,124
- − Depreciation
- −$4,364
- Taxable loss
- −$2,896
- Est. tax savings @ 24.0%
- +$695
- After-tax cash flow
- $424/yr
For passive investors: Depreciation is non-cash, so a rental often shows a tax loss while cash-flowing — sheltering income. Rental losses are passive: they offset passive income freely, and up to $25,000/yr can offset ordinary (W-2) income if you actively participate and your MAGI is under $100k (phasing out to $0 by $150k); unused losses carry forward. On sale, claimed depreciation is recaptured at up to 25%, and gains may owe capital-gains tax (a 1031 exchange can defer both). Figures are a year-1 estimate at your 24.0% rate — not tax advice; consult a CPA.
Schools (NCES district)
- District
- Bibb County
- NCES district ID
- 1300420
- Math proficiency
- 11% ▼ -14.00%
- Reading proficiency
- 18% ▼ -11.00%
- Median HH income
- $37,426
- Composite
- 12.13/100
- National rank
- #9654
- State rank
- #161 of 174 in GA
Livability — Macon-Bibb County
No livability data for this city. (Only ~50 U.S. cities are tracked.)
Census & demographics
- Census place
- Macon-Bibb County, GA
- County
- Bibb County · 164,332 people
- City population
- 143,186
- Metro
- Macon-Bibb County, GA
- Population (ZIP)
- 17,732
- Household income
- $44,809
- Rent vs Own
- Severe rent burden
- 391.0
Population outlook (Bibb County) Hauer SSP2
- Today (2025)
- 148,772 people
- By 2030
- 145,904 · -1.9%
- By 2040
- 139,404 · -6.3%
- By 2050
- 131,603 · -11.5%
- By 2075
- 111,050 · -25.4%
- By 2100
- 83,346 · -44.0%
Race, ethnicity, and origin ACS 2023
- Neighborhood character
- Majority Black (57%)
- Race & ethnicity
- Black 57% White 38% Two or more races 4% Hispanic / Latino 2%
- Common ancestry
- Slovak 1% Italian 1%
- Foreign-born
- 1% · Canada
- Languages at home
- 98% English-only · Spanish 1%
Political lean MEDSL · Bibb
- 2024 margin
- Strong D (+22.4) · D 61.0% · R 38.5%
- 2008→2024 swing
- +4.4pp toward D · 2008: 18.0pp · 2024: 22.4pp
- All cycles
- 2024: D+22.4 2020: D+23.8 2016: D+20.2 2012: D+20.0 2008: D+18.0
Not yet ingested
- Civics
- —
Market trends
- HPI YoY
- ▲ 4.31%
- Current HPI
- 209.9166
- Rent YoY
- ▲ 10.85%
- Metro
- Macon-Bibb County, GA
- State GDP YoY
- ▲ 2.66%
- F500 in state
- 28
Industry mix (Fortune 500 HQ in GA)
| Industry | F500 HQs | Revenue |
|---|---|---|
| Paper / Packaging | 2 | $29B |
|
||
| Retail | 1 | $160B |
|
||
| Transportation / Logistics | 1 | $91B |
|
||
| Airlines | 1 | $62B |
|
||
| Consumer Goods | 1 | $47B |
|
||
| Utilities | 1 | $25B |
|
||
Price history
+200.0% since first listed11 events — show timeline
- 2026-06-07 Listed $150,000 MGMLS
- 2025-01-02 Sold (Public Records) $125,000 Public Records
- 2024-12-31 Sold (MLS) $125,000 MGMLS
- 2024-09-24 Contingent — MGMLS
- 2024-08-21 Listed $129,900 MGMLS
- 2023-12-06 Sold (Public Records) $76,800 Public Records
- 2021-07-02 Sold (Public Records) $90,000 Public Records
- 2021-06-25 Sold (MLS) $90,000 MGMLS
- 2020-10-09 Listed $94,900 MGMLS
- 2003-06-30 Sold (Public Records) $55,000 Public Records
- 2001-08-01 Sold (Public Records) $50,000 Public Records
Property tax history
+24.8%/yrLatest (2025): $1,179 · +56.3% YoY. Source: county tax records.
Cash-flow waterfall
monthlySold comps — $/sqft
last 12 mo · ≤1 miLoading sold comps…