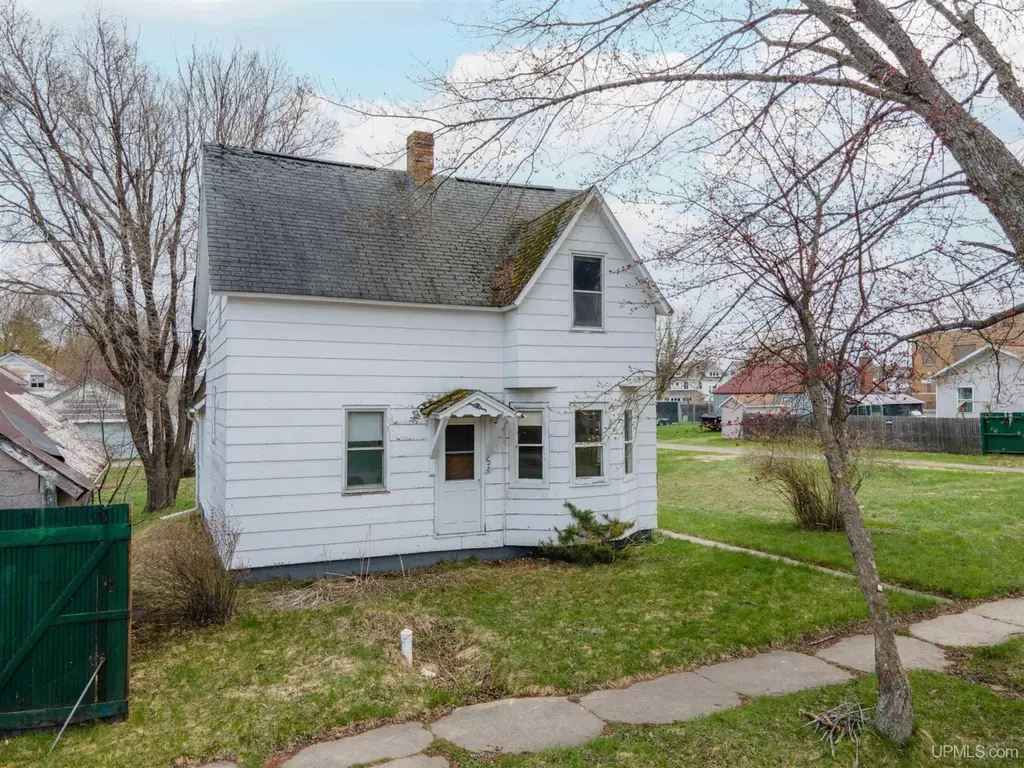
628 N 7th Ave · Iron River, MI
Flood risk No data
- FEMA flood zone
- —
- Chance of flooding over 30 yrs
- —
- Est. flood insurance / yr
- —
Fire risk No data
- Est. fire insurance / yr
- —
Heat risk No data
- Hot days now (above threshold)
- —
- Hot days in 30 yrs
- —
Wind risk No data
- Chance of severe wind over 30 yrs
- —
Air-quality risk No data
- Unhealthy air days now
- —
- Unhealthy air days in 30 yrs
- —
Risk factors via First Street. Map © Google.
Why this score? — see what drove the B- grade
The composite is a weighted blend of 9 inputs, each scored 0–100. Each bar is that input's sub-score; the figure is the points it added to the 100-point composite (weight × sub-score).
- Cash flow +30.0/30.0
- 1% rule +10.0/10.0
- DSCR +10.0/10.0
- ARV discount +7.5/15.0
- Livability +3.7/5.0
- Schools +3.5/10.0
- Rent growth +2.5/5.0
- Condition / age +2.5/5.0
- Appreciation +0.0/10.0
$32,000
🖨 Deal sheet 📄 Offer letter ✓ Due diligence
Listing remarks MLS
This 3 bedroom, 1 bath home offers a great opportunity for investors, renovators, or buyers looking to build equity! Situated on an expansive four lot parcel, the property provides ample space for outdoor living, future expansion, or additional development potential. It features a traditional layout with generous room sizes and plenty of natural light. While it does require repairs and updates, it presents a solid foundation to restore and customize to your vision. Located within walking distance to town, you'll enjoy convenient access to local shops, dining, and community amenities while still benefiting from the privacy and space of a larger lot.
Key facts
- Future expansion
- Community amenities
- Natural light
Tags
Property features AI
Exterior
- Parking: Detached 1-car garage; Additional second garage/outbuilding
- Utilities: Electricity connected; Public water; Public sanitary sewer; Natural gas for heat and water heater
- Home design: Residential 2-story home; Built in 1945; Municipality: Iron River (city)
- Construction: Wood construction; Poured foundation; Basement
- Exterior features: Wood exterior; Road frontage; Second (detached) garage / outbuilding
Interior
- Kitchen: Range/Oven; Refrigerator; Kitchen on first floor (13 x 11); Dining room on first floor (10 x 11)
- Bedrooms: First-floor bedroom (7 x 10); Second-floor bedroom (8 x 11); Second-floor bedroom (approx. 12 wide)
- Flooring: Hardwood floors
- Bathrooms: Primary bathroom present; One full bathroom (7 x 7 on second floor)
- Heating & cooling: Baseboard heating; No central air/cooling; Gas water heater; Natural gas fuel
- Interior features: Hardwood floors; Basement (poured)
- Laundry & utility: Basement present (poured)
Neighborhood map
What this means for you Summary
Snapshot
- This is a 3-bed/1.0-bath single-family listed at $32k.
Deal economics
- At list price, monthly cash flow is $627 ($8k/yr) — positive.
- The deal already cash-flows at list — no discount required.
- Meets the 1% rule at list price ($1k rent vs $32k).
- Cap rate 29.8% vs local median 5.6% in Iron River — top-decile yield for the area; either an underpriced asset or a hidden risk that comps aren't pricing in. Stress-test before assuming the spread holds.
Location & tenants
- Location reads 73/100 on livability (#206 in MI) — a middle-class / working-renter tenant base. Strengths: cost of living A+, housing A+, health & safety A+; Watch: schools D, amenities F, commute F.
- West Iron County Public Schools (town): math 38% / reading 46% proficiency, ranked #204 of 540 in MI (top 38%) — families likely to look elsewhere, expect single-tenant / working-renter base with shorter leases.
- Market conditions: 131 active listings in the ZIP; 156 units permitted in Iron County in 2024 (0 in 5+ unit buildings).
Forward outlook
- Local home prices are declining (-3.0%/yr); year-one equity from $221 of loan paydown is wiped out by about $960 of value loss. Plan a longer hold.
- Iron County population projected at -26% by 2050 — secular population decline; favor cash flow + early exit over multi-decade hold.
- At projected returns (-3.0% appreciation + 3.0% rent growth), your $9k cash investment doubles in ~2 years — after that, you're playing with house money.
Negotiation context
- Only 5 days on market — expect competitive offers; lowballing is unlikely to land.
- 2 sale attempts with the ask held roughly flat each time — persistent listings suggest the price (not the market) is what's stuck; bring a comps-based counter.
Risks & watch-outs
- Watch-outs: built in 1945 — expect roof / HVAC / electrical / plumbing capex.
Questions for the listing agent
- Built in 1945 — when were the roof, HVAC, electrical panel, plumbing, and water heater last replaced?
- Is there a deadline driving the sale (1031 exchange, divorce, estate, relocation)? That informs how much negotiation room exists.
- Schools are D-rated, which usually means shorter tenancies and higher turnover. Who's the typical renter profile here, and what's been the actual vacancy rate?
- What's the average days-on-market for RENTAL listings here right now (not sales)? A rising rental-DOM trend means longer vacancies and softer asking-rent achievability than the comps imply.
- What's the recent tenant-quality profile in this submarket — average credit score on applications, eviction rate, late-payment / NSF rate, and stable-employment percentage? A property-management company in the area should have these aggregated.
- How much new for-sale + rental construction is in the pipeline within 1–3 miles? Heavy new supply typically softens prices + rents 12–24 months out; constrained supply supports both.
Investment metrics
- 1% rule
- 3.35% ✓
- Cap rate
- 29.80%
- Cash-on-cash
- 83.96%
- DSCR
- 4.74
- GRM
- 2.5
CMA / ARV
- ARV (on-the-fly)
- $127,948
- Comps found
- 12
Show comp detail 12 sales within ~0.75 mi
| Address | Dist | Beds/Ba | Sqft | Sold | Price | $/sf | Match |
|---|---|---|---|---|---|---|---|
| 628 N 7th Ave | 0.00mi | 3/1.0 | 1,103 (0%) | 1mo | $34,000 | $31 | 99 |
| 201 N 9th Ave | 0.33mi | 2/2.0 (-1) | 1,150 (+4%) | 3mo | $10,000 | $9 | 66 |
| 729 W Maple St | 0.25mi | 3/2.0 | 1,248 (+13%) | 2mo | $163,500 | $131 | 60 |
| 1113 N River Ave | 0.48mi | 4/1.5 (+1) | 1,152 (+4%) | 5mo | $60,000 | $52 | 59 |
| 1535 W Franklin St | 0.62mi | 3/1.0 | 1,040 (-6%) | 6mo | $135,000 | $130 | 56 |
| 1309 N 1st Ave | 0.54mi | 4/1.0 (+1) | 1,075 (-2%) | 13mo | $125,000 | $116 | 55 |
| 216 N 9th Ave | 0.30mi | 3/1.0 | 1,228 (+11%) | 18mo | $89,900 | $73 | 52 |
| 1211 N Second Ave | 0.45mi | 4/1.5 (+1) | 1,170 (+6%) | 13mo | $45,000 | $38 | 51 |
| 1406 N 2nd Ave | 0.57mi | 4/1.0 (+1) | 1,037 (-6%) | 10mo | $159,750 | $154 | 50 |
| 1511 W Franklin St | 0.60mi | 3/1.0 | 952 (-14%) | 14mo | $135,000 | $142 | 38 |
| 306 Selden Rd | 0.62mi | 2/1.0 (-1) | 1,176 (+7%) | 21mo | $29,000 | $25 | 37 |
| 904 Sunrise Ave | 0.54mi | 4/2.0 (+1) | 960 (-13%) | 18mo | $145,000 | $151 | 29 |
Match score weights: distance 35% · size 25% · config 20% · recency 20%. Top-matched comps best support the ARV.
Projected returns pro-forma
-3.0% appreciation · 3.0% rent growth · sell at horizon
- IRR
- 84.3%
- Equity multiple
- 4.88×
- Total profit
- $34,759
- Equity at exit
- $4,771
- IRR
- 87.6%
- Equity multiple
- 10.12×
- Total profit
- $81,747
- Equity at exit
- $2,767
Cash invested: $8,960 (down + closing). Projections, not guarantees.
Landlord ↔ Tenant lean methodology
- Overall (STATE)
- 62 Landlord-Friendly
- State Michigan
- 62 Landlord-Friendly · EVEN
- County
- — inherits STATE
- City
- — inherits STATE
ZIP-level market 49935
- Home prices YoY
- -28.7%
- Active inventory
- 131
- Price-to-rent
- 2.5×
Monthly cashflow live
- Estimated rent
- $1,073 medium interval (Pro) →
- Mortgage (P&I)
- −$168
- Tax est. 1.5%
- −$40 /mo · $480/yr
- Insurance
- −$13
- HOA
- −$0
- Vacancy / Maint / Mgmt
- −$225
- Net cashflow
- $627
Break-even live
UW: 25.0% down · 7.5% · 30yr · 1.5% tax · 5.0% vac · 8.0% maint · 8.0% mgmt
Financing live
Cash to close
- Down payment
- $8,000
- Closing costs
- $960
- Reserves months
- —
- Total cash needed
- —
Loan-product check · same deal, 3 products live
Conventional
25% down · 7.5% · 30yr
- Down + closing
- —
- Monthly P&I
- —
- Monthly cashflow
- —
- DSCR
- —
- Eligible?
- —
Personal DTI + credit; lowest rate.
DSCR
20% down · 8.5% · 30yr
- Down + closing
- —
- Monthly P&I
- —
- Monthly cashflow
- —
- DSCR
- —
- Eligible?
- —
No personal income docs; deal must DSCR.
Hard money
10% down · 12.0% · 12mo
- Down + closing
- —
- Monthly P&I
- —
- Monthly cashflow
- —
- DSCR
- —
- Eligible?
- —
Short-term bridge; refi at stabilization.
Listing history 4 events
-
2026-05-13status Pending 656-char remark
Show marketing remark (656 chars)
This 3 bedroom, 1 bath home offers a great opportunity for investors, renovators, or buyers looking to build equity! Situated on an expansive four lot parcel, the property provides ample space for outdoor living, future expansion, or additional development potential. It features a traditional layout with generous room sizes and plenty of natural light. While it does require repairs and updates, it presents a solid foundation to restore and customize to your vision. Located within walking distance to town, you'll enjoy convenient access to local shops, dining, and community amenities while still benefiting from the privacy and space of a larger lot.
-
2026-05-08$32,000 Active 656-char remark
Show marketing remark (656 chars)
This 3 bedroom, 1 bath home offers a great opportunity for investors, renovators, or buyers looking to build equity! Situated on an expansive four lot parcel, the property provides ample space for outdoor living, future expansion, or additional development potential. It features a traditional layout with generous room sizes and plenty of natural light. While it does require repairs and updates, it presents a solid foundation to restore and customize to your vision. Located within walking distance to town, you'll enjoy convenient access to local shops, dining, and community amenities while still benefiting from the privacy and space of a larger lot.
ⓘ Source: listings_history table (triggers on properties + properties_extension) + one-shot
backfill from property_details.listing_events for pre-trigger history.
Nearby sold comps map
Loading sold comps map…
Walkable amenities ~0.75 mi
Loading nearby amenities…
Taxation est. · year 1
- Rental income
- $12,882
- − Mortgage interest
- −$1,792
- − Property taxes
- −$480
- − Insurance
- −$160
- − Repairs & maintenance
- −$1,031
- − Management
- −$1,031
- − Depreciation
- −$931
- Taxable income
- $7,457
- Est. tax owed @ 24.0%
- −$1,790
- After-tax cash flow
- $5,733/yr
For passive investors: Depreciation is non-cash, so a rental often shows a tax loss while cash-flowing — sheltering income. Rental losses are passive: they offset passive income freely, and up to $25,000/yr can offset ordinary (W-2) income if you actively participate and your MAGI is under $100k (phasing out to $0 by $150k); unused losses carry forward. On sale, claimed depreciation is recaptured at up to 25%, and gains may owe capital-gains tax (a 1031 exchange can defer both). Figures are a year-1 estimate at your 24.0% rate — not tax advice; consult a CPA.
Schools (NCES district)
- District
- West Iron County Public Schools
- NCES district ID
- 2632910
- Math proficiency
- 38% ▲ 2.00%
- Reading proficiency
- 46% ▲ 1.00%
- Median HH income
- $33,390
- Composite
- 34.54/100
- National rank
- #5175
- State rank
- #204 of 540 in MI
Livability — Iron River
- Score
- 73/100
- State rank
- #206
- US rank
- #5207
Category grades
Schools grade is shown separately in the Schools card above.
Census & demographics
- Census place
- Iron River, MI
- Population (ZIP)
- 5,969
Population outlook (Iron County) Hauer SSP2
- Today (2025)
- 10,485 people
- By 2030
- 9,914 · -5.4%
- By 2040
- 8,698 · -17.0%
- By 2050
- 7,742 · -26.2%
- By 2075
- 6,485 · -38.1%
- By 2100
- 5,396 · -48.5%
Race, ethnicity, and origin ACS 2023
- Neighborhood character
- Predominantly White (94%)
- Race & ethnicity
- White 94% Hispanic / Latino 2% Two or more races 2% Native American 1%
- Common ancestry
- Romanian 10% Lithuanian 6% Portuguese 5%
- Foreign-born
- 1% · Canada, Jamaica, China
- Languages at home
- 98% English-only · Spanish 1%
Political lean MEDSL · Iron
- 2024 margin
- Strong R (+29.3) · D 34.7% · R 64.0% · Other 1.2%
- 2008→2024 swing
- -31.5pp toward R · 2008: 2.1pp · 2024: -29.3pp
- All cycles
- 2024: R+29.3 2020: R+25.4 2016: R+28.3 2012: R+9.0 2008: D+2.1
Not yet ingested
- Civics
- —
Market trends
- HPI YoY
- ▼ -90.38%
- Current HPI
- 224.8101
- Rent YoY
- —
- Metro
- —
- State GDP YoY
- ▲ 1.37%
- F500 in state
- 28
Industry mix (Fortune 500 HQ in MI)
| Industry | F500 HQs | Revenue |
|---|---|---|
| Automotive Parts | 3 | $48B |
|
||
| Automotive | 2 | $372B |
|
||
| Chemicals | 1 | $45B |
|
||
| Automotive Retail | 1 | $29B |
|
||
| Healthcare / Medical Devices | 1 | $23B |
|
||
| Automotive Technology | 1 | $20B |
|
||
Price history
+0.0% since first listed4 events — show timeline
- 2026-05-13 Pending — UPAR
- 2026-05-13 Pending — MiRealSource-MiMLS
- 2026-05-08 Listed $32,000 MiRealSource-MiMLS
- 2026-05-08 Listed $32,000 UPAR
Property tax history
+11.1%/yrLatest (2025): $2,539 · +165.3% YoY. Source: county tax records.
Cash-flow waterfall
monthlySold comps — $/sqft
last 12 mo · ≤1 miLoading sold comps…