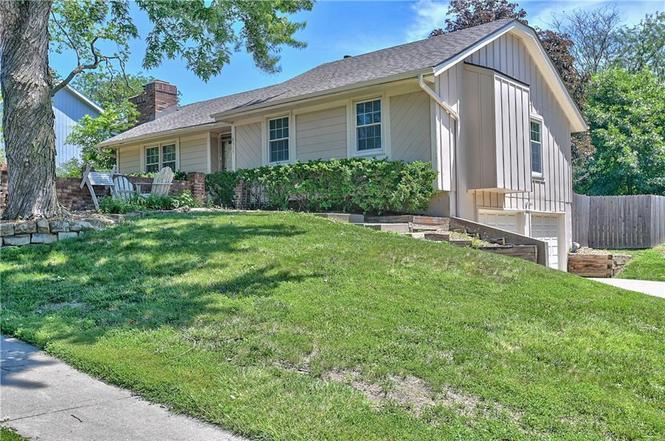
8515 NW Pomona Ave · Kansas City, MO
Flood risk 1/10 · Minimal
- FEMA flood zone
- X (unshaded)
- Chance of flooding over 30 yrs
- 0.0%
- Est. flood insurance / yr
- $473 – $860
Fire risk 1/10 · Minimal
- Est. fire insurance / yr
- $1,054 – $1,958
Heat risk 4/10 · Minor
- Hot days now (above 107°F)
- 7 days/yr
- Hot days in 30 yrs
- 17 days/yr
Wind risk 2/10 · Minimal
- Chance of severe wind over 30 yrs
- —
Air-quality risk 2/10 · Minimal
- Unhealthy air days now
- 2 days/yr
- Unhealthy air days in 30 yrs
- 2 days/yr
Risk factors via First Street. Map © Google.
Why this score? — see what drove the D+ grade
The composite is a weighted blend of 9 inputs, each scored 0–100. Each bar is that input's sub-score; the figure is the points it added to the 100-point composite (weight × sub-score).
- ARV discount +12.8/15.0
- Appreciation +10.0/10.0
- Cash flow +7.3/30.0
- Schools +4.5/10.0
- Rent growth +4.3/5.0
- Livability +3.9/5.0
- Condition / age +2.5/5.0
- 1% rule +1.8/10.0
- DSCR +1.5/10.0
$325,000
🖨 Deal sheet (PDF) 📄 Offer letter ✓ Due diligence
Listing remarks MLS
Approx 1700 Sq Ft * This Home Is Very Open & Spacious-A Must See * Vaulted Ceil- Ings, 3 Fireplaces, Walk-In Closets, New Carpet, 3 Full Baths, 2 Patio Doors, Family Room Wired For Surround Sound * Courtyard In Front Of Home * All Neutral Colors * Owner Still Painting.
Key facts
- Three fireplaces
- Finished basement
- Raised ranch
Tags
Property features AI
Finance
- HOA & community: Community play area
Exterior
- Parking: 2-car garage with garage door opener and garage facing side; Basement access (parking features noted)
- Security: Smoke detectors
- Utilities: Public water; Public sewer
- Home design: Single-family residential; Raised ranch floor plan; Wood siding; Composition roof
- Construction: Wood siding construction
- Exterior features: Patio; Metal and privacy fencing; Corner, level lot
Interior
- Kitchen: Dishwasher; Disposal; Exhaust fan; Electric range
- Bedrooms: 3 bedrooms (all on the first level)
- Flooring: Carpet
- Bathrooms: 3 full bathrooms (two on the first level, one in the basement)
- Heating & cooling: Natural gas heating; Electric cooling (central AC)
- Interior features: Ceiling fans; Vaulted ceilings; Window coverings; Skylights; Finished basement with walk-out access; Fireplace screen
- Laundry & utility: Laundry located in the basement
Neighborhood map
What this means for you Summary
Snapshot
- This is a 3-bed/2.5-bath single-family listed at $325k.
Deal economics
- At list price, monthly cash flow is $-433 ($-5k/yr) — negative.
- To cash-flow at today's rent, offer at most $248k (23.6% below list).
- To meet the 1% rule (rent ≥ 1% of price), the offer needs to be $220k (32.2% below list).
- Recommended offer: $220k (32.2% below list) — sets the bar for 1% rule.
- Cap rate 4.7% vs local median 3.9% in Kansas City — meaningfully above typical; check what's discounted (condition, days-on-market, listing class) to confirm the premium yield is real.
Location & tenants
- Location reads 78/100 on livability (#28 in MO, #2,671 nationally) — a middle-class / working-renter tenant base. Strengths: amenities A+, commute A+, cost of living A+; Watch: crime F.
- Park Hill (urban): math 47% / reading 54% proficiency, ranked #26 of 324 in MO (top 8%) — acceptable for families but not a draw, mixed tenant base, ~2y average lease.
- Zoned schools: Alfred L. Renner Elem. (math 31% / reading 43%, grade F, #611 of 1,115 statewide, top 59%, 427 students, 36% FRL); Plaza Middle (math 37% / reading 51%, grade D, #121 of 391 statewide, top 32%, 715 students, 30% FRL); Park Hill High (math 70% / reading 71%, grade B+, #9 of 521 statewide, top 2%, 1,857 students, 25% FRL).
- Market conditions: Rents rising fast (+7.0%/yr); 268 active listings in the ZIP; 8 comparable units currently listed for rent nearby; rentals at typical pace (median 19d on market — plan ~3-4 weeks tenant-placement turnaround); high-income renter base; 234 units permitted in Platte County in 2024 (0 in 5+ unit buildings).
Forward outlook
- In year one you build about $35k of equity ($2k loan paydown + $32k appreciation (10.0% local appreciation)).
- Platte County population projected at +31% by 2050 — long-run rental-demand tailwind backs the buy-and-hold thesis.
- By year 2, paydown + projected appreciation supports a ~$56k cash-out refi (75% LTV) — recoverable capital for the next deal without selling this one.
Negotiation context
- Only 4 days on market — expect competitive offers; lowballing is unlikely to land.
Questions for the listing agent
- What do current leases actually rent for vs. the listed asking? Can we see a recent rent roll and the last 12 months of T-12 income?
- Built in 1979 — when were the roof, HVAC, electrical panel, plumbing, and water heater last replaced?
- Is there a deadline driving the sale (1031 exchange, divorce, estate, relocation)? That informs how much negotiation room exists.
- Crime grade is F in this area — have there been break-ins, vandalism, or insurance claims at this property in the last 3 years? What carrier currently insures it and at what premium?
- The area grade is low — what's the realistic commute time and amenity access for the typical tenant pool here? Any planned neighborhood developments (good or bad) we should know about?
- What's the average days-on-market for RENTAL listings here right now (not sales)? A rising rental-DOM trend means longer vacancies and softer asking-rent achievability than the comps imply.
- What's the recent tenant-quality profile in this submarket — average credit score on applications, eviction rate, late-payment / NSF rate, and stable-employment percentage? A property-management company in the area should have these aggregated.
- How much new for-sale + rental construction is in the pipeline within 1–3 miles? Heavy new supply typically softens prices + rents 12–24 months out; constrained supply supports both.
Investment metrics
- 1% rule
- 0.68% ✗
- Cap rate
- 4.69%
- Cash-on-cash
- -5.72%
- DSCR
- 0.75
- GRM
- 12.3
CMA / ARV
- ARV (on-the-fly)
- $368,490
- Comps found
- 12
Show comp detail 12 sales within ~0.75 mi
| Address | Dist | Beds/Ba | Sqft | Sold | Price | $/sf | Match |
|---|---|---|---|---|---|---|---|
| 8524 N Rhode Ave | 0.05mi | 3/2.5 | 1,905 (-11%) | 10mo | $305,000 | $160 | 71 |
| 7905 NW 85th Ter | 0.06mi | 4/3.0 (+1) | 2,258 (+6%) | 12mo | $280,000 | $124 | 70 |
| 8113 N Serene Ave | 0.55mi | 3/2.5 | 2,088 (-2%) | 2mo | $356,900 | $171 | 69 |
| 7816 NW 86th Ter | 0.14mi | 4/3.0 (+1) | 1,914 (-10%) | 2mo | $332,000 | $173 | 68 |
| 8606 N Utica Ct | 0.50mi | 4/3.0 (+1) | 2,164 (+2%) | 1mo | $469,900 | $217 | 66 |
| 8316 NW 89th Ter | 0.54mi | 4/3.0 (+1) | 2,126 (-0%) | 4mo | $537,386 | $253 | 64 |
| 8312 NW 89th Ter | 0.54mi | 4/3.0 (+1) | 2,126 (-0%) | 6mo | $515,200 | $242 | 62 |
| 8700 NW Shannon Ave | 0.22mi | 3/2.5 | 1,915 (-10%) | 13mo | $295,000 | $154 | 62 |
| 8400 NW 90th St | 0.60mi | 4/3.0 (+1) | 2,126 (-0%) | 8mo | $517,785 | $244 | 58 |
| 8138 NW 89th St | 0.53mi | 3/2.0 | 1,880 (-12%) | 6mo | $480,000 | $255 | 48 |
| 8020 N Everton Ave | 0.72mi | 3/2.5 | 1,909 (-10%) | 1mo | $300,000 | $157 | 48 |
| 7419 NW 80th Ter | 0.71mi | 3/3.0 | 1,922 (-10%) | 12mo | $330,000 | $172 | 39 |
Match score weights: distance 35% · size 25% · config 20% · recency 20%. Top-matched comps best support the ARV.
Projected returns pro-forma
10.0% appreciation · 7.03% rent growth · sell at horizon
- IRR
- 21.3%
- Equity multiple
- 2.74×
- Total profit
- $158,688
- Equity at exit
- $292,786
- IRR
- 20.2%
- Equity multiple
- 6.62×
- Total profit
- $511,176
- Equity at exit
- $631,404
Cash invested: $91,000 (down + closing). Projections, not guarantees.
Landlord ↔ Tenant lean methodology
- Overall (STATE)
- 81 Strongly Landlord-Friendly
- State Missouri
- 81 Strongly Landlord-Friendly · R+10
- County
- — inherits STATE
- City
- — inherits STATE
ZIP-level market 64152
- Home prices YoY
- 4.7%
- Rents YoY
- 7.0%
- Active inventory
- 268
- Price-to-rent
- 12.3×
Monthly cashflow live
- Estimated rent
- $2,204 high interval (Pro) →
- Mortgage (P&I)
- −$1,704
- Tax from tax record
- −$335 /mo · $4,016/yr
- Insurance
- −$135
- HOA
- −$0
- Vacancy / Maint / Mgmt
- −$463
- Net cashflow
- $-433
Break-even live
Sensitivity live
| Price | -10% $-249 | -5% $-341 | +0% $-433 | +5% $-525 | +10% $-617 |
|---|---|---|---|---|---|
| Rent | -10% $-607 | -5% $-520 | +0% $-433 | +5% $-346 | +10% $-259 |
| Rate | -1.0pp $-270 | -0.5pp $-351 | base $-433 | +0.5pp $-518 | +1.0pp $-603 |
UW: 25.0% down · 7.5% · 30yr · 1.5% tax · 5.0% vac · 8.0% maint · 8.0% mgmt
Financing live
Cash to close
- Down payment
- $81,250
- Closing costs
- $9,750
- Reserves months
- —
- Total cash needed
- —
Loan-product check · same deal, 3 products live
Conventional
25% down · 7.5% · 30yr
- Down + closing
- —
- Monthly P&I
- —
- Monthly cashflow
- —
- DSCR
- —
- Eligible?
- —
Personal DTI + credit; lowest rate.
DSCR
20% down · 8.5% · 30yr
- Down + closing
- —
- Monthly P&I
- —
- Monthly cashflow
- —
- DSCR
- —
- Eligible?
- —
No personal income docs; deal must DSCR.
Hard money
10% down · 12.0% · 12mo
- Down + closing
- —
- Monthly P&I
- —
- Monthly cashflow
- —
- DSCR
- —
- Eligible?
- —
Short-term bridge; refi at stabilization.
Rent comps 8 comps
| Address | Beds | Baths | Sqft | Rent | $/sqft | DOM | Units | Dist |
|---|---|---|---|---|---|---|---|---|
| 8787 NW Prairie View Rd Kansas City, MO | 2.0 | 1.0–2.0 | 1046 | $2,331 | $2.23 | 3d | 8 | 0.39mi |
| 8320 N Nodaway Ave Kansas City, MO | 3.0 | 2.5 | 1600 | $1,995 | $1.25 | 45d | 1 | 0.43mi |
| 8199 NW Milrey Dr Kansas City, MO | 3.0 | 2.5 | 1458 | $2,070 | $1.42 | 19d | 8 | 0.67mi |
| 8310 NW 77th Ter Kansas City, MO | 4.0 | 2.5 | 1792 | $2,399 | $1.34 | 5d | 1 | 0.93mi |
| 6904 NW 78th St Kansas City, MO | 3.0 | 1.0 | 1450 | $1,799 | $1.24 | 23d | 1 | 1.04mi |
| 7641 N Stoddard Ave Kansas City, MO | 3.0 | 2.0 | 1766 | $2,200 | $1.25 | 45d | 1 | 1.04mi |
| 8504 N Cosby Ave Kansas City, MO | 1.0–3.0 | 1.0–2.0 | 1110 | $1,987 | $1.79 | 4d | 18 | 1.30mi |
| 9641 N Ambassador Dr Kansas City, MO | 1.0–3.0 | 1.0–2.0 | 1224 | $2,565 | $2.10 | 3d | 21 | 1.32mi |
Listing history 4 events
-
2026-06-21days on market $325,000 Active 4 DOM
-
2026-06-18status $325,000 Active 1 DOM
-
2026-06-18remarks 699-char remark
-
2026-06-18$325,000 Coming Soon 1 DOM
ⓘ Source: listings_history table (triggers on properties + properties_extension) + one-shot
backfill from property_details.listing_events for pre-trigger history.
Tax reassessment forecast MO · Resets to sale price
- Current annual tax
- $4,016 · $335/mo
- Projected year-2 tax
- $4,016 · $335/mo
- Expected delta
- $0/yr ($0/mo · 0.0%)
ⓘ Screening estimate from a state-policy table — verify with the county assessor before closing.
Climate risk First Street
- Flood 1/10 Low FEMA zone X (unshaded) · 0% chance over 30 yrs
- Wildfire 1/10 Low
- Heat 4/10 Moderate 7 d/yr ≥107°F today · 17 d/yr by 30 yrs out
- Wind 2/10 Low
- Air quality 2/10 Low 2 unhealthy d/yr today · 2 by 30 yrs out
Nearby sold comps map
Loading sold comps map…
Walkable amenities ~0.75 mi
Loading nearby amenities…
Taxation est. · year 1
- Rental income
- $26,447
- − Mortgage interest
- −$18,205
- − Property taxes
- −$4,016
- − Insurance
- −$1,625
- − Repairs & maintenance
- −$2,116
- − Management
- −$2,116
- − Depreciation
- −$9,455
- Taxable loss
- −$11,086
- Est. tax savings @ 24.0%
- +$2,661
- After-tax cash flow
- $-2,540/yr
For passive investors: Depreciation is non-cash, so a rental often shows a tax loss while cash-flowing — sheltering income. Rental losses are passive: they offset passive income freely, and up to $25,000/yr can offset ordinary (W-2) income if you actively participate and your MAGI is under $100k (phasing out to $0 by $150k); unused losses carry forward. On sale, claimed depreciation is recaptured at up to 25%, and gains may owe capital-gains tax (a 1031 exchange can defer both). Figures are a year-1 estimate at your 24.0% rate — not tax advice; consult a CPA.
Schools (NCES district)
- District
- Park Hill
- NCES district ID
- 2923550
- Math proficiency
- 47% ▼ -3.00%
- Reading proficiency
- 54% ▼ -3.00%
- Median HH income
- $67,616
- Composite
- 44.86/100
- National rank
- #2723
- State rank
- #26 of 324 in MO
Livability — Kansas City
- Score
- 78/100
- State rank
- #28
- US rank
- #2671
Category grades
Schools grade is shown separately in the Schools card above.
Census & demographics
- Census place
- Kansas City, MO
- County
- Platte County · 100,198 people
- City population
- 439,467
- Metro
- Kansas City, MO-KS
- Population (ZIP)
- 31,545
- Household income
- $114,688
- Rent vs Own
- Severe rent burden
- 234.0
Population outlook (Platte County) Hauer SSP2
- Today (2025)
- 111,772 people
- By 2030
- 119,173 · +6.6%
- By 2040
- 133,326 · +19.3%
- By 2050
- 146,617 · +31.2%
- By 2075
- 178,626 · +59.8%
- By 2100
- 195,638 · +75.0%
Race, ethnicity, and origin ACS 2023
- Neighborhood character
- Predominantly White (82%)
- Race & ethnicity
- White 82% Hispanic / Latino 7% Two or more races 6% Black 3% Asian 2%
- Hispanic origin (detail)
- Mexican 5% Puerto Rican 1%
- Common ancestry
- Romanian 4% Italian 4% Slovak 4%
- Foreign-born
- 4% · Canada, China
- Languages at home
- 93% English-only · Spanish 3% Other Indo-European 1% German/W. Germanic 1%
Political lean MEDSL · Platte
- 2024 margin
- Toss-up / Even · D 47.7% · R 50.8% · Other 1.4%
- 2008→2024 swing
- +3.2pp toward D · 2008: -6.4pp · 2024: -3.1pp
- All cycles
- 2024: R+3.1 2020: R+3.0 2016: R+13.0 2012: R+14.2 2008: R+6.4
Not yet ingested
- Civics
- —
Market trends
- HPI YoY
- ▲ 33.10%
- Current HPI
- 739.89
- Rent YoY
- ▲ 7.03%
- Metro
- Kansas City, MO-KS
- State GDP YoY
- ▲ 1.84%
- F500 in state
- 20
Industry mix (Fortune 500 HQ in MO)
| Industry | F500 HQs | Revenue |
|---|---|---|
| Healthcare | 1 | $163B |
|
||
| Insurance | 1 | $21B |
|
||
| Industrial Technology | 1 | $17B |
|
||
| Retail | 1 | $16B |
|
||
| Industrial Distribution | 1 | $10B |
|
||
| Utilities | 1 | $9B |
|
||
Price history
+174.3% since first listed4 events — show timeline
- 2026-06-18 Coming Soon $325,000 Heartland MLS as Distributed by MLS Grid
- 1999-12-03 Sold (Public Records) — Public Records
- 1999-12-03 Sold (MLS) — Heartland MLS as Distributed by MLS Grid
- 1999-10-01 Listed $118,500 Heartland MLS as Distributed by MLS Grid
Property tax history
+5.7%/yrLatest (2025): $4,016 · +11.6% YoY. Source: county tax records.
Cash-flow waterfall
monthlySold comps — $/sqft
last 12 mo · ≤1 miLoading sold comps…