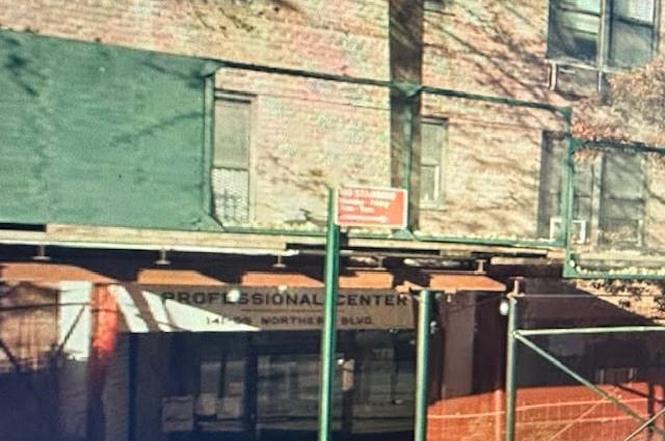
141-05 Northern Blvd Unit 1G · New York, NY
Flood risk 5/10 · Moderate
- FEMA flood zone
- X (unshaded)
- Chance of flooding over 30 yrs
- 0.5%
- Est. flood insurance / yr
- $507 – $1,088
Fire risk 1/10 · Minimal
- Est. fire insurance / yr
- $691 – $1,283
Heat risk 6/10 · Moderate
- Hot days now (above 99°F)
- 7 days/yr
- Hot days in 30 yrs
- 15 days/yr
Wind risk 6/10 · Moderate
- Chance of severe wind over 30 yrs
- 27.0%
Air-quality risk 4/10 · Minor
- Unhealthy air days now
- 6 days/yr
- Unhealthy air days in 30 yrs
- 6 days/yr
Risk factors via First Street. Map © Google.
Why this score? — see what drove the D grade
The composite is a weighted blend of 9 inputs, each scored 0–100. Each bar is that input's sub-score; the figure is the points it added to the 100-point composite (weight × sub-score).
- Cash flow +10.0/30.0
- 1% rule +10.0/10.0
- ARV discount +7.5/15.0
- Schools +5.0/10.0
- Livability +3.8/5.0
- Rent growth +3.2/5.0
- DSCR +2.8/10.0
- Condition / age +2.5/5.0
- Appreciation +0.0/10.0
$190,000
🖨 Deal sheet 📄 Offer letter ✓ Due diligence
Listing remarks
A commercial unit facing Northern Blvd. Street level. High Visibility. 7RM, 2 Baths. Maintenance includes taxes, heat and hot water. Interior updated. Turn Key. Immediately available. Great for business or professional office. A great catch for asset investment. Location: unmatched , highly sought-after commercial section of #7subway station in Flushing, next to multi-routes’ bus stops. Simply Convenient. A must-see property. Tax records state 0 square feet. Seller provided floorplan with 800 square footage.
Key facts
- Front unit
- Sizable rooms
- Updated
Tags
Property features AI
Finance
- HOA & community: Managed by co-op management company
Exterior
- Parking: Garage; Off-street parking; 1 garage space
- Utilities: Public sewer; Electricity available; Sewer available; Water available
- Home design: Townhouse; Stock cooperative
- Construction: Brick construction; Brick/mortar foundation
- Exterior features: Brick construction; Brick/mortar foundation; Not waterfront
Interior
- Kitchen: Other appliances
- Bedrooms: 7 total rooms (bedrooms included in room count)
- Bathrooms: 2 half bathrooms
- Heating & cooling: Hot water heating; Radiant heating; Other heating; Wall/window air conditioning units
- Interior features: Other interior features
Neighborhood map
What this means for you Summary
Snapshot
- This is a 2-bed/1.0-bath condo listed at $190k.
Deal economics
- At list price, monthly cash flow is $-116 ($-1k/yr) — negative.
- The deal already cash-flows at list — no discount required.
- Meets the 1% rule at list price ($3k rent vs $190k).
- Recommended offer: $167k (12.0% below list) — sets the bar for market timing.
- Cap rate 5.6% vs local median 2.6% in New York — top-decile yield for the area; either an underpriced asset or a hidden risk that comps aren't pricing in. Stress-test before assuming the spread holds.
Location & tenants
- Location reads 75/100 on livability (#268 in NY, #4,188 nationally) — a middle-class / working-renter tenant base. Strengths: amenities A+, commute A+, health & safety A; Watch: crime F, cost of living F.
- Market conditions: Rents rising (+2.8%/yr); 656 active listings in the ZIP; 40 comparable units currently listed for rent nearby; rentals at typical pace (median 19d on market — plan ~3-4 weeks tenant-placement turnaround); 5,302 units permitted in Queens County in 2024 (4,918 in 5+ unit buildings).
- At $2,890/mo this rent would consume 53% of the median local household income ($66k/yr) (locally 4119% of renters already pay >50% of income on rent) — very limited rent-growth headroom before tenants either downsize or default.
Forward outlook
- Local home prices are declining (-3.0%/yr); year-one equity from $1k of loan paydown is wiped out by about $6k of value loss. Plan a longer hold.
- Queens County population projected at +16% by 2050 — long-run rental-demand tailwind backs the buy-and-hold thesis.
Negotiation context
- It's been on market 239 days — a 12% lower offer ($167k) is reasonable based on typical stale-listing flexibility.
- 3 sale attempts since 11y ago; this cycle's ask has dropped $85k (31%) from the opening price — seller is motivated, your offer sets the floor, not the list.
Risks & watch-outs
- Watch-outs: HOA is 38% of rent; built in 1959 — expect roof / HVAC / electrical / plumbing capex.
- Climate carrying-cost: moderate flood risk; major wind risk, 27% chance of damaging wind over 30y; extreme-heat days projected 7→15/yr by 2055 (HVAC capex compounding) — expect insurance premiums to compound above CPI over the hold.
Questions for the listing agent
- What do current leases actually rent for vs. the listed asking? Can we see a recent rent roll and the last 12 months of T-12 income?
- It's been on market 239 days. Have you received any prior offers? Is the seller open to a 12% concession, seller financing, or rate buy-down credit?
- Built in 1959 — when were the roof, HVAC, electrical panel, plumbing, and water heater last replaced?
- What does the HOA fee cover, when was the last increase, and are there any pending special assessments or reserve-fund shortfalls?
- Any open or pending special assessments — roof, HVAC, plumbing, elevator, façade? What's the per-unit balance and payoff schedule, and is the seller paying it off at close or rolling it to the buyer?
- Why hasn't it sold? Are there any deal-killer items the seller is aware of (foundation, flood, title, zoning, code violations)?
- Is there a deadline driving the sale (1031 exchange, divorce, estate, relocation)? That informs how much negotiation room exists.
- Schools are B-rated — typically a magnet for longer-tenancy family renters. What's the average tenant stay here, and is there a school-zone premium baked into asking?
- Crime grade is F in this area — have there been break-ins, vandalism, or insurance claims at this property in the last 3 years? What carrier currently insures it and at what premium?
- The area grade is low — what's the realistic commute time and amenity access for the typical tenant pool here? Any planned neighborhood developments (good or bad) we should know about?
- What's the average days-on-market for RENTAL listings here right now (not sales)? A rising rental-DOM trend means longer vacancies and softer asking-rent achievability than the comps imply.
- What's the recent tenant-quality profile in this submarket — average credit score on applications, eviction rate, late-payment / NSF rate, and stable-employment percentage? A property-management company in the area should have these aggregated.
- How much new apartment / multifamily construction is in the pipeline within 1–3 miles? Heavy new supply (>2% of stock underway) typically softens rents 12–24 months out; light construction supports rent growth.
Investment metrics
- 1% rule
- 1.52% ✓
- Cap rate
- 5.56%
- Cash-on-cash
- -2.62%
- DSCR
- 0.88
- GRM
- 5.5
CMA / ARV
No comps found within radius.
Projected returns pro-forma
-3.0% appreciation · 2.78% rent growth · sell at horizon
- IRR
- -20.6%
- Equity multiple
- 0.28×
- Total profit
- $-38,100
- Equity at exit
- $28,330
- IRR
- -13.7%
- Equity multiple
- 0.20×
- Total profit
- $-42,404
- Equity at exit
- $16,428
Cash invested: $53,200 (down + closing). Projections, not guarantees.
Landlord ↔ Tenant lean methodology
- Overall (CITY)
- 0 Strongly Tenant-Friendly
- State New York
- 15 Strongly Tenant-Friendly · D+10
- County
- — inherits STATE
- City New York
- 0 Strongly Tenant-Friendly · D+34
ZIP-level market 11354
- Home prices YoY
- -33.9%
- Rents YoY
- 2.8%
- Active inventory
- 656
- Price-to-rent
- 5.5×
Monthly cashflow live
- Estimated rent
- $2,890 high interval (Pro) →
- Mortgage (P&I)
- −$996
- Tax est. 1.5%
- −$238 /mo · $2,850/yr
- Insurance
- −$79
- HOA est. from 3 same-building comps
- −$1,086
- Vacancy / Maint / Mgmt
- −$607
- Net cashflow
- $-116
Break-even live
UW: 25.0% down · 7.5% · 30yr · 1.5% tax · 5.0% vac · 8.0% maint · 8.0% mgmt
Financing live
Cash to close
- Down payment
- $47,500
- Closing costs
- $5,700
- Reserves months
- —
- Total cash needed
- —
Loan-product check · same deal, 3 products live
Conventional
25% down · 7.5% · 30yr
- Down + closing
- —
- Monthly P&I
- —
- Monthly cashflow
- —
- DSCR
- —
- Eligible?
- —
Personal DTI + credit; lowest rate.
DSCR
20% down · 8.5% · 30yr
- Down + closing
- —
- Monthly P&I
- —
- Monthly cashflow
- —
- DSCR
- —
- Eligible?
- —
No personal income docs; deal must DSCR.
Hard money
10% down · 12.0% · 12mo
- Down + closing
- —
- Monthly P&I
- —
- Monthly cashflow
- —
- DSCR
- —
- Eligible?
- —
Short-term bridge; refi at stabilization.
Rent comps 40 comps
| Address | Beds | Baths | Sqft | Rent | $/sqft | DOM | Units | Dist |
|---|---|---|---|---|---|---|---|---|
| 141-25 Northern Blvd Unit A14 Flushing, NY | 1.0 | 1.0 | 880 | $2,350 | $2.67 | 11d | 1 | 0.06mi |
| 140-16 34th Ave Unit 1113 Flushing, NY | 2.0 | 1.0 | 900 | $3,000 | $3.33 | 24d | 1 | 0.10mi |
| 140-16 34th Ave Apt 1003 Flushing, NY | 2.0 | 2.0 | 1100 | $3,300 | $3.00 | 24d | 1 | 0.11mi |
| 14016 34th Ave Unit 1210 Flushing, NY | 2.0 | 1.0 | 900 | $3,000 | $3.33 | 6d | 1 | 0.11mi |
| 13812 Northern Blvd Unit 7F Flushing, NY | 1.0 | 1.0 | 600 | $2,500 | $4.17 | 12d | 1 | 0.12mi |
| 36-20 Parsons Blvd Unit 5D Flushing, NY | 2.0 | 1.0 | 900 | $2,600 | $2.89 | 15d | 1 | 0.15mi |
| 13702 Northern Blvd Flushing, NY | 1.0–2.0 | 1.0 | 850 | $2,850 | $3.35 | 8d | 2 | 0.15mi |
| 3641 Union St Unit 2B Flushing, NY | 2.0 | 1.0 | 968 | $3,100 | $3.20 | 24d | 1 | 0.16mi |
| 14238 37th Ave Unit 4C Flushing, NY | 2.0 | 2.0 | 820 | $2,800 | $3.41 | 24d | 1 | 0.17mi |
| 139-31 34th Ave Unit 3rd fl Flushing, NY | 2.0 | 1.0 | 900 | $2,500 | $2.78 | 24d | 1 | 0.18mi |
| 14424 37th Ave Unit 5B Flushing, NY | 2.0 | 1.0 | 560 | $2,800 | $5.00 | 24d | 1 | 0.24mi |
| 145-18 34th Ave Unit 8A Flushing, NY | 1.0 | 2.0 | 700 | $2,400 | $3.43 | 2d | 1 | 0.24mi |
| 13835 39th Ave Flushing, NY | 2.0–3.0 | 2.0 | 1000 | $4,500 | $4.50 | 2d | 2 | 0.27mi |
| 13835 39th Ave Flushing, NY | 2.0 | 2.0 | 1014 | $4,350 | $4.29 | 24d | 2 | 0.27mi |
| 3132 Union St Unit 4G Flushing, NY | 1.0 | 1.0 | 650 | $2,400 | $3.69 | 8d | 1 | 0.29mi |
| 137-02 Northern Blvd Unit 6K Flushing, NY | 2.0 | 1.0 | 900 | $2,850 | $3.17 | 11d | 1 | 0.30mi |
| 3132 Union St Flushing, NY | 1.0 | 1.0 | 625 | $2,400 | $3.84 | 19d | 1 | 0.32mi |
| 14489 38th Ave Unit 4C Flushing, NY | 1.0 | 1.0 | 790 | $2,400 | $3.04 | 24d | 1 | 0.34mi |
| 13416 35th Ave Unit 7E Flushing, NY | 2.0 | 2.0 | 681 | $3,300 | $4.85 | 24d | 1 | 0.35mi |
| 3371 Prince St Unit 8J Flushing, NY | 2.0 | 2.0 | 741 | $4,075 | $5.50 | 15d | 1 | 0.37mi |
| 3371 Prince St Unit 6K Flushing, NY | 2.0 | 2.0 | 768 | $4,000 | $5.21 | 15d | 1 | 0.37mi |
| 3371 Prince St Unit 7C Flushing, NY | 2.0 | 2.0 | 773 | $4,025 | $5.21 | 15d | 1 | 0.37mi |
| 3371 Prince St Unit 8F Flushing, NY | 2.0 | 2.0 | 716 | $4,050 | $5.66 | 15d | 1 | 0.37mi |
| 14809 Northern Blvd Flushing, NY | 2.0–3.0 | 2.0 | 1056 | $3,500 | $3.31 | 14d | 2 | 0.43mi |
| 14427 Sanford Ave Unit 7G Flushing, NY | 2.0 | 1.0 | 655 | $3,500 | $5.34 | 24d | 1 | 0.50mi |
| 3916 Prince St Flushing, NY | 1.0 | 1.0 | 530 | $2,900 | $5.47 | 15d | 2 | 0.51mi |
| 40-10 149th St Fl 1 Flushing, NY | 2.0 | 1.0 | 900 | $2,200 | $2.44 | 15d | 1 | 0.52mi |
| 40-10 149th St Fl 3 Flushing, NY | 3.0 | 2.0 | 1030 | $2,900 | $2.82 | 13d | 1 | 0.52mi |
| 13327 39th Ave Unit 3N Flushing, NY | 1.0 | 1.0 | 720 | $3,600 | $5.00 | 24d | 1 | 0.55mi |
| 14943 35th Ave Flushing, NY | 1.0 | 1.0 | 775 | $2,450 | $3.16 | 3d | 2 | 0.55mi |
| 14943 35th Ave Flushing, NY | 1.0 | 1.0 | 750 | $2,400 | $3.20 | 2d | 1 | 0.56mi |
| 14731 Barclay Ave Flushing, NY | 2.0 | 1.0 | 900 | $2,500 | $2.78 | 24d | 1 | 0.56mi |
| 150-01 Northern Blvd Flushing, NY | 2.0 | 2.0 | 850 | $2,800 | $3.29 | 24d | 1 | 0.58mi |
| 2621 Union St Flushing, NY | 1.0 | 1.0 | 800 | $1,800 | $2.25 | 19d | 1 | 0.59mi |
| 4229 Parsons Blvd Unit 6B Flushing, NY | 3.0 | 2.0 | 860 | $3,400 | $3.95 | 24d | 1 | 0.60mi |
| 149-08 41st Ave Unit 3rd Floor Flushing, NY | 1.0 | 1.0 | 675 | $1,850 | $2.74 | 19d | 1 | 0.60mi |
| 4156 149th St Flushing, NY | 3.0 | 1.0 | 1000 | $3,000 | $3.00 | 24d | 1 | 0.64mi |
| 133-08 41st Rd Flushing, NY | 2.0 | 1.0 | 700 | $2,300 | $3.29 | 24d | 1 | 0.64mi |
| 13101 40th Rd Unit 2P Flushing, NY | 1.0 | 1.0 | 761 | $3,300 | $4.34 | 24d | 1 | 0.66mi |
| 4022 College Point Blvd Flushing, NY | 1.0–2.0 | 1.0–2.0 | 983 | $4,000 | $4.07 | 24d | 2 | 0.66mi |
HOA detail condo
- Monthly dues
- $0 · $0/yr
- Likely covers
- water
- Assessments
- None detected in remarks — confirm with the listing agent.
Listing history 18 events
-
2026-06-18days on market $190,000 Active 239 DOM
-
2026-06-17days on market $190,000 Active 238 DOM
-
2026-06-15days on market $190,000 Active 236 DOM
-
2026-06-13days on market $190,000 Active 234 DOM
-
2026-06-10days on market $190,000 Active 230 DOM
-
2026-06-08days on market $190,000 Active 229 DOM
-
2026-06-04days on market $190,000 Active 225 DOM
-
2026-06-03days on market $190,000 Active 224 DOM
-
2026-06-01days on market $190,000 Active 222 DOM
-
2026-05-31days on market $190,000 Active 221 DOM
-
2026-03-06price $190,000
-
2025-11-13price $270,000
-
2025-10-22$275,000 Active
-
2025-05-06historical
-
2025-02-25price $158,888
-
2024-11-05$298,888 Active
-
2015-07-14historical
-
2015-06-23$249,999
ⓘ Source: listings_history table (triggers on properties + properties_extension) + one-shot
backfill from property_details.listing_events for pre-trigger history.
Climate risk First Street
- Flood 5/10 Major FEMA zone X (unshaded) · 50% chance over 30 yrs
- Wildfire 1/10 Low
- Heat 6/10 Major 7 d/yr ≥99°F today · 15 d/yr by 30 yrs out
- Wind 6/10 Major 27% chance of damaging wind over 30 yrs
- Air quality 4/10 Moderate 6 unhealthy d/yr today · 6 by 30 yrs out
Nearby sold comps map
Loading sold comps map…
Walkable amenities ~0.75 mi
Loading nearby amenities…
Taxation est. · year 1
- Rental income
- $34,680
- − Mortgage interest
- −$10,643
- − Property taxes
- −$2,850
- − Insurance
- −$950
- − Repairs & maintenance
- −$2,774
- − Management
- −$2,774
- − HOA
- −$13,032
- − Depreciation
- −$5,527
- Taxable loss
- −$3,871
- Est. tax savings @ 24.0%
- +$929
- After-tax cash flow
- $-462/yr
For passive investors: Depreciation is non-cash, so a rental often shows a tax loss while cash-flowing — sheltering income. Rental losses are passive: they offset passive income freely, and up to $25,000/yr can offset ordinary (W-2) income if you actively participate and your MAGI is under $100k (phasing out to $0 by $150k); unused losses carry forward. On sale, claimed depreciation is recaptured at up to 25%, and gains may owe capital-gains tax (a 1031 exchange can defer both). Figures are a year-1 estimate at your 24.0% rate — not tax advice; consult a CPA.
Schools (NCES district)
No district data.
Livability — New York
- Score
- 75/100
- State rank
- #268
- US rank
- #4188
Category grades
Schools grade is shown separately in the Schools card above.
Census & demographics
- Census place
- New York, NY
- County
- Queens County · 1,914,869 people
- City population
- 7,731,280
- Metro
- New York-Newark-Jersey City, NY-NJ-PA
- Population (ZIP)
- 53,028
- Household income
- $66,010
- Rent vs Own
- Severe rent burden
- 4119.0
Population outlook (Queens County) Hauer SSP2
- Today (2025)
- 2,546,320 people
- By 2030
- 2,643,059 · +3.8%
- By 2040
- 2,815,563 · +10.6%
- By 2050
- 2,944,423 · +15.6%
- By 2075
- 3,123,338 · +22.7%
- By 2100
- 3,098,688 · +21.7%
Race, ethnicity, and origin ACS 2023
- Neighborhood character
- Majority Asian (64%)
- Race & ethnicity
- Asian 64% White 15% Hispanic / Latino 14% Two or more races 6% Black 3%
- Hispanic origin (detail)
- Mexican 2% Puerto Rican 2% Dominican 2%
- Common ancestry
- Romanian 1% Italian 1%
- Foreign-born
- 66% · China, Canada, South Korea
- Languages at home
- 22% English-only · Chinese 43% Spanish 14% Korean 11%
Political lean MEDSL · Queens
- 2024 margin
- Strong D (+24.6) · D 62.3% · R 37.7%
- 2008→2024 swing
- -26.2pp toward R · 2008: 50.8pp · 2024: 24.6pp
- All cycles
- 2024: D+24.6 2020: D+45.2 2016: D+53.4 2012: D+58.5 2008: D+50.8
Not yet ingested
- Civics
- —
Market trends
- HPI YoY
- ▼ -131.64%
- Current HPI
- 257.0828
- Rent YoY
- ▲ 2.78%
- Metro
- New York-Newark-Jersey City, NY-NJ-PA
- State GDP YoY
- ▲ 2.60%
- F500 in state
- 92
Industry mix (Fortune 500 HQ in NY)
| Industry | F500 HQs | Revenue |
|---|---|---|
| Financial Services | 10 | $950B |
|
||
| Consumer Goods | 9 | $162B |
|
||
| Insurance | 4 | $225B |
|
||
| Telecommunications | 2 | $144B |
|
||
| Pharmaceuticals | 2 | $112B |
|
||
| Media / Entertainment | 2 | $69B |
|
||
Price history
-24.0% since first listed8 events — show timeline
- 2026-03-06 Price Changed $190,000 OneKey® MLS as Distributed by MLS Grid
- 2025-11-13 Price Changed $270,000 OneKey® MLS as Distributed by MLS Grid
- 2025-10-22 Listed $275,000 OneKey® MLS as Distributed by MLS Grid
- 2025-05-06 Listing Removed — OneKey® MLS as Distributed by MLS Grid
- 2025-02-25 Price Changed $158,888 OneKey® MLS as Distributed by MLS Grid
- 2024-11-05 Listed $298,888 OneKey® MLS as Distributed by MLS Grid
- 2015-07-14 Listing Removed — OneKey® MLS as Distributed by MLS Grid
- 2015-06-23 Listed $249,999 OneKey® MLS as Distributed by MLS Grid
Cash-flow waterfall
monthlySold comps — $/sqft
last 12 mo · ≤1 miLoading sold comps…