272 Harry L Dr · Johnson City, NY
Flood risk No data
- FEMA flood zone
- —
- Chance of flooding over 30 yrs
- —
- Est. flood insurance / yr
- —
Fire risk No data
- Est. fire insurance / yr
- —
Heat risk No data
- Hot days now (above threshold)
- —
- Hot days in 30 yrs
- —
Wind risk No data
- Chance of severe wind over 30 yrs
- —
Air-quality risk No data
- Unhealthy air days now
- —
- Unhealthy air days in 30 yrs
- —
Risk factors via First Street. Map © Google.
Why this score? — see what drove the C grade
The composite is a weighted blend of 9 inputs, each scored 0–100. Each bar is that input's sub-score; the figure is the points it added to the 100-point composite (weight × sub-score).
- ARV discount +15.0/15.0
- Cash flow +11.6/30.0
- Appreciation +10.0/10.0
- Rent growth +4.9/5.0
- Livability +3.8/5.0
- DSCR +3.4/10.0
- 1% rule +3.3/10.0
- Schools +3.3/10.0
- Condition / age +1.0/5.0
$229,000
🖨 Deal sheet 📄 Offer letter ✓ Due diligence
Listing remarks MLS
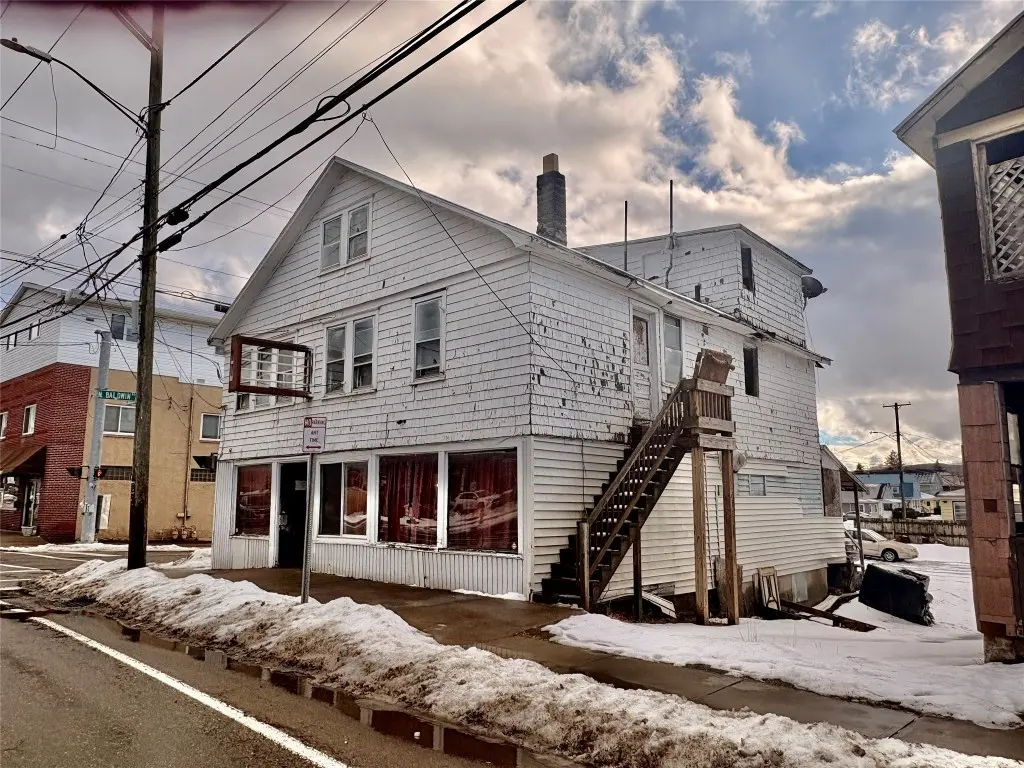
Mixed use building on a high traffic area in Johnson City. This is a great development opportunity. 4 total units- 1st floor is a bar. Second floor is two- 2 bedroom apts and the 3rd floor is a 1 bedroom apt. 4 units total that Need work but have lots of potential to generate income. Owner is in the process of doing work. Large parking lot. Could be sold separately or as a package deal with 276 Harry l Drive (2 family), 280 Harry L Drive (land lot) and 284 Harry L Drive (single family). This bar is at the corner of N. Baldwin street and Harry L Drive.
Key facts
- Large parking lot
- 3 apartments
- High traffic area
Tags
Neighborhood map
What this means for you Summary
Snapshot
- This is a 5-bed/3.0-bath condo listed at $229k. Condition is rated poor.
Deal economics
- At list price, monthly cash flow is $-73 ($-874/yr) — negative.
- To cash-flow at today's rent, offer at most $218k (4.6% below list).
- To meet the 1% rule (rent ≥ 1% of price), the offer needs to be $191k (16.5% below list).
- Recommended offer: $191k (16.5% below list) — sets the bar for 1% rule.
Location & tenants
- Location reads 76/100 on livability (#238 in NY, #3,739 nationally) — a middle-class / working-renter tenant base. Strengths: cost of living A+, housing A+, health & safety A+; Watch: crime F, employment D-.
- Johnson City Central School District (suburban): math 38% / reading 41% proficiency, ranked #535 of 590 in NY (top 91%) — families likely to look elsewhere, expect single-tenant / working-renter base with shorter leases.
- Market conditions: Rents rising fast (+9.5%/yr); 99 active listings in the ZIP; 2 comparable units currently listed for rent nearby; 340 units permitted in Broome County in 2024 (269 in 5+ unit buildings).
- This rent runs 39% of the median local income ($59k/yr) — at the standard rent-burdened threshold; future hikes will face affordability resistance.
Forward outlook
- In year one you build about $24k of equity ($2k loan paydown + $23k appreciation (10.0% local appreciation)).
- Broome County population projected at -13% by 2050 — secular population decline; favor cash flow + early exit over multi-decade hold.
- At projected returns (10.0% appreciation + 8.0% rent growth), your $64k cash investment doubles in ~3 years — after that, you're playing with house money.
- By year 2, paydown + projected appreciation supports a ~$39k cash-out refi (75% LTV) — recoverable capital for the next deal without selling this one.
Negotiation context
- Only 3 days on market — expect competitive offers; lowballing is unlikely to land.
Questions for the listing agent
- What do current leases actually rent for vs. the listed asking? Can we see a recent rent roll and the last 12 months of T-12 income?
- Have any recent inspections been done? Can we get a copy of the seller's disclosures and any deferred-maintenance estimates?
- Built in 1965 — when were the roof, HVAC, electrical panel, plumbing, and water heater last replaced?
- Any open or pending special assessments — roof, HVAC, plumbing, elevator, façade? What's the per-unit balance and payoff schedule, and is the seller paying it off at close or rolling it to the buyer?
- Is there a deadline driving the sale (1031 exchange, divorce, estate, relocation)? That informs how much negotiation room exists.
- Crime grade is F in this area — have there been break-ins, vandalism, or insurance claims at this property in the last 3 years? What carrier currently insures it and at what premium?
- What's the average days-on-market for RENTAL listings here right now (not sales)? A rising rental-DOM trend means longer vacancies and softer asking-rent achievability than the comps imply.
- What's the recent tenant-quality profile in this submarket — average credit score on applications, eviction rate, late-payment / NSF rate, and stable-employment percentage? A property-management company in the area should have these aggregated.
- How much new apartment / multifamily construction is in the pipeline within 1–3 miles? Heavy new supply (>2% of stock underway) typically softens rents 12–24 months out; light construction supports rent growth.
Investment metrics
- 1% rule
- 0.83% ✗
- Cap rate
- 5.91%
- Cash-on-cash
- -1.36%
- DSCR
- 0.94
- GRM
- 10.0
CMA / ARV
- ARV (median comp)
- $277,483
- List price
- $229,000
- Delta
- -17.15%
- Verdict
- UNDERPRICED
- Comps
- 1 within 2.0 mi
Projected returns pro-forma
10.0% appreciation · 8.0% rent growth · sell at horizon
- IRR
- 25.0%
- Equity multiple
- 3.03×
- Total profit
- $130,209
- Equity at exit
- $206,301
- IRR
- 23.4%
- Equity multiple
- 7.43×
- Total profit
- $412,169
- Equity at exit
- $444,897
Cash invested: $64,120 (down + closing). Projections, not guarantees.
Landlord ↔ Tenant lean methodology
- Overall (STATE)
- 15 Strongly Tenant-Friendly
- State New York
- 15 Strongly Tenant-Friendly · D+10
- County
- — inherits STATE
- City
- — inherits STATE
ZIP-level market 13790
- Home prices YoY
- 6.8%
- Rents YoY
- 9.5%
- Active inventory
- 99
- Price-to-rent
- 10.0×
Monthly cashflow live
- Estimated rent
- $1,911 medium interval (Pro) →
- Mortgage (P&I)
- −$1,201
- Tax est. 1.5%
- −$286 /mo · $3,435/yr
- Insurance
- −$95
- HOA
- −$0
- Vacancy / Maint / Mgmt
- −$401
- Net cashflow
- $-73
Break-even live
UW: 25.0% down · 7.5% · 30yr · 1.5% tax · 5.0% vac · 8.0% maint · 8.0% mgmt
Financing live
Cash to close
- Down payment
- $57,250
- Closing costs
- $6,870
- Reserves months
- —
- Total cash needed
- —
Loan-product check · same deal, 3 products live
Conventional
25% down · 7.5% · 30yr
- Down + closing
- —
- Monthly P&I
- —
- Monthly cashflow
- —
- DSCR
- —
- Eligible?
- —
Personal DTI + credit; lowest rate.
DSCR
20% down · 8.5% · 30yr
- Down + closing
- —
- Monthly P&I
- —
- Monthly cashflow
- —
- DSCR
- —
- Eligible?
- —
No personal income docs; deal must DSCR.
Hard money
10% down · 12.0% · 12mo
- Down + closing
- —
- Monthly P&I
- —
- Monthly cashflow
- —
- DSCR
- —
- Eligible?
- —
Short-term bridge; refi at stabilization.
Rent comps 2 comps
| Address | Beds | Baths | Sqft | Rent | $/sqft | DOM | Units | Dist |
|---|---|---|---|---|---|---|---|---|
| 50 Crocker Ave Johnson City, NY | 4.0 | 2.0 | 1411 | $2,000 | $1.42 | 21d | 1 | 0.70mi |
| 4 Baxter St Unit Left Binghamton, NY | 4.0 | 2.5 | 1800 | $1,500 | $0.83 | 13d | 1 | 1.24mi |
HOA detail condo
- Monthly dues
- $0 · $0/yr
- Assessments
- None detected in remarks — confirm with the listing agent.
Listing history 8 events
-
2026-06-19days on market $229,000 Active 3 DOM
-
2026-06-18days on market $229,000 Active 2 DOM
-
2026-06-17pricedays on market $229,000 Active 1 DOM
-
2026-06-01days on market $229,900 Active 150 DOM
-
2026-05-31days on market $229,900 Active 149 DOM
-
2026-05-30days on market $229,900 Active 148 DOM
-
2026-03-18price $229,900 557-char remark
Show marketing remark (557 chars)
Mixed use building on a high traffic area in Johnson City. This is a great development opportunity. 4 total units- 1st floor is a bar. Second floor is two- 2 bedroom apts and the 3rd floor is a 1 bedroom apt. 4 units total that Need work but have lots of potential to generate income. Owner is in the process of doing work. Large parking lot. Could be sold separately or as a package deal with 276 Harry l Drive (2 family), 280 Harry L Drive (land lot) and 284 Harry L Drive (single family). This bar is at the corner of N. Baldwin street and Harry L Drive.
-
2026-01-02$249,900 Active 557-char remark
Show marketing remark (557 chars)
Mixed use building on a high traffic area in Johnson City. This is a great development opportunity. 4 total units- 1st floor is a bar. Second floor is two- 2 bedroom apts and the 3rd floor is a 1 bedroom apt. 4 units total that Need work but have lots of potential to generate income. Owner is in the process of doing work. Large parking lot. Could be sold separately or as a package deal with 276 Harry l Drive (2 family), 280 Harry L Drive (land lot) and 284 Harry L Drive (single family). This bar is at the corner of N. Baldwin street and Harry L Drive.
ⓘ Source: listings_history table (triggers on properties + properties_extension) + one-shot
backfill from property_details.listing_events for pre-trigger history.
Nearby sold comps map
Loading sold comps map…
Walkable amenities ~0.75 mi
Loading nearby amenities…
Taxation est. · year 1
- Rental income
- $22,933
- − Mortgage interest
- −$12,828
- − Property taxes
- −$3,435
- − Insurance
- −$1,145
- − Repairs & maintenance
- −$1,835
- − Management
- −$1,835
- − Depreciation
- −$6,662
- Taxable loss
- −$4,806
- Est. tax savings @ 24.0%
- +$1,153
- After-tax cash flow
- $279/yr
For passive investors: Depreciation is non-cash, so a rental often shows a tax loss while cash-flowing — sheltering income. Rental losses are passive: they offset passive income freely, and up to $25,000/yr can offset ordinary (W-2) income if you actively participate and your MAGI is under $100k (phasing out to $0 by $150k); unused losses carry forward. On sale, claimed depreciation is recaptured at up to 25%, and gains may owe capital-gains tax (a 1031 exchange can defer both). Figures are a year-1 estimate at your 24.0% rate — not tax advice; consult a CPA.
Condition & rehab AI · 12 photos
This property requires extensive repairs and structural stabilization to become habitable and safe for occupancy. Significant investment is needed to address the severe structural damage and other critical issues.
Repairs flagged
- Major structural repairs — Severe structural damage
- Major roof repair — Exposed roof structure
- Major siding repair — Missing siding
- Major drywall repair — Exposed wiring and structural damage
- Major flooring repair — Exposed subflooring
- Major plumbing repair — Exposed plumbing systems
- Major electrical repair — Exposed electrical systems
Value-add opportunities
- Both structural repairs — Stabilizing the building and making it safe for habitation
- Both exterior siding and roof repair — Improving curb appeal and safety
- Both interior drywall and flooring repair — Creating a safe and habitable living space
- Both plumbing and electrical repairs — Ensuring safety and functionality
Renovation cost estimate screening
| Repair item | Severity | Est. cost |
|---|---|---|
| structural repairs · Severe structural damage | Major | $15,000–50,000 |
| roof repair · Exposed roof structure | Major | $15,000–50,000 |
| siding repair · Missing siding | Major | $15,000–50,000 |
| drywall repair · Exposed wiring and structural damage | Major | $15,000–50,000 |
| flooring repair · Exposed subflooring | Major | $15,000–50,000 |
| plumbing repair · Exposed plumbing systems | Major | $15,000–50,000 |
| electrical repair · Exposed electrical systems | Major | $15,000–50,000 |
| Total estimated repair cost · 7 items | $105,000–350,000 |
Value-add ROI direction
- Both structural repairs — Stabilizing the building and making it safe for habitation ↑
- Both exterior siding and roof repair — Improving curb appeal and safety ↑
- Both interior drywall and flooring repair — Creating a safe and habitable living space ↑
- Both plumbing and electrical repairs — Ensuring safety and functionality ↑
ⓘ Cost ranges are severity-bucket heuristics (US national rule-of-thumb). Get contractor quotes + a written scope before underwriting a rehab budget.
Schools (NCES district)
- District
- Johnson City Central School District
- NCES district ID
- 3615900
- Math proficiency
- 38% ▼ -8.00%
- Reading proficiency
- 41% ▲ 2.00%
- Median HH income
- $40,514
- Composite
- 33.17/100
- National rank
- #5545
- State rank
- #535 of 590 in NY
Livability — Johnson City
- Score
- 76/100
- State rank
- #238
- US rank
- #3739
Category grades
Schools grade is shown separately in the Schools card above.
Census & demographics
- Census place
- Johnson City, NY
- County
- Broome County · 126,805 people
- City population
- 18,739
- Metro
- Binghamton, NY
- Population (ZIP)
- 18,739
- Household income
- $59,045
- Rent vs Own
- Severe rent burden
- 1233.0
Population outlook (Broome County) Hauer SSP2
- Today (2025)
- 187,989 people
- By 2030
- 183,066 · -2.6%
- By 2040
- 172,228 · -8.4%
- By 2050
- 163,161 · -13.2%
- By 2075
- 153,641 · -18.3%
- By 2100
- 140,851 · -25.1%
Race, ethnicity, and origin ACS 2023
- Neighborhood character
- Predominantly White (75%)
- Race & ethnicity
- White 75% Two or more races 9% Asian 8% Black 6% Hispanic / Latino 4%
- Common ancestry
- Romanian 6% Lithuanian 3% Scotch-Irish 2%
- Foreign-born
- 9% · Canada, China, Vietnam
- Languages at home
- 88% English-only · Other Indo-European 4% French/Haitian/Cajun 2% Spanish 2%
Political lean MEDSL · Broome
- 2024 margin
- Toss-up / Even · D 50.2% · R 49.8%
- 2008→2024 swing
- -7.6pp toward R · 2008: 8.0pp · 2024: 0.4pp
- All cycles
- 2024: D+0.4 2020: D+3.5 2016: R+3.7 2012: D+4.6 2008: D+8.0
Not yet ingested
- Civics
- —
Market trends
- HPI YoY
- ▲ 18.06%
- Current HPI
- 285.3668
- Rent YoY
- ▲ 9.47%
- Metro
- Binghamton, NY
- State GDP YoY
- ▲ 2.60%
- F500 in state
- 92
Industry mix (Fortune 500 HQ in NY)
| Industry | F500 HQs | Revenue |
|---|---|---|
| Financial Services | 10 | $950B |
|
||
| Consumer Goods | 9 | $162B |
|
||
| Insurance | 4 | $225B |
|
||
| Telecommunications | 2 | $144B |
|
||
| Pharmaceuticals | 2 | $112B |
|
||
| Media / Entertainment | 2 | $69B |
|
||
Price history
-8.0% since first listed2 events — show timeline
- 2026-03-18 Price Changed $229,900 GBAOR
- 2026-01-02 Listed $249,900 GBAOR
Cash-flow waterfall
monthlySold comps — $/sqft
last 12 mo · ≤1 miLoading sold comps…