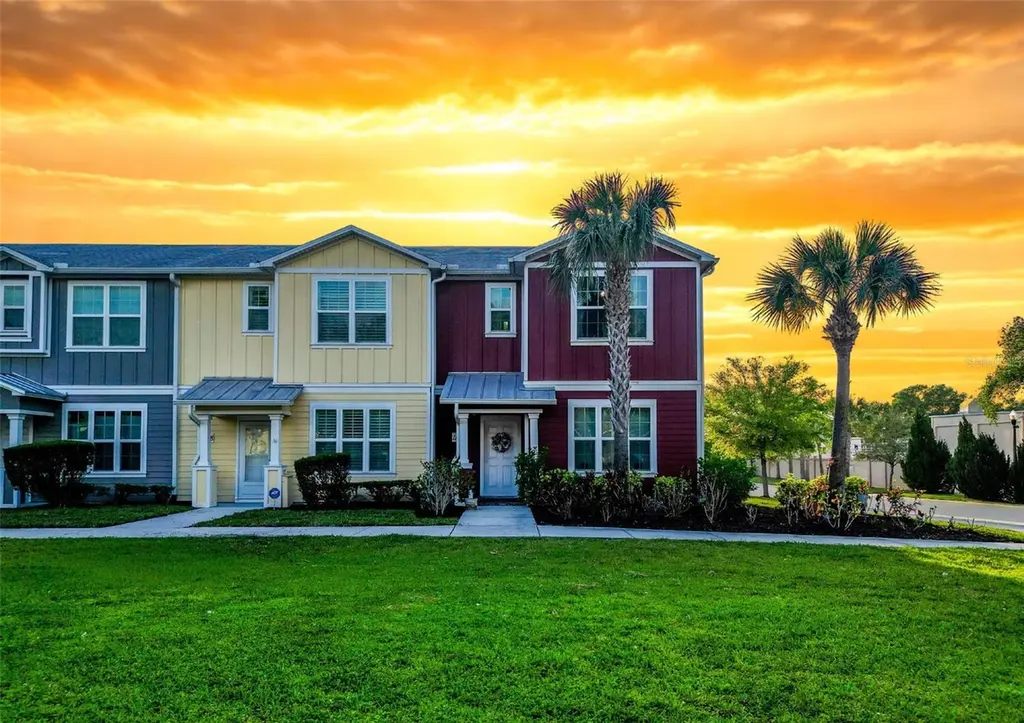
1132 Martin Luther King JR Ave · Dunedin, FL
Flood risk 3/10 · Minor
- FEMA flood zone
- X (unshaded)
- Chance of flooding over 30 yrs
- 0.12%
- Est. flood insurance / yr
- $507 – $1,088
Fire risk 1/10 · Minimal
- Est. fire insurance / yr
- $947 – $1,759
Heat risk 10/10 · Severe
- Hot days now (above 107°F)
- 7 days/yr
- Hot days in 30 yrs
- 26 days/yr
Wind risk 10/10 · Severe
- Chance of severe wind over 30 yrs
- 99.0%
Air-quality risk 3/10 · Minor
- Unhealthy air days now
- 2 days/yr
- Unhealthy air days in 30 yrs
- 3 days/yr
Risk factors via First Street. Map © Google.
Why this score? — see what drove the C grade
The composite is a weighted blend of 9 inputs, each scored 0–100. Each bar is that input's sub-score; the figure is the points it added to the 100-point composite (weight × sub-score).
- Cash flow +15.5/30.0
- ARV discount +15.0/15.0
- 1% rule +6.3/10.0
- DSCR +4.8/10.0
- Schools +4.3/10.0
- Livability +4.3/5.0
- Rent growth +3.2/5.0
- Condition / age +2.5/5.0
- Appreciation +0.0/10.0
$244,573
🖨 Deal sheet (PDF) 📄 Offer letter ✓ Due diligence
Listing remarks
* Income Restrictions * No Renters * Land Lease * Live the Downtown Dunedin Lifestyle: Solar-Powered & Turn-Key! Experience the ultimate in coastal living with this rare 3-bedroom, 3-bathroom townhouse located right in the heart of Downtown Dunedin. Leave the car in your 1-car garage—you are steps away from the Pinellas Trail, award-winning breweries, boutique shopping, and the vibrant marina sunsets that make this golf-cart-friendly community famous. This “as good as new” home, built in 2018, is as smart as it is stylish. Enjoy massive utility savings with a fully paid solar system and sleep soundly through any season thanks to hurricane-impact windows throu
Key facts
- Private sanctuary
- Solar powered
- Golf cart friendly
Tags
Property features AI
Finance
- Other: Furnished; Community features: playground, sidewalks, street lights, golf carts allowed, reclaimed water irrigation, park; Pets allowed with breed restrictions
- Financial info: Land lease amount $25 (if applicable); Total annual fees $6,000 (monthly $500)
- HOA & community: Has HOA (monthly fee $500); Association amenities include park; Association fee covers common area taxes, insurance, maintenance (structure & grounds), pest control, private road, sewer, trash, water, escrow reserves
Exterior
- Parking: 1-car garage (garage faces rear) with garage door opener; Driveway; Curb parking; On-street parking; Guest parking; Open parking at ground level
- Security: Deed restrictions (community); Community mailboxes
- Utilities: Public water; Public sewer; Electricity connected; Cable connected; Water connected; Sewer connected; Underground utilities
- Home design: Townhouse; Two stories; East-facing; End unit
- Construction: Block and cement siding construction; Shingle roof; Slab foundation; Built as residential townhouse
- Exterior features: Rear porch; Outdoor grill; Exterior lighting; Rain gutters; Sidewalk; Vinyl fencing; Irrigation equipment; Trees and landscaped vegetation; Corner lot in city limits; Paved roads / paved lot; Street lights
Interior
- Kitchen: Disposal; Microwave; Range; Refrigerator; Stone counters; Solid wood cabinets
- Bedrooms: 3 bedrooms
- Flooring: Carpet; Ceramic tile; Laminate; Vinyl
- Bathrooms: 2 full bathrooms; 1 half bathroom
- Heating & cooling: Central heating (electric); Solar heating; Central air conditioning
- Interior features: Ceiling fans; High ceilings; Living room/dining room combo / Open floorplan; Solid wood cabinets; Stone counters; Thermostat; Window treatments
- Laundry & utility: Washer; Dryer; Electric water heater; Inside laundry in upper-level laundry closet
Neighborhood map
What this means for you Summary
Snapshot
- This is a 3-bed/2.5-bath townhouse listed at $245k.
Deal economics
- At list price, monthly cash flow is $100 ($1k/yr) — positive.
- The deal already cash-flows at list — no discount required.
- Meets the 1% rule at list price ($3k rent vs $245k).
- Recommended offer: $237k (3.0% below list) — sets the bar for market timing.
- Cap rate 6.8% vs local median 2.9% in Dunedin — top-decile yield for the area; either an underpriced asset or a hidden risk that comps aren't pricing in. Stress-test before assuming the spread holds.
Location & tenants
- Location reads 86/100 on livability (#15 in FL, #411 nationally) — a professional / high-income tenant draw. Strengths: crime A+, commute A+, housing A+; Watch: employment C-, amenities D.
- Pinellas (suburban): math 51% / reading 51% proficiency, ranked #31 of 73 in FL (top 42%) — acceptable for families but not a draw, mixed tenant base, ~2y average lease.
- Zoned schools: San Jose Elementary School (math 62% / reading 62%, grade B, #608 of 2,144 statewide, top 29%, 331 students, 56% FRL); Dunedin Highland Middle School (math 53% / reading 52%, grade C+, #213 of 571 statewide, top 38%, 899 students, 53% FRL); Dunedin High School (math 36% / reading 45%, grade F, #294 of 667 statewide, top 44%, 1,203 students, 48% FRL) — zoned schools at 52% FRL track the district average.
- Market conditions: Rents rising (+2.7%/yr); 482 active listings in the ZIP; 38 comparable units currently listed for rent nearby; rentals at typical pace (median 19d on market — plan ~3-4 weeks tenant-placement turnaround); 2,676 units permitted in Pinellas County in 2024 (1,422 in 5+ unit buildings).
- This rent runs 45% of the median local income ($74k/yr) — at the standard rent-burdened threshold; future hikes will face affordability resistance.
Forward outlook
- Local home prices are declining (-3.0%/yr); year-one equity from $2k of loan paydown is wiped out by about $7k of value loss. Plan a longer hold.
- Pinellas County population projected at +14% by 2050 — modest demand growth; plan on rents tracking national, not racing it.
Negotiation context
- It's been on market 58 days — a 3% lower offer ($237k) is reasonable based on typical stale-listing flexibility.
Risks & watch-outs
- Climate carrying-cost: severe wind risk, 99% chance of damaging wind over 30y; extreme-heat days projected 7→26/yr by 2055 (HVAC capex compounding) — expect insurance premiums to compound above CPI over the hold.
Questions for the listing agent
- It's been on market 58 days. Have you received any prior offers? Is the seller open to a 3% concession, seller financing, or rate buy-down credit?
- What does the HOA fee cover, when was the last increase, and are there any pending special assessments or reserve-fund shortfalls?
- Is there a deadline driving the sale (1031 exchange, divorce, estate, relocation)? That informs how much negotiation room exists.
- Schools are A-rated — typically a magnet for longer-tenancy family renters. What's the average tenant stay here, and is there a school-zone premium baked into asking?
- What's the average days-on-market for RENTAL listings here right now (not sales)? A rising rental-DOM trend means longer vacancies and softer asking-rent achievability than the comps imply.
- What's the recent tenant-quality profile in this submarket — average credit score on applications, eviction rate, late-payment / NSF rate, and stable-employment percentage? A property-management company in the area should have these aggregated.
- How much new for-sale + rental construction is in the pipeline within 1–3 miles? Heavy new supply typically softens prices + rents 12–24 months out; constrained supply supports both.
Investment metrics
- 1% rule
- 1.13% ✓
- Cap rate
- 6.78%
- Cash-on-cash
- 1.75%
- DSCR
- 1.08
- GRM
- 7.4
CMA / ARV
- ARV (on-the-fly)
- $478,540
- Comps found
- 6
Show comp detail 6 sales within ~0.75 mi
| Address | Dist | Beds/Ba | Sqft | Sold | Price | $/sf | Match |
|---|---|---|---|---|---|---|---|
| 1116 Martin Luther King JR Ave | 0.02mi | 3/2.5 | 1,420 (0%) | 12mo | $299,000 | $211 | 89 |
| 200 Main St #204 | 0.48mi | 2/2.0 (-1) | 1,416 (-0%) | 10mo | $775,000 | $547 | 62 |
| 971 Wellington Ct | 0.23mi | 2/1.5 (-1) | 1,260 (-11%) | 13mo | $425,000 | $337 | 51 |
| 946 Highland Ave #32 | 0.23mi | 2/2.5 (-1) | 1,610 (+13%) | 20mo | $640,000 | $398 | 46 |
| 632 Edgewater Dr #838 | 0.66mi | 2/2.0 (-1) | 1,405 (-1%) | 21mo | $345,000 | $246 | 43 |
| 1515 Bayshore Blvd #43 | 0.49mi | 2/2.5 (-1) | 1,250 (-12%) | 23mo | $340,000 | $272 | 34 |
Match score weights: distance 35% · size 25% · config 20% · recency 20%. Top-matched comps best support the ARV.
Projected returns pro-forma
-3.0% appreciation · 2.69% rent growth · sell at horizon
- IRR
- -13.8%
- Equity multiple
- 0.51×
- Total profit
- $-33,859
- Equity at exit
- $36,467
- IRR
- -5.4%
- Equity multiple
- 0.65×
- Total profit
- $-23,663
- Equity at exit
- $21,146
Cash invested: $68,480 (down + closing). Projections, not guarantees.
Landlord ↔ Tenant lean methodology
- Overall (STATE)
- 87 Strongly Landlord-Friendly
- State Florida
- 87 Strongly Landlord-Friendly · R+3
- County
- — inherits STATE
- City
- — inherits STATE
ZIP-level market 34698
- Rents YoY
- 2.7%
- Active inventory
- 482
- Price-to-rent
- 7.4×
Monthly cashflow live
- Estimated rent
- $2,762 high interval (Pro) →
- Mortgage (P&I)
- −$1,283
- Tax from tax record
- −$198 /mo · $2,371/yr
- Insurance
- −$102
- HOA
- −$500
- Vacancy / Maint / Mgmt
- −$580
- Net cashflow
- $100
Break-even live
Sensitivity live
| Price | -10% $238 | -5% $169 | +0% $100 | +5% $30 | +10% $-39 |
|---|---|---|---|---|---|
| Rent | -10% $-118 | -5% $-9 | +0% $100 | +5% $209 | +10% $318 |
| Rate | -1.0pp $223 | -0.5pp $162 | base $100 | +0.5pp $36 | +1.0pp $-28 |
UW: 25.0% down · 7.5% · 30yr · 1.5% tax · 5.0% vac · 8.0% maint · 8.0% mgmt
Financing live
Cash to close
- Down payment
- $61,143
- Closing costs
- $7,337
- Reserves months
- —
- Total cash needed
- —
Loan-product check · same deal, 3 products live
Conventional
25% down · 7.5% · 30yr
- Down + closing
- —
- Monthly P&I
- —
- Monthly cashflow
- —
- DSCR
- —
- Eligible?
- —
Personal DTI + credit; lowest rate.
DSCR
20% down · 8.5% · 30yr
- Down + closing
- —
- Monthly P&I
- —
- Monthly cashflow
- —
- DSCR
- —
- Eligible?
- —
No personal income docs; deal must DSCR.
Hard money
10% down · 12.0% · 12mo
- Down + closing
- —
- Monthly P&I
- —
- Monthly cashflow
- —
- DSCR
- —
- Eligible?
- —
Short-term bridge; refi at stabilization.
Rent comps 38 comps
| Address | Beds | Baths | Sqft | Rent | $/sqft | DOM | Units | Dist |
|---|---|---|---|---|---|---|---|---|
| 525 Bay St Dunedin, FL | 2.0 | 1.0 | 1104 | $3,500 | $3.17 | 6d | 1 | 0.07mi |
| 1235 Bass Blvd Dunedin, FL | 3.0 | 2.0 | 1300 | $2,550 | $1.96 | 20d | 1 | 0.38mi |
| 1523 Bayshore Blvd Unit 6 Dunedin, FL | 3.0 | 1.0 | 1061 | $3,000 | $2.83 | 26d | 1 | 0.55mi |
| 341 Albert St Dunedin, FL | 3.0 | 2.5 | 1770 | $8,250 | $4.66 | 26d | 1 | 0.62mi |
| 1412 Gladys Cir Unit 1466152P Dunedin, FL | 3.0 | 2.0 | 1097 | $3,849 | $3.51 | 0d | 1 | 0.63mi |
| 1579 Bayshore Blvd Dunedin, FL | 3.0 | 2.0 | 1040 | $3,500 | $3.37 | 10d | 1 | 0.65mi |
| 559 Chicago Ave Dunedin, FL | 3.0 | 2.0 | 1745 | $4,499 | $2.58 | 26d | 1 | 0.66mi |
| 350 President St Dunedin, FL | 2.0 | 1.0 | 1000 | $2,195 | $2.19 | 0d | 1 | 0.68mi |
| 1479 Ruth Rd Dunedin, FL | 2.0 | 2.0 | 1235 | $2,700 | $2.19 | 26d | 1 | 0.74mi |
| 841 Patricia Ave Dunedin, FL | 2.0 | 1.0–2.0 | 904 | $1,950 | $2.16 | 19d | 2 | 0.74mi |
| 1388 Robin Hood Ln Unit 1141-B Dunedin, FL | 2.0 | 1.0 | 1000 | $1,595 | $1.59 | 4d | 1 | 0.76mi |
| 1141 San Christopher Dr Apt B Dunedin, FL | 2.0 | 1.0 | 1000 | $1,595 | $1.59 | 4d | 1 | 0.76mi |
| 1525 Ruth Rd Dunedin, FL | 2.0 | 2.0 | 1379 | $3,200 | $2.32 | 6d | 1 | 0.78mi |
| 611 Lyndhurst St Dunedin, FL | 3.0 | 2.0 | 1080 | $1,995 | $1.85 | 0d | 1 | 0.81mi |
| 611 Lyndhurst St Dunedin, FL | 3.0 | 2.0 | 1080 | $1,995 | $1.85 | 6d | 1 | 0.81mi |
| 613 Lyndhurst St Dunedin, FL | 3.0 | 2.0 | 1080 | $1,995 | $1.85 | 13d | 1 | 0.81mi |
| 613 Lyndhurst St Dunedin, FL | 3.0 | 2.0 | 1080 | $1,995 | $1.85 | 0d | 1 | 0.81mi |
| 920 Lakewood Dr Dunedin, FL | 3.0 | 2.0 | 1457 | $3,000 | $2.06 | 26d | 1 | 0.89mi |
| 660 Beltrees St Dunedin, FL | 1.0–3.0 | 1.0–1.5 | 905 | $1,645 | $1.82 | 10d | 2 | 0.91mi |
| 825 Lyndhurst St Dunedin, FL | 2.0 | 2.0 | 900 | $1,850 | $2.06 | 6d | 1 | 0.93mi |
| 825 Lyndhurst St Dunedin, FL | 2.0 | 2.0 | 900 | $1,850 | $2.06 | 26d | 1 | 0.93mi |
| 857 Lyndhurst St Unit D Dunedin, FL | 2.0 | 2.0 | 1050 | $1,700 | $1.62 | 20d | 1 | 0.97mi |
| 1849 San Mateo Dr Dunedin, FL | 3.0 | 1.0 | 1128 | $2,800 | $2.48 | 20d | 1 | 1.02mi |
| 257 Milwaukee Ave Dunedin, FL | 1.0–2.0 | 1.0–1.5 | 889 | $1,460 | $1.64 | 0d | 8 | 1.06mi |
| 253 Park Cir S Dunedin, FL | 3.0 | 2.0 | 1500 | $4,500 | $3.00 | 6d | 1 | 1.10mi |
| 978 Cedarwood Ave Dunedin, FL | 2.0 | 1.0 | 1100 | $1,800 | $1.64 | 26d | 1 | 1.19mi |
| 2701 Dunedin Commons Pl Dunedin, FL | 1.0–2.0 | 1.0–2.0 | 932 | $3,250 | $3.49 | 0d | 13 | 1.24mi |
| 541 Roanoke St Dunedin, FL | 2.0 | 2.0 | 912 | $2,345 | $2.57 | 16d | 1 | 1.25mi |
| 53 Highland Ave Dunedin, FL | 2.0 | 1.0 | 1128 | $1,800 | $1.60 | 4d | 1 | 1.31mi |
| 21 Highland Ave Dunedin, FL | 3.0 | 2.0 | 1160 | $2,700 | $2.33 | 26d | 1 | 1.37mi |
| 2005 McMullen Ave Dunedin, FL | 2.0 | 2.0 | 1350 | $2,595 | $1.92 | 26d | 1 | 1.40mi |
| 2011 McMullen Ave Dunedin, FL | 2.0 | 2.0 | 1300 | $2,395 | $1.84 | 4d | 1 | 1.42mi |
| 2015 McMullen Ave Dunedin, FL | 2.0 | 2.0 | 1300 | $2,295 | $1.77 | 26d | 1 | 1.43mi |
| 662 Union St Unit 1A Dunedin, FL | 3.0 | 1.0 | 1100 | $1,749 | $1.59 | 24d | 1 | 1.43mi |
| 526 Belmist Ct Dunedin, FL | 3.0 | 2.0 | 1480 | $2,700 | $1.82 | 26d | 1 | 1.44mi |
| 2019 McMullen Ave Dunedin, FL | 2.0 | 2.0 | 1300 | $2,295 | $1.77 | 20d | 1 | 1.44mi |
| 2013 Woodward Ave Dunedin, FL | 2.0 | 2.0 | 1405 | $2,400 | $1.71 | 26d | 1 | 1.45mi |
| 2021 Valley Dr Dunedin, FL | 3.0 | 2.0 | 1445 | $4,500 | $3.11 | 26d | 1 | 1.48mi |
HOA detail
- Monthly dues
- $500 · $6,000/yr
Listing history 4 events
-
2026-05-31status $244,573 Pending 58 DOM
-
2026-05-06price $244,573
-
2026-05-01price $299,950
-
2026-04-01$329,950 Active
ⓘ Source: listings_history table (triggers on properties + properties_extension) + one-shot
backfill from property_details.listing_events for pre-trigger history.
Tax reassessment forecast FL · Resets to sale price
- Current annual tax
- $2,371 · $198/mo
- Projected year-2 tax
- $2,371 · $198/mo
- Expected delta
- $0/yr ($0/mo · 0.0%)
ⓘ Screening estimate from a state-policy table — verify with the county assessor before closing.
Climate risk First Street
- Flood 3/10 Moderate FEMA zone X (unshaded) · 12% chance over 30 yrs
- Wildfire 1/10 Low
- Heat 10/10 Extreme 7 d/yr ≥107°F today · 26 d/yr by 30 yrs out
- Wind 10/10 Extreme 99% chance of damaging wind over 30 yrs
- Air quality 3/10 Moderate 2 unhealthy d/yr today · 3 by 30 yrs out
Nearby sold comps map
Loading sold comps map…
Walkable amenities ~0.75 mi
Loading nearby amenities…
Taxation est. · year 1
- Rental income
- $33,140
- − Mortgage interest
- −$13,700
- − Property taxes
- −$2,371
- − Insurance
- −$1,223
- − Repairs & maintenance
- −$2,651
- − Management
- −$2,651
- − HOA
- −$6,000
- − Depreciation
- −$7,115
- Taxable loss
- −$2,571
- Est. tax savings @ 24.0%
- +$617
- After-tax cash flow
- $1,813/yr
For passive investors: Depreciation is non-cash, so a rental often shows a tax loss while cash-flowing — sheltering income. Rental losses are passive: they offset passive income freely, and up to $25,000/yr can offset ordinary (W-2) income if you actively participate and your MAGI is under $100k (phasing out to $0 by $150k); unused losses carry forward. On sale, claimed depreciation is recaptured at up to 25%, and gains may owe capital-gains tax (a 1031 exchange can defer both). Figures are a year-1 estimate at your 24.0% rate — not tax advice; consult a CPA.
Schools (NCES district)
- District
- Pinellas
- NCES district ID
- 1201560
- Math proficiency
- 51% ▼ -5.00%
- Reading proficiency
- 51% ▼ -3.00%
- Median HH income
- $46,270
- Composite
- 43.27/100
- National rank
- #3046
- State rank
- #31 of 73 in FL
Livability — Dunedin
- Score
- 86/100
- State rank
- #15
- US rank
- #411
Category grades
Schools grade is shown separately in the Schools card above.
Census & demographics
- Census place
- Dunedin, FL
- County
- Pinellas County · 939,478 people
- City population
- 38,171
- Metro
- Tampa-St. Petersburg-Clearwater, FL
- Population (ZIP)
- 38,171
- Household income
- $74,078
- Rent vs Own
- Severe rent burden
- 1390.0
Population outlook (Pinellas County) Hauer SSP2
- Today (2025)
- 1,027,532 people
- By 2030
- 1,063,586 · +3.5%
- By 2040
- 1,125,020 · +9.5%
- By 2050
- 1,168,637 · +13.7%
- By 2075
- 1,265,188 · +23.1%
- By 2100
- 1,260,357 · +22.7%
Race, ethnicity, and origin ACS 2023
- Neighborhood character
- Predominantly White (83%)
- Race & ethnicity
- White 83% Two or more races 7% Hispanic / Latino 6% Black 5% Asian 1%
- Hispanic origin (detail)
- Mexican 2% Puerto Rican 2%
- Common ancestry
- Lithuanian 4% Slovak 3% Romanian 3%
- Foreign-born
- 8% · Canada, South Korea
- Languages at home
- 92% English-only · Spanish 3% Other Indo-European 2% Russian/Polish/Slavic 1%
Political lean MEDSL · Pinellas
- 2024 margin
- Lean R (+5.2) · D 46.9% · R 52.1%
- 2008→2024 swing
- -13.5pp toward R · 2008: 8.3pp · 2024: -5.2pp
- All cycles
- 2024: R+5.2 2020: D+0.2 2016: R+1.1 2012: D+5.6 2008: D+8.3
Not yet ingested
- Civics
- —
Market trends
- HPI YoY
- ▼ -515.66%
- Current HPI
- 387.4694
- Rent YoY
- ▲ 2.69%
- Metro
- Tampa-St. Petersburg-Clearwater, FL
- State GDP YoY
- ▲ 3.28%
- F500 in state
- 36
Industry mix (Fortune 500 HQ in FL)
| Industry | F500 HQs | Revenue |
|---|---|---|
| Industrial Technology | 2 | $29B |
|
||
| Insurance | 2 | $17B |
|
||
| Retail | 1 | $60B |
|
||
| Technology Distribution | 1 | $58B |
|
||
| Homebuilding | 1 | $35B |
|
||
| Technology Manufacturing | 1 | $35B |
|
||
Price history
-25.9% since first listed3 events — show timeline
- 2026-05-06 Price Changed $244,573 Stellar MLS as Distributed by MLS Grid
- 2026-05-01 Price Changed $299,950 Stellar MLS as Distributed by MLS Grid
- 2026-04-01 Listed $329,950 Stellar MLS as Distributed by MLS Grid
Property tax history
+23.1%/yrLatest (2025): $2,371 · +6.3% YoY. Source: county tax records.
Cash-flow waterfall
monthlySold comps — $/sqft
last 12 mo · ≤1 miLoading sold comps…