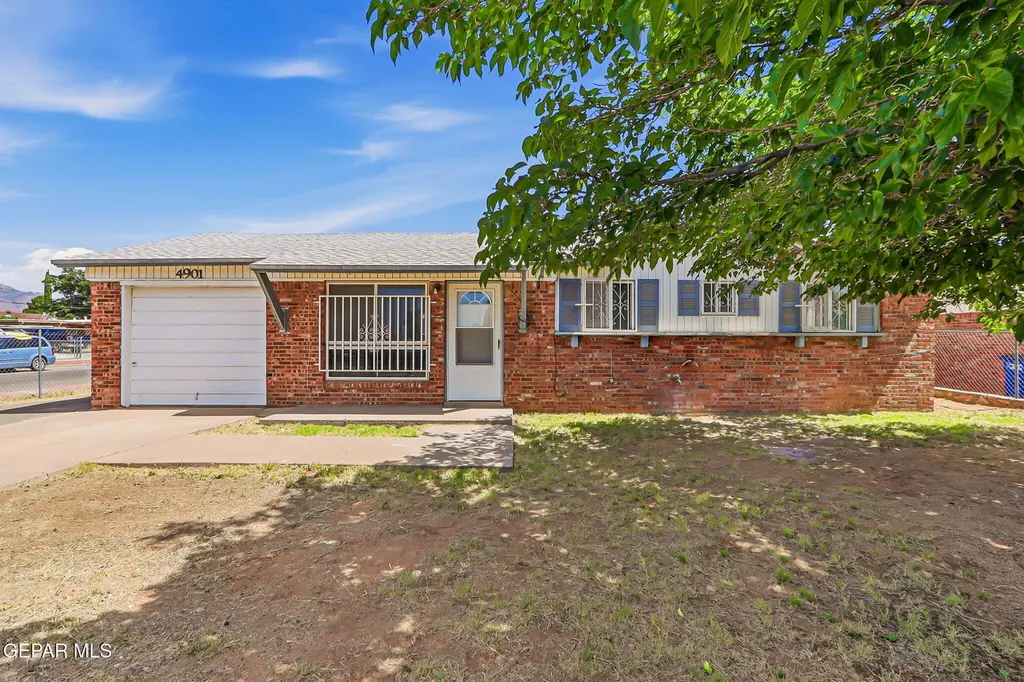
4901 Debeers Dr · El Paso, TX
Flood risk 1/10 · Minimal
- FEMA flood zone
- X
- Chance of flooding over 30 yrs
- 0.0%
- Est. flood insurance / yr
- $507 – $1,088
Fire risk 4/10 · Minor
- Est. fire insurance / yr
- $1,222 – $2,270
Heat risk 6/10 · Moderate
- Hot days now (above 100°F)
- 8 days/yr
- Hot days in 30 yrs
- 29 days/yr
Wind risk 1/10 · Minimal
- Chance of severe wind over 30 yrs
- —
Air-quality risk 3/10 · Minor
- Unhealthy air days now
- 2 days/yr
- Unhealthy air days in 30 yrs
- 2 days/yr
Risk factors via First Street. Map © Google.
Why this score? — see what drove the D grade
The composite is a weighted blend of 9 inputs, each scored 0–100. Each bar is that input's sub-score; the figure is the points it added to the 100-point composite (weight × sub-score).
- Cash flow +12.4/30.0
- ARV discount +7.5/15.0
- 1% rule +4.4/10.0
- Livability +4.0/5.0
- DSCR +3.7/10.0
- Rent growth +3.6/5.0
- Schools +2.7/10.0
- Condition / age +2.5/5.0
- Appreciation +0.0/10.0
$155,000
🖨 Deal sheet 📄 Offer letter ✓ Due diligence
Listing remarks
Take a look at this single level home sitting on a fully gated, spacious corner lot with beautiful mountain views. The front yard features a majestic shade tree enhancing the home's curb appeal. This home offers a good location with quick access to Loop 375, US 54 and is within walking distance to Arlington Park. It is a brick home with an all pitched shingle roof and a master cool evaporative air conditioner. This home has three bedrooms with one and a half bathrooms. The primary bedroom has its own half bath. The carpet in the bedrooms was recently replaced. The living room and kitchen features ceramic tile flooring. The home also has an attached single car garage and offers additional sp
Key facts
- Pitched shingle roof
- Gated corner lot
- Brick home
Tags
Property features AI
Finance
- Other: Lot approximately 0.16 acres (about 6,955 sq ft)
Exterior
- Home design: Single family residence; Pitched shingle roof; Brick and frame construction
- Construction: Brick and frame construction; Pitched shingle roof; Total building area approximately 925
- Exterior features: Walled backyard with back yard access; Fenced yard; Open patio/porch
Interior
- Kitchen: Free-standing gas oven; Gas cooktop
- Flooring: Tile flooring; Carpet flooring
- Bathrooms: 1 full bathroom; 1 half bathroom
- Heating & cooling: Central heating; Evaporative cooling
- Interior features: Ceiling fans; Single pane and double pane windows
Neighborhood map
What this means for you Summary
Snapshot
- This is a 3-bed/1.5-bath single-family listed at $155k.
Deal economics
- At list price, monthly cash flow is $-24 ($-294/yr) — negative.
- To cash-flow at today's rent, offer at most $151k (2.8% below list).
- To meet the 1% rule (rent ≥ 1% of price), the offer needs to be $146k (5.7% below list).
- Recommended offer: $146k (5.7% below list) — sets the bar for 1% rule.
Location & tenants
- Location reads 81/100 on livability (#23 in TX, #1,375 nationally) — a professional / high-income tenant draw. Strengths: commute A+, cost of living A+, housing A+; Watch: employment D+.
- El Paso ISD (urban): math 27% / reading 37% proficiency, ranked #591 of 826 in TX (top 72%) — families likely to look elsewhere, expect single-tenant / working-renter base with shorter leases; 65% free/reduced lunch — lower-income household profile, screen leases tightly.
- Zoned schools: Andress H S (math 19% / reading 34%, grade F, #1,228 of 1,632 statewide, top 76%, 1,530 students, 83% FRL) — zoned schools average 83% FRL vs 65% district-wide (18 pts higher); higher-poverty schools than district average — tighter screening recommended.
- Market conditions: Rents rising fast (+4.5%/yr); 241 active listings in the ZIP; 7 comparable units currently listed for rent nearby; rentals at typical pace (median 24d on market — plan ~3-4 weeks tenant-placement turnaround); 43% of comp listings sitting > 30 days — soft ceiling on asking rent; 2,196 units permitted in El Paso County in 2024 (143 in 5+ unit buildings).
- This rent runs 31% of the median local income ($57k/yr) — at the standard rent-burdened threshold; future hikes will face affordability resistance.
Forward outlook
- Local home prices are declining (-3.0%/yr); year-one equity from $1k of loan paydown is wiped out by about $5k of value loss. Plan a longer hold.
- El Paso County population projected at +10% by 2050 — modest demand growth; plan on rents tracking national, not racing it.
Negotiation context
- Only 6 days on market — expect competitive offers; lowballing is unlikely to land.
Risks & watch-outs
- Climate carrying-cost: extreme-heat days projected 8→29/yr by 2055 (HVAC capex compounding) — expect insurance premiums to compound above CPI over the hold.
Questions for the listing agent
- What do current leases actually rent for vs. the listed asking? Can we see a recent rent roll and the last 12 months of T-12 income?
- Built in 1960 — when were the roof, HVAC, electrical panel, plumbing, and water heater last replaced?
- Is there a deadline driving the sale (1031 exchange, divorce, estate, relocation)? That informs how much negotiation room exists.
- Schools are B-rated — typically a magnet for longer-tenancy family renters. What's the average tenant stay here, and is there a school-zone premium baked into asking?
- The area grade is low — what's the realistic commute time and amenity access for the typical tenant pool here? Any planned neighborhood developments (good or bad) we should know about?
- What's the average days-on-market for RENTAL listings here right now (not sales)? A rising rental-DOM trend means longer vacancies and softer asking-rent achievability than the comps imply.
- What's the recent tenant-quality profile in this submarket — average credit score on applications, eviction rate, late-payment / NSF rate, and stable-employment percentage? A property-management company in the area should have these aggregated.
- How much new for-sale + rental construction is in the pipeline within 1–3 miles? Heavy new supply typically softens prices + rents 12–24 months out; constrained supply supports both.
Investment metrics
- 1% rule
- 0.94% ✗
- Cap rate
- 6.10%
- Cash-on-cash
- -0.68%
- DSCR
- 0.97
- GRM
- 8.8
CMA / ARV
No comps found within radius.
Projected returns pro-forma
-3.0% appreciation · 4.5% rent growth · sell at horizon
- IRR
- -15.5%
- Equity multiple
- 0.44×
- Total profit
- $-24,349
- Equity at exit
- $23,111
- IRR
- -4.4%
- Equity multiple
- 0.69×
- Total profit
- $-13,376
- Equity at exit
- $13,402
Cash invested: $43,400 (down + closing). Projections, not guarantees.
Landlord ↔ Tenant lean methodology
- Overall (STATE)
- 87 Strongly Landlord-Friendly
- State Texas
- 87 Strongly Landlord-Friendly · R+5
- County
- — inherits STATE
- City
- — inherits STATE
ZIP-level market 79924
- Home prices YoY
- -13.2%
- Rents YoY
- 4.5%
- Active inventory
- 241
- Price-to-rent
- 8.8×
Monthly cashflow live
- Estimated rent
- $1,462 high interval (Pro) →
- Mortgage (P&I)
- −$813
- Tax from tax record
- −$302 /mo · $3,626/yr
- Insurance
- −$65
- HOA
- −$0
- Vacancy / Maint / Mgmt
- −$307
- Net cashflow
- $-24
Break-even live
UW: 25.0% down · 7.5% · 30yr · 1.5% tax · 5.0% vac · 8.0% maint · 8.0% mgmt
Financing live
Cash to close
- Down payment
- $38,750
- Closing costs
- $4,650
- Reserves months
- —
- Total cash needed
- —
Loan-product check · same deal, 3 products live
Conventional
25% down · 7.5% · 30yr
- Down + closing
- —
- Monthly P&I
- —
- Monthly cashflow
- —
- DSCR
- —
- Eligible?
- —
Personal DTI + credit; lowest rate.
DSCR
20% down · 8.5% · 30yr
- Down + closing
- —
- Monthly P&I
- —
- Monthly cashflow
- —
- DSCR
- —
- Eligible?
- —
No personal income docs; deal must DSCR.
Hard money
10% down · 12.0% · 12mo
- Down + closing
- —
- Monthly P&I
- —
- Monthly cashflow
- —
- DSCR
- —
- Eligible?
- —
Short-term bridge; refi at stabilization.
Rent comps 7 comps
| Address | Beds | Baths | Sqft | Rent | $/sqft | DOM | Units | Dist |
|---|---|---|---|---|---|---|---|---|
| 4917 Royal Dr El Paso, TX | 3.0 | 2.0 | 1034 | $1,425 | $1.38 | 23d | 1 | 0.08mi |
| 5140 Tropicana Ave El Paso, TX | 3.0 | 1.0 | 998 | $1,100 | $1.10 | 11d | 1 | 0.53mi |
| 5140 Tropicana Ave El Paso, TX | 3.0 | 1.0 | 998 | $1,050 | $1.05 | 2d | 1 | 0.53mi |
| 10452 Persephone Dr El Paso, TX | 3.0 | 2.0 | 1014 | $1,250 | $1.23 | 14d | 1 | 0.58mi |
| 10037 Oakwood Dr El Paso, TX | 3.0 | 1.5 | 1039 | $1,200 | $1.15 | 43d | 1 | 0.65mi |
| 5732 Arrowhead Dr El Paso, TX | 3.0 | 1.0 | 957 | $1,175 | $1.23 | 43d | 1 | 1.27mi |
| 5741 Arrowhead Dr El Paso, TX | 3.0 | 2.0 | 1080 | $1,175 | $1.09 | 43d | 1 | 1.30mi |
Listing history 6 events
-
2026-06-18days on market $155,000 Active 6 DOM
-
2026-06-17days on market $155,000 Active 5 DOM
-
2026-06-16days on market $155,000 Active 4 DOM
-
2026-06-15days on market $155,000 Active 3 DOM
-
2026-06-13remarks 699-char remark
-
2026-06-13$155,000 Active 1 DOM
ⓘ Source: listings_history table (triggers on properties + properties_extension) + one-shot
backfill from property_details.listing_events for pre-trigger history.
Tax reassessment forecast TX · Resets to sale price
- Current annual tax
- $3,626 · $302/mo
- Projected year-2 tax
- $3,626 · $302/mo
- Expected delta
- $0/yr ($0/mo · 0.0%)
ⓘ Screening estimate from a state-policy table — verify with the county assessor before closing.
Climate risk First Street
- Flood 1/10 Low FEMA zone X · 0% chance over 30 yrs
- Wildfire 4/10 Moderate
- Heat 6/10 Major 8 d/yr ≥100°F today · 29 d/yr by 30 yrs out
- Wind 1/10 Low
- Air quality 3/10 Moderate 2 unhealthy d/yr today · 2 by 30 yrs out
Nearby sold comps map
Loading sold comps map…
Walkable amenities ~0.75 mi
Loading nearby amenities…
Taxation est. · year 1
- Rental income
- $17,545
- − Mortgage interest
- −$8,682
- − Property taxes
- −$3,626
- − Insurance
- −$775
- − Repairs & maintenance
- −$1,404
- − Management
- −$1,404
- − Depreciation
- −$4,509
- Taxable loss
- −$2,854
- Est. tax savings @ 24.0%
- +$685
- After-tax cash flow
- $391/yr
For passive investors: Depreciation is non-cash, so a rental often shows a tax loss while cash-flowing — sheltering income. Rental losses are passive: they offset passive income freely, and up to $25,000/yr can offset ordinary (W-2) income if you actively participate and your MAGI is under $100k (phasing out to $0 by $150k); unused losses carry forward. On sale, claimed depreciation is recaptured at up to 25%, and gains may owe capital-gains tax (a 1031 exchange can defer both). Figures are a year-1 estimate at your 24.0% rate — not tax advice; consult a CPA.
Schools (NCES district)
- District
- El Paso ISD
- NCES district ID
- 4818300
- Math proficiency
- 27% ▼ -24.00%
- Reading proficiency
- 37% ▼ -7.00%
- Median HH income
- $38,704
- Composite
- 26.75/100
- National rank
- #7138
- State rank
- #591 of 826 in TX
Livability — El Paso
- Score
- 81/100
- State rank
- #23
- US rank
- #1375
Category grades
Schools grade is shown separately in the Schools card above.
Census & demographics
- Census place
- El Paso, TX
- County
- El Paso County · 761,266 people
- City population
- 630,223
- Metro
- El Paso, TX
- Population (ZIP)
- 60,364
- Household income
- $56,976
- Rent vs Own
- Severe rent burden
- 1903.0
Population outlook (El Paso County) Hauer SSP2
- Today (2025)
- 897,899 people
- By 2030
- 922,694 · +2.8%
- By 2040
- 960,492 · +7.0%
- By 2050
- 982,919 · +9.5%
- By 2075
- 997,266 · +11.1%
- By 2100
- 900,630 · +0.3%
Race, ethnicity, and origin ACS 2023
- Neighborhood character
- Predominantly Hispanic (72%)
- Race & ethnicity
- Hispanic / Latino 72% Two or more races 35% White 16% Black 7% Asian 1% Native American 1%
- Hispanic origin (detail)
- Mexican 66% Puerto Rican 2%
- Common ancestry
- Lithuanian 1% Italian 1% Romanian 1%
- Foreign-born
- 19% · Canada, South Korea
- Languages at home
- 42% English-only · Spanish 56% German/W. Germanic 1% Korean 1%
Political lean MEDSL · El Paso
- 2024 margin
- D (+15.1) · D 57.0% · R 41.8% · Other 1.2%
- 2008→2024 swing
- -17.4pp toward R · 2008: 32.5pp · 2024: 15.1pp
- All cycles
- 2024: D+15.1 2020: D+35.1 2016: D+43.2 2012: D+32.6 2008: D+32.5
Not yet ingested
- Civics
- —
Market trends
- HPI YoY
- ▼ -40.46%
- Current HPI
- 265.8729
- Rent YoY
- ▲ 4.50%
- Metro
- El Paso, TX
- State GDP YoY
- ▲ 3.95%
- F500 in state
- 110
Industry mix (Fortune 500 HQ in TX)
| Industry | F500 HQs | Revenue |
|---|---|---|
| Energy | 16 | $1,198B |
|
||
| Technology | 5 | $198B |
|
||
| Engineering / Construction | 4 | $72B |
|
||
| Energy Services | 3 | $60B |
|
||
| Utilities | 3 | $41B |
|
||
| Healthcare | 2 | $330B |
|
||
Price history
2 events — show timeline
- 2026-06-12 Listed $155,000 GEPARMLS
- 1980-03-01 Sold (Public Records) — Public Records
Property tax history
+6.3%/yrLatest (2025): $3,626 · +1.8% YoY. Source: county tax records.
Cash-flow waterfall
monthlySold comps — $/sqft
last 12 mo · ≤1 miLoading sold comps…