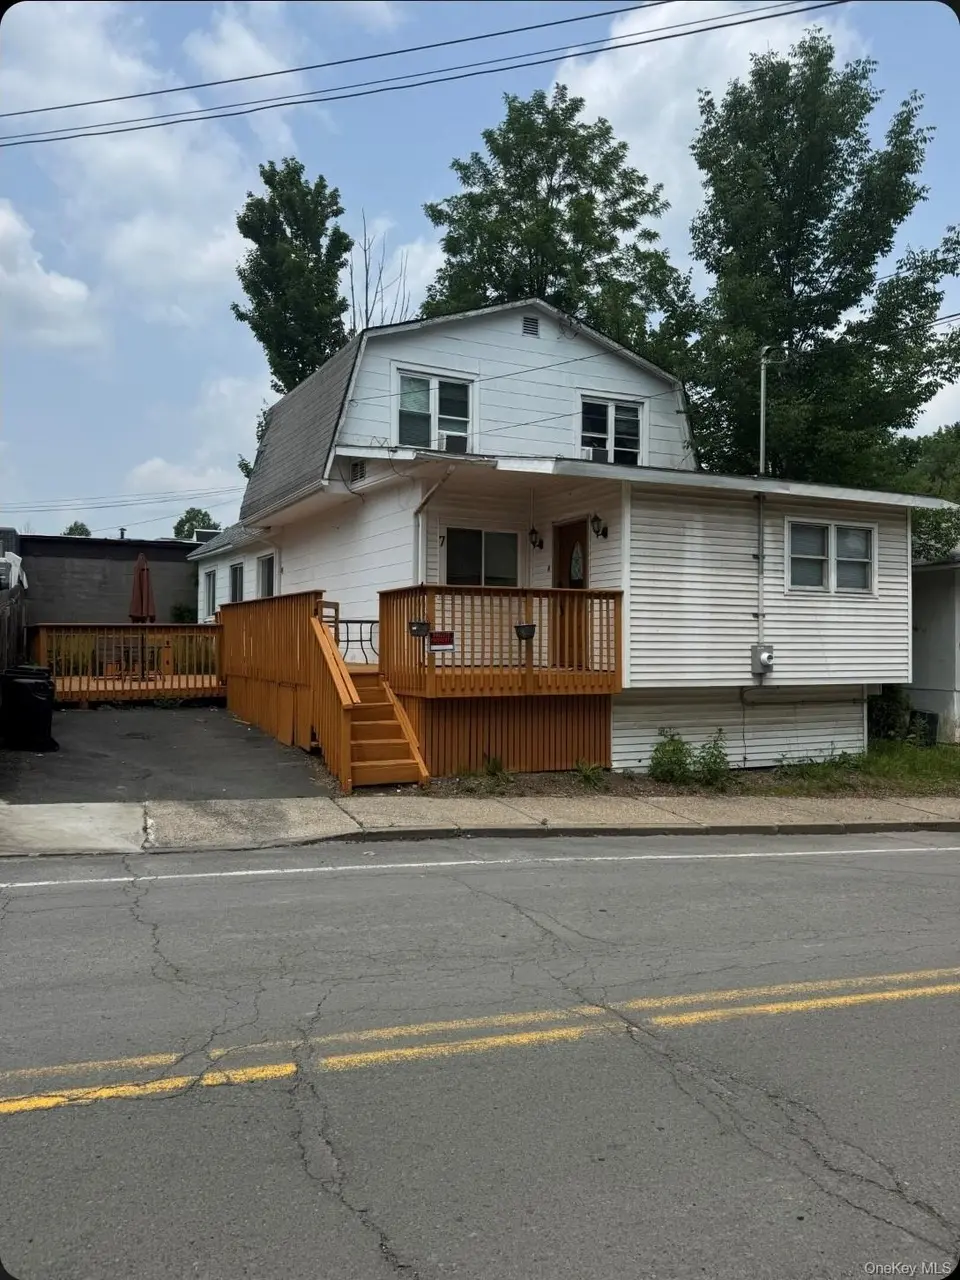
7 Dairyland Rd · Woodridge, NY
Flood risk 4/10 · Minor
- FEMA flood zone
- X (unshaded)
- Chance of flooding over 30 yrs
- 0.22%
- Est. flood insurance / yr
- $473 – $860
Fire risk 2/10 · Minimal
- Est. fire insurance / yr
- $691 – $1,283
Heat risk 3/10 · Minor
- Hot days now (above 92°F)
- 7 days/yr
- Hot days in 30 yrs
- 16 days/yr
Wind risk 3/10 · Minor
- Chance of severe wind over 30 yrs
- 7.0%
Air-quality risk 2/10 · Minimal
- Unhealthy air days now
- 1 days/yr
- Unhealthy air days in 30 yrs
- 1 days/yr
Risk factors via First Street. Map © Google.
Why this score? — see what drove the D grade
The composite is a weighted blend of 9 inputs, each scored 0–100. Each bar is that input's sub-score; the figure is the points it added to the 100-point composite (weight × sub-score).
- ARV discount +15.0/15.0
- Appreciation +10.0/10.0
- Cash flow +6.3/30.0
- Livability +3.1/5.0
- Rent growth +2.5/5.0
- Condition / age +2.5/5.0
- Schools +2.4/10.0
- 1% rule +1.2/10.0
- DSCR +0.6/10.0
$349,999
🖨 Deal sheet (PDF) 📄 Offer letter ✓ Due diligence
Listing remarks
Lovely house. Great for an investor or end user. Centrally located in the center of town. Its next to buisness area. Can be used for a buisness or professional office.
Key facts
- Centrally located
- Professional office
- 2,614 sq ft lot
Tags
Property features AI
Exterior
- Parking: Driveway; No carport
- Utilities: Public sewer; Electricity connected
- Home design: Single-family residence; Living area per public records: 1477
- Construction: Aluminum siding construction
- Exterior features: Aluminum siding; Not waterfront
Interior
- Kitchen: Cooktop; Electric cooktop; Electric range
- Bathrooms: Two full bathrooms; One half bathroom
- Heating & cooling: Baseboard heating; Wall/window air conditioning units
- Interior features: First-floor full bathroom; Seven total rooms
Neighborhood map
What this means for you Summary
Snapshot
- This is a 5-bed/2.0-bath single-family listed at $350k.
Deal economics
- At list price, monthly cash flow is $-628 ($-8k/yr) — negative.
- To cash-flow at today's rent, offer at most $239k (31.7% below list).
- To meet the 1% rule (rent ≥ 1% of price), the offer needs to be $218k (37.7% below list).
- Recommended offer: $218k (37.7% below list) — sets the bar for 1% rule.
Location & tenants
- Location reads 61/100 on livability (#934 in NY) — a middle-class / working-renter tenant base. Strengths: housing A+, employment B+, cost of living B+; Watch: crime F, amenities F, commute F.
- Fallsburg Central School District (town): math 29% / reading 27% proficiency, ranked #583 of 590 in NY (top 99%) — low school quality limits family demand, transient renter base, plan for 1-2y turnover.
- Zoned schools: Benjamin Cosor Elementary School (math 8% / reading 22%, grade F, #2,024 of 2,108 statewide, top 97%, 810 students, 72% FRL); Fallsburg Junior Senior High School (math 52% / reading 32%, grade F, #1,046 of 1,100 statewide, top 96%, 684 students, 64% FRL).
- Market conditions: 26 active listings in the ZIP; 739 units permitted in Sullivan County in 2024 (5 in 5+ unit buildings).
Forward outlook
- In year one you build about $37k of equity ($2k loan paydown + $35k appreciation (10.0% local appreciation)).
- Sullivan County population projected at -24% by 2050 — secular population decline; favor cash flow + early exit over multi-decade hold.
- By year 2, paydown + projected appreciation supports a ~$60k cash-out refi (75% LTV) — recoverable capital for the next deal without selling this one.
Negotiation context
- It's been on market 48 days — a 3% lower offer ($339k) is reasonable based on typical stale-listing flexibility.
- 3 sale attempts since 7y ago with the ask held roughly flat each time — persistent listings suggest the price (not the market) is what's stuck; bring a comps-based counter.
Risks & watch-outs
- Watch-outs: built in 1925 — expect roof / HVAC / electrical / plumbing capex.
Questions for the listing agent
- What do current leases actually rent for vs. the listed asking? Can we see a recent rent roll and the last 12 months of T-12 income?
- It's been on market 48 days. Have you received any prior offers? Is the seller open to a 38% concession, seller financing, or rate buy-down credit?
- Built in 1925 — when were the roof, HVAC, electrical panel, plumbing, and water heater last replaced?
- Is there a deadline driving the sale (1031 exchange, divorce, estate, relocation)? That informs how much negotiation room exists.
- Schools are F-rated, which usually means shorter tenancies and higher turnover. Who's the typical renter profile here, and what's been the actual vacancy rate?
- Crime grade is F in this area — have there been break-ins, vandalism, or insurance claims at this property in the last 3 years? What carrier currently insures it and at what premium?
- The area grade is low — what's the realistic commute time and amenity access for the typical tenant pool here? Any planned neighborhood developments (good or bad) we should know about?
- What's the average days-on-market for RENTAL listings here right now (not sales)? A rising rental-DOM trend means longer vacancies and softer asking-rent achievability than the comps imply.
- What's the recent tenant-quality profile in this submarket — average credit score on applications, eviction rate, late-payment / NSF rate, and stable-employment percentage? A property-management company in the area should have these aggregated.
- How much new for-sale + rental construction is in the pipeline within 1–3 miles? Heavy new supply typically softens prices + rents 12–24 months out; constrained supply supports both.
Investment metrics
- 1% rule
- 0.62% ✗
- Cap rate
- 4.14%
- Cash-on-cash
- -7.69%
- DSCR
- 0.66
- GRM
- 13.4
CMA / ARV
- ARV (median comp)
- $498,634
- List price
- $349,999
- Delta
- -29.81%
- Verdict
- UNDERPRICED
- Comps
- 4 within 1.0 mi
Show comp detail 1 sale within ~0.75 mi
| Address | Dist | Beds/Ba | Sqft | Sold | Price | $/sf | Match |
|---|---|---|---|---|---|---|---|
| 30 Diane Blvd | 0.41mi | 6/2.5 (+1) | 1,430 (-3%) | 24mo | $440,000 | $308 | 49 |
Match score weights: distance 35% · size 25% · config 20% · recency 20%. Top-matched comps best support the ARV.
Projected returns pro-forma
10.0% appreciation · 3.0% rent growth · sell at horizon
- IRR
- 18.9%
- Equity multiple
- 2.54×
- Total profit
- $150,607
- Equity at exit
- $315,307
- IRR
- 17.5%
- Equity multiple
- 5.85×
- Total profit
- $474,950
- Equity at exit
- $679,971
Cash invested: $98,000 (down + closing). Projections, not guarantees.
Landlord ↔ Tenant lean methodology
- Overall (STATE)
- 15 Strongly Tenant-Friendly
- State New York
- 15 Strongly Tenant-Friendly · D+10
- County
- — inherits STATE
- City
- — inherits STATE
ZIP-level market 12789
- Home prices YoY
- 2.4%
- Active inventory
- 26
- Price-to-rent
- 13.4×
Monthly cashflow live
- Estimated rent
- $2,179 medium interval (Pro) →
- Mortgage (P&I)
- −$1,835
- Tax from tax record
- −$368 /mo · $4,417/yr
- Insurance
- −$146
- HOA
- −$0
- Vacancy / Maint / Mgmt
- −$458
- Net cashflow
- $-628
Break-even live
Sensitivity live
| Price | -10% $-430 | -5% $-529 | +0% $-628 | +5% $-727 | +10% $-826 |
|---|---|---|---|---|---|
| Rent | -10% $-800 | -5% $-714 | +0% $-628 | +5% $-542 | +10% $-456 |
| Rate | -1.0pp $-452 | -0.5pp $-539 | base $-628 | +0.5pp $-719 | +1.0pp $-811 |
UW: 25.0% down · 7.5% · 30yr · 1.5% tax · 5.0% vac · 8.0% maint · 8.0% mgmt
Financing live
Cash to close
- Down payment
- $87,500
- Closing costs
- $10,500
- Reserves months
- —
- Total cash needed
- —
Loan-product check · same deal, 3 products live
Conventional
25% down · 7.5% · 30yr
- Down + closing
- —
- Monthly P&I
- —
- Monthly cashflow
- —
- DSCR
- —
- Eligible?
- —
Personal DTI + credit; lowest rate.
DSCR
20% down · 8.5% · 30yr
- Down + closing
- —
- Monthly P&I
- —
- Monthly cashflow
- —
- DSCR
- —
- Eligible?
- —
No personal income docs; deal must DSCR.
Hard money
10% down · 12.0% · 12mo
- Down + closing
- —
- Monthly P&I
- —
- Monthly cashflow
- —
- DSCR
- —
- Eligible?
- —
Short-term bridge; refi at stabilization.
Listing history 28 events
-
2026-06-21days on market $349,999 Active 48 DOM
-
2026-06-18days on market $349,999 Active 45 DOM
-
2026-06-17days on market $349,999 Active 44 DOM
-
2026-06-16days on market $349,999 Active 43 DOM
-
2026-06-15days on market $349,999 Active 42 DOM
-
2026-06-14days on market $349,999 Active 40 DOM
-
2026-06-13days on market $349,999 Active 39 DOM
-
2026-06-10days on market $349,999 Active 37 DOM
-
2026-06-09days on market $349,999 Active 36 DOM
-
2026-06-08days on market $349,999 Active 35 DOM
-
2026-06-07days on market $349,999 Active 34 DOM
-
2026-06-03days on market $349,999 Active 30 DOM
-
2026-06-02days on market $349,999 Active 29 DOM
-
2026-06-01days on market $349,999 Active 28 DOM
-
2026-05-31days on market $349,999 Active 27 DOM
-
2026-05-31days on market $349,999 Active 26 DOM
-
2026-05-04$349,999 Active 176-char remark
-
2025-09-17historical
-
2025-07-30price $369,999
-
2025-07-02price $379,999
-
2025-06-22price $399,999
-
2025-06-09$424,999 Active
-
2024-06-10soldstatus $354,000
-
2021-05-11soldstatus $145,000
-
2019-11-01historical
-
2019-08-14price $179,000
-
2019-05-24$219,000 Active
-
2017-09-20soldstatus $90,000
ⓘ Source: listings_history table (triggers on properties + properties_extension) + one-shot
backfill from property_details.listing_events for pre-trigger history.
Tax reassessment forecast NY · Partial reset (capped growth)
- Current annual tax
- $4,417 · $368/mo
- Projected year-2 tax
- $5,166 · $431/mo
- Expected delta
- +$749/yr (+$62/mo · 17.0%)
ⓘ Screening estimate from a state-policy table — verify with the county assessor before closing.
Climate risk First Street
- Flood 4/10 Moderate FEMA zone X (unshaded) · 22% chance over 30 yrs
- Wildfire 2/10 Low
- Heat 3/10 Moderate 7 d/yr ≥92°F today · 16 d/yr by 30 yrs out
- Wind 3/10 Moderate 7% chance of damaging wind over 30 yrs
- Air quality 2/10 Low 1 unhealthy d/yr today · 1 by 30 yrs out
Nearby sold comps map
Loading sold comps map…
Walkable amenities ~0.75 mi
Loading nearby amenities…
Taxation est. · year 1
- Rental income
- $26,146
- − Mortgage interest
- −$19,605
- − Property taxes
- −$4,417
- − Insurance
- −$1,750
- − Repairs & maintenance
- −$2,092
- − Management
- −$2,092
- − Depreciation
- −$10,182
- Taxable loss
- −$13,992
- Est. tax savings @ 24.0%
- +$3,358
- After-tax cash flow
- $-4,179/yr
For passive investors: Depreciation is non-cash, so a rental often shows a tax loss while cash-flowing — sheltering income. Rental losses are passive: they offset passive income freely, and up to $25,000/yr can offset ordinary (W-2) income if you actively participate and your MAGI is under $100k (phasing out to $0 by $150k); unused losses carry forward. On sale, claimed depreciation is recaptured at up to 25%, and gains may owe capital-gains tax (a 1031 exchange can defer both). Figures are a year-1 estimate at your 24.0% rate — not tax advice; consult a CPA.
Schools (NCES district)
- District
- Fallsburg Central School District
- NCES district ID
- 3610950
- Math proficiency
- 29% ▼ -3.00%
- Reading proficiency
- 27% ▬ 0.00%
- Median HH income
- $42,513
- Composite
- 23.84/100
- National rank
- #7805
- State rank
- #583 of 590 in NY
Livability — Woodridge
- Score
- 61/100
- State rank
- #934
- US rank
- #18167
Category grades
Schools grade is shown separately in the Schools card above.
Census & demographics
- Census place
- Woodridge, NY
- City population
- 2,654
- Population (ZIP)
- 2,654
Population outlook (Sullivan County) Hauer SSP2
- Today (2025)
- 68,974 people
- By 2030
- 65,609 · -4.9%
- By 2040
- 58,878 · -14.6%
- By 2050
- 52,500 · -23.9%
- By 2075
- 39,941 · -42.1%
- By 2100
- 28,880 · -58.1%
Race, ethnicity, and origin ACS 2023
- Neighborhood character
- Diverse neighborhood (Simpson 0.63)
- Race & ethnicity
- White 53% Hispanic / Latino 28% Two or more races 25% Black 5% Asian 5%
- Hispanic origin (detail)
- Mexican 1% Puerto Rican 20%
- Common ancestry
- Lithuanian 6% Scotch-Irish 2% Romanian 2%
- Foreign-born
- 10% · Canada, China
- Languages at home
- 63% English-only · Spanish 22% Chinese 5% Other Indo-European 5%
Political lean MEDSL · Sullivan
- 2024 margin
- R (+16.7) · D 41.6% · R 58.4%
- 2008→2024 swing
- -26.2pp toward R · 2008: 9.5pp · 2024: -16.7pp
- All cycles
- 2024: R+16.7 2020: R+9.2 2016: R+13.7 2012: D+10.4 2008: D+9.5
Not yet ingested
- Civics
- —
Market trends
- HPI YoY
- ▲ 10.65%
- Current HPI
- 455.1244
- Rent YoY
- —
- Metro
- —
- State GDP YoY
- ▲ 2.60%
- F500 in state
- 92
Industry mix (Fortune 500 HQ in NY)
| Industry | F500 HQs | Revenue |
|---|---|---|
| Financial Services | 10 | $950B |
|
||
| Consumer Goods | 9 | $162B |
|
||
| Insurance | 4 | $225B |
|
||
| Telecommunications | 2 | $144B |
|
||
| Pharmaceuticals | 2 | $112B |
|
||
| Media / Entertainment | 2 | $69B |
|
||
Price history
+288.9% since first listed12 events — show timeline
- 2026-05-04 Listed $349,999 OneKey® MLS as Distributed by MLS Grid
- 2025-09-17 Listing Removed — OneKey® MLS as Distributed by MLS Grid
- 2025-07-30 Price Changed $369,999 OneKey® MLS as Distributed by MLS Grid
- 2025-07-02 Price Changed $379,999 OneKey® MLS as Distributed by MLS Grid
- 2025-06-22 Price Changed $399,999 OneKey® MLS as Distributed by MLS Grid
- 2025-06-09 Listed $424,999 OneKey® MLS as Distributed by MLS Grid
- 2024-06-10 Sold (Public Records) $354,000 Public Records
- 2021-05-11 Sold (Public Records) $145,000 Public Records
- 2019-11-01 Listing Removed — OneKey® MLS as Distributed by MLS Grid
- 2019-08-14 Price Changed $179,000 OneKey® MLS as Distributed by MLS Grid
- 2019-05-24 Listed $219,000 OneKey® MLS as Distributed by MLS Grid
- 2017-09-20 Sold (Public Records) $90,000 Public Records
Property tax history
-1.3%/yrLatest (2025): $4,417 · +1.5% YoY. Source: county tax records.
Cash-flow waterfall
monthlySold comps — $/sqft
last 12 mo · ≤1 miLoading sold comps…