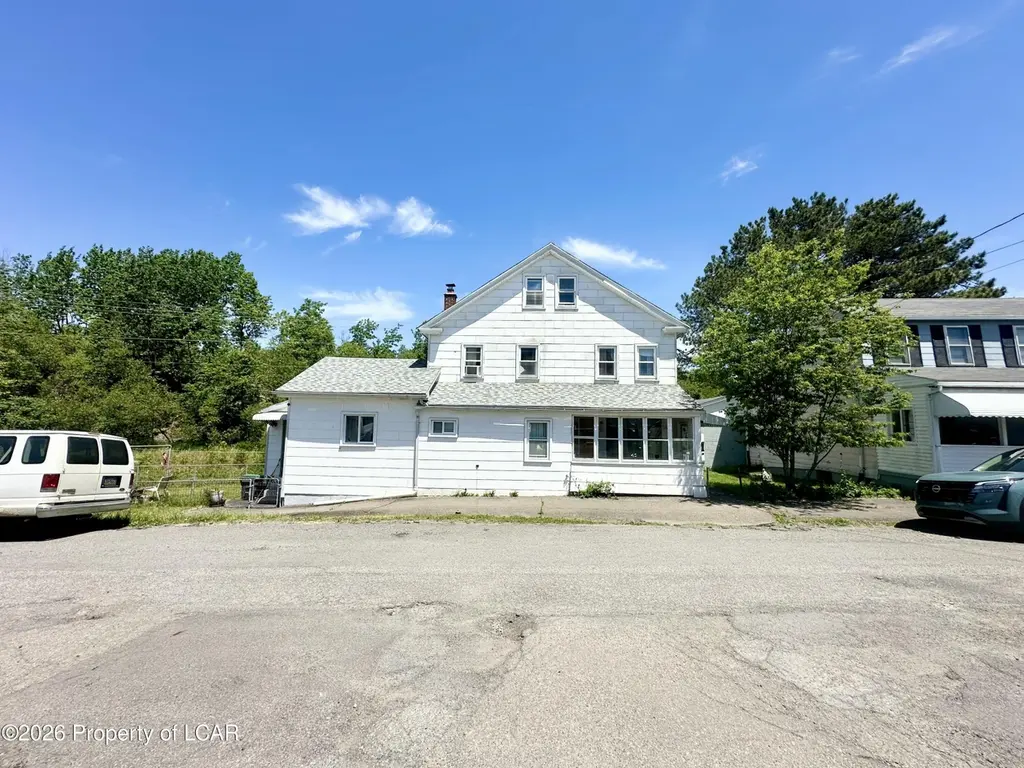
153 Grant St · McAdoo, PA
Flood risk 4/10 · Minor
- FEMA flood zone
- X (unshaded)
- Chance of flooding over 30 yrs
- 0.24%
- Est. flood insurance / yr
- $473 – $860
Fire risk 4/10 · Minor
- Est. fire insurance / yr
- $511 – $949
Heat risk 2/10 · Minimal
- Hot days now (above 91°F)
- 7 days/yr
- Hot days in 30 yrs
- 15 days/yr
Wind risk 4/10 · Minor
- Chance of severe wind over 30 yrs
- 8.0%
Air-quality risk 2/10 · Minimal
- Unhealthy air days now
- 0 days/yr
- Unhealthy air days in 30 yrs
- 1 days/yr
Risk factors via First Street. Map © Google.
Why this score? — see what drove the D- grade
The composite is a weighted blend of 9 inputs, each scored 0–100. Each bar is that input's sub-score; the figure is the points it added to the 100-point composite (weight × sub-score).
- Appreciation +10.0/10.0
- Cash flow +8.3/30.0
- 1% rule +3.7/10.0
- Livability +3.5/5.0
- Rent growth +2.5/5.0
- Condition / age +2.5/5.0
- DSCR +2.3/10.0
- Schools +2.0/10.0
- ARV discount +1.1/15.0
$189,999
🖨 Deal sheet (PDF) 📄 Offer letter ✓ Due diligence
Listing remarks MLS
Great opportunity to own this affordable home. . The home has a 3 season porch, mud room, office, 3 BR potential and spacious first floor plus fenced in yard!
Key facts
- 3 garage spots
- Listed 12 days
Property features AI
Exterior
- Parking: Detached 3-car garage
- Utilities: Public water; Public sewer
- Home design: Single-family residence; Two levels; Residential zoning
- Construction: Asbestos construction material; Full unfinished basement
- Exterior features: Fenced yard
Interior
- Bathrooms: 1 full bathroom
- Heating & cooling: Oil heating; Baseboard heat
- Interior features: Eat-in kitchen; Dining room fireplace
Neighborhood map
What this means for you Summary
Snapshot
- This is a 3-bed/1.0-bath single-family listed at $190k.
Deal economics
- At list price, monthly cash flow is $-172 ($-2k/yr) — negative.
- To cash-flow at today's rent, offer at most $160k (16.0% below list).
- To meet the 1% rule (rent ≥ 1% of price), the offer needs to be $166k (12.7% below list).
- Recommended offer: $160k (16.0% below list) — sets the bar for cash-flow.
Location & tenants
- Location reads 69/100 on livability (#811 in PA) — a middle-class / working-renter tenant base. Strengths: crime A+, cost of living A+, health & safety A+; Watch: amenities F, commute F, employment F.
- Hazleton Area SD (suburban): math 18% / reading 30% proficiency, ranked #476 of 539 in PA (top 88%) — low school quality limits family demand, transient renter base, plan for 1-2y turnover.
- Zoned schools: Mcadoo-Kelayres El/Ms (math 2% / reading 27%, grade F, #1,323 of 1,518 statewide, top 89%, 839 students, 100% FRL); Hazleton Area Hs (math 53% / reading 8%, grade F, #347 of 437 statewide, top 79%, 3,795 students, 83% FRL) — zoned schools average 91% FRL vs 60% district-wide (32 pts higher); higher-poverty schools than district average — tighter screening recommended.
- Market conditions: 13 active listings in the ZIP; 169 units permitted in Schuylkill County in 2024 (0 in 5+ unit buildings).
Forward outlook
- In year one you build about $20k of equity ($1k loan paydown + $19k appreciation (10.0% local appreciation)).
- Schuylkill County population projected at -16% by 2050 — secular population decline; favor cash flow + early exit over multi-decade hold.
- By year 2, paydown + projected appreciation supports a ~$33k cash-out refi (75% LTV) — recoverable capital for the next deal without selling this one.
Negotiation context
- Only 13 days on market — expect competitive offers; lowballing is unlikely to land.
- 5 sale attempts since 5y ago with the ask held roughly flat each time — persistent listings suggest the price (not the market) is what's stuck; bring a comps-based counter.
- Current owner paid $135k; 41% above their basis — modest negotiation headroom, anchor on the comps not their cost.
Risks & watch-outs
- Watch-outs: property tax is 2.6% of price; built in 1900 — expect roof / HVAC / electrical / plumbing capex.
Questions for the listing agent
- What do current leases actually rent for vs. the listed asking? Can we see a recent rent roll and the last 12 months of T-12 income?
- Built in 1900 — when were the roof, HVAC, electrical panel, plumbing, and water heater last replaced?
- Property tax is high relative to price — has the assessment been appealed recently, and will the sale trigger a re-assessment?
- Is there a deadline driving the sale (1031 exchange, divorce, estate, relocation)? That informs how much negotiation room exists.
- Schools are F-rated, which usually means shorter tenancies and higher turnover. Who's the typical renter profile here, and what's been the actual vacancy rate?
- The area grade is low — what's the realistic commute time and amenity access for the typical tenant pool here? Any planned neighborhood developments (good or bad) we should know about?
- What's the average days-on-market for RENTAL listings here right now (not sales)? A rising rental-DOM trend means longer vacancies and softer asking-rent achievability than the comps imply.
- What's the recent tenant-quality profile in this submarket — average credit score on applications, eviction rate, late-payment / NSF rate, and stable-employment percentage? A property-management company in the area should have these aggregated.
- How much new for-sale + rental construction is in the pipeline within 1–3 miles? Heavy new supply typically softens prices + rents 12–24 months out; constrained supply supports both.
Investment metrics
- 1% rule
- 0.87% ✗
- Cap rate
- 5.20%
- Cash-on-cash
- -3.89%
- DSCR
- 0.83
- GRM
- 9.5
CMA / ARV
- ARV (on-the-fly)
- $166,284
- Comps found
- 12
Show comp detail 12 sales within ~0.75 mi
| Address | Dist | Beds/Ba | Sqft | Sold | Price | $/sf | Match |
|---|---|---|---|---|---|---|---|
| 129 Sheridan St | 0.32mi | 3/1.0 | 1,350 (+1%) | 6mo | $160,000 | $119 | 79 |
| 29 Sherman St | 0.25mi | 3/1.5 | 1,280 (-4%) | 12mo | $135,000 | $105 | 69 |
| 126 Blaine St | 0.15mi | 3/1.5 | 1,232 (-8%) | 13mo | $135,000 | $110 | 66 |
| 233 Rear Sherman Ct | 0.21mi | 4/1.0 (+1) | 1,245 (-7%) | 9mo | $155,000 | $124 | 66 |
| 19 Madison St | 0.59mi | 3/1.0 | 1,300 (-3%) | 6mo | $200,000 | $154 | 62 |
| 137 Jackson St | 0.30mi | 2/1.0 (-1) | 1,164 (-13%) | 0mo | $60,000 | $52 | 58 |
| 519 S Hancock St | 0.56mi | 4/2.0 (+1) | 1,392 (+4%) | 5mo | $235,000 | $169 | 55 |
| 44 Monroe St | 0.49mi | 3/1.5 | 1,485 (+11%) | 11mo | $145,000 | $98 | 48 |
| 415 Grant St | 0.47mi | 3/1.0 | 1,152 (-14%) | 10mo | $150,000 | $130 | 46 |
| 500 Blaine St | 0.53mi | 3/3.0 | 1,520 (+13%) | 2mo | $220,500 | $145 | 44 |
| 629 Hancock St | 0.65mi | 4/1.5 (+1) | 1,249 (-7%) | 10mo | $169,000 | $135 | 42 |
| 653 Hancock St | 0.71mi | 3/1.0 | 1,204 (-10%) | 10mo | $148,000 | $123 | 41 |
Match score weights: distance 35% · size 25% · config 20% · recency 20%. Top-matched comps best support the ARV.
Projected returns pro-forma
10.0% appreciation · 3.0% rent growth · sell at horizon
- IRR
- 21.5%
- Equity multiple
- 2.74×
- Total profit
- $92,622
- Equity at exit
- $171,166
- IRR
- 19.5%
- Equity multiple
- 6.29×
- Total profit
- $281,653
- Equity at exit
- $369,126
Cash invested: $53,200 (down + closing). Projections, not guarantees.
Landlord ↔ Tenant lean methodology
- Overall (STATE)
- 62 Landlord-Friendly
- State Pennsylvania
- 62 Landlord-Friendly · EVEN
- County
- — inherits STATE
- City
- — inherits STATE
ZIP-level market 18237
- Home prices YoY
- 14.9%
- Active inventory
- 13
- Price-to-rent
- 9.5×
Monthly cashflow live
- Estimated rent
- $1,659 medium interval (Pro) →
- Mortgage (P&I)
- −$996
- Tax from tax record
- −$407 /mo · $4,886/yr
- Insurance
- −$79
- HOA
- −$0
- Vacancy / Maint / Mgmt
- −$348
- Net cashflow
- $-172
Break-even live
Sensitivity live
| Price | -10% $-65 | -5% $-119 | +0% $-172 | +5% $-226 | +10% $-280 |
|---|---|---|---|---|---|
| Rent | -10% $-304 | -5% $-238 | +0% $-172 | +5% $-107 | +10% $-41 |
| Rate | -1.0pp $-77 | -0.5pp $-124 | base $-172 | +0.5pp $-222 | +1.0pp $-272 |
UW: 25.0% down · 7.5% · 30yr · 1.5% tax · 5.0% vac · 8.0% maint · 8.0% mgmt
Financing live
Cash to close
- Down payment
- $47,500
- Closing costs
- $5,700
- Reserves months
- —
- Total cash needed
- —
Loan-product check · same deal, 3 products live
Conventional
25% down · 7.5% · 30yr
- Down + closing
- —
- Monthly P&I
- —
- Monthly cashflow
- —
- DSCR
- —
- Eligible?
- —
Personal DTI + credit; lowest rate.
DSCR
20% down · 8.5% · 30yr
- Down + closing
- —
- Monthly P&I
- —
- Monthly cashflow
- —
- DSCR
- —
- Eligible?
- —
No personal income docs; deal must DSCR.
Hard money
10% down · 12.0% · 12mo
- Down + closing
- —
- Monthly P&I
- —
- Monthly cashflow
- —
- DSCR
- —
- Eligible?
- —
Short-term bridge; refi at stabilization.
Listing history 11 events
-
2026-06-19days on market $189,999 Active 13 DOM
-
2026-06-18days on market $189,999 Active 12 DOM
-
2026-06-17days on market $189,999 Active 11 DOM
-
2026-06-16days on market $189,999 Active 10 DOM
-
2026-06-15days on market $189,999 Active 9 DOM
-
2026-06-14days on market $189,999 Active 7 DOM
-
2026-06-12days on market $189,999 Active 6 DOM
-
2026-06-09days on market $189,999 Active 3 DOM
-
2026-06-08days on market $189,999 Active 2 DOM
-
2026-06-07remarks 132-char remark
-
2026-06-07$189,999 Active 1 DOM
ⓘ Source: listings_history table (triggers on properties + properties_extension) + one-shot
backfill from property_details.listing_events for pre-trigger history.
Tax reassessment forecast PA · Partial reset (capped growth)
- Current annual tax
- $4,886 · $407/mo
- Projected year-2 tax
- $4,886 · $407/mo
- Expected delta
- $0/yr ($0/mo · 0.0%)
ⓘ Screening estimate from a state-policy table — verify with the county assessor before closing.
Climate risk First Street
- Flood 4/10 Moderate FEMA zone X (unshaded) · 24% chance over 30 yrs
- Wildfire 4/10 Moderate
- Heat 2/10 Low 7 d/yr ≥91°F today · 15 d/yr by 30 yrs out
- Wind 4/10 Moderate 8% chance of damaging wind over 30 yrs
- Air quality 2/10 Low 0 unhealthy d/yr today · 1 by 30 yrs out
Nearby sold comps map
Loading sold comps map…
Walkable amenities ~0.75 mi
Loading nearby amenities…
Taxation est. · year 1
- Rental income
- $19,902
- − Mortgage interest
- −$10,643
- − Property taxes
- −$4,886
- − Insurance
- −$950
- − Repairs & maintenance
- −$1,592
- − Management
- −$1,592
- − Depreciation
- −$5,527
- Taxable loss
- −$5,288
- Est. tax savings @ 24.0%
- +$1,269
- After-tax cash flow
- $-801/yr
For passive investors: Depreciation is non-cash, so a rental often shows a tax loss while cash-flowing — sheltering income. Rental losses are passive: they offset passive income freely, and up to $25,000/yr can offset ordinary (W-2) income if you actively participate and your MAGI is under $100k (phasing out to $0 by $150k); unused losses carry forward. On sale, claimed depreciation is recaptured at up to 25%, and gains may owe capital-gains tax (a 1031 exchange can defer both). Figures are a year-1 estimate at your 24.0% rate — not tax advice; consult a CPA.
Schools (NCES district)
- District
- Hazleton Area SD
- NCES district ID
- 4211700
- Math proficiency
- 18% ▼ -3.00%
- Reading proficiency
- 30% ▼ -15.00%
- Median HH income
- $42,247
- Composite
- 20.44/100
- National rank
- #8582
- State rank
- #476 of 539 in PA
Livability — McAdoo
- Score
- 69/100
- State rank
- #811
- US rank
- #8252
Category grades
Schools grade is shown separately in the Schools card above.
Census & demographics
- Census place
- McAdoo, PA
- Population (ZIP)
- 3,808
Population outlook (Schuylkill County) Hauer SSP2
- Today (2025)
- 137,447 people
- By 2030
- 133,121 · -3.1%
- By 2040
- 124,172 · -9.7%
- By 2050
- 115,611 · -15.9%
- By 2075
- 100,796 · -26.7%
- By 2100
- 86,667 · -36.9%
Race, ethnicity, and origin ACS 2023
- Neighborhood character
- Predominantly White (65%)
- Race & ethnicity
- White 65% Hispanic / Latino 27% Two or more races 16% Asian 1%
- Hispanic origin (detail)
- Puerto Rican 7% Cuban 1% Dominican 15%
- Common ancestry
- Romanian 15% Subsaharan African 3% Iranian 1%
- Foreign-born
- 16% · Canada
- Languages at home
- 72% English-only · Spanish 17% Other Indo-European 7% Russian/Polish/Slavic 2%
Political lean MEDSL · Schuylkill
- 2024 margin
- Solid R (+42.1) · D 28.5% · R 70.6%
- 2008→2024 swing
- -33.4pp toward R · 2008: -8.7pp · 2024: -42.1pp
- All cycles
- 2024: R+42.1 2020: R+39.9 2016: R+43.4 2012: R+13.4 2008: R+8.7
Not yet ingested
- Civics
- —
Market trends
- HPI YoY
- ▲ 31.48%
- Current HPI
- 242.9507
- Rent YoY
- —
- Metro
- —
- State GDP YoY
- ▲ 1.68%
- F500 in state
- 34
Industry mix (Fortune 500 HQ in PA)
| Industry | F500 HQs | Revenue |
|---|---|---|
| Healthcare | 2 | $309B |
|
||
| Insurance | 2 | $27B |
|
||
| Telecommunications / Media | 1 | $124B |
|
||
| Industrial Distribution | 1 | $22B |
|
||
| Financial Services | 1 | $20B |
|
||
| Chemicals / Materials | 1 | $18B |
|
||
Price history
+431.5% since first listed11 events — show timeline
- 2026-06-06 Listed $189,999 LCAR
- 2021-11-16 Sold (Public Records) $135,000 Public Records
- 2021-11-10 Sold (MLS) $135,000 CSVBR
- 2021-11-10 Sold (MLS) $135,000 LCAR
- 2021-11-10 Sold (MLS) $135,000 LCAR
- 2021-11-10 Sold (MLS) $60,000 CSVBR
- 2021-09-07 Listed $155,900 CSVBR
- 2021-09-07 Listed $99,000 CSVBR
- 2021-08-20 Listed $99,000 LCAR
- 2021-08-12 Listed $155,900 LCAR
- 2016-12-19 Sold (Public Records) $35,750 Public Records
Property tax history
+24.8%/yrLatest (2026): $4,886 · +804.0% YoY. Source: county tax records.
Cash-flow waterfall
monthlySold comps — $/sqft
last 12 mo · ≤1 miLoading sold comps…