4002 Sunnyslope Rd SW · Bremerton, WA
Flood risk 1/10 · Minimal
- FEMA flood zone
- X (unshaded)
- Chance of flooding over 30 yrs
- 0.0%
- Est. flood insurance / yr
- $507 – $1,088
Fire risk 4/10 · Minor
- Est. fire insurance / yr
- $604 – $1,122
Heat risk 3/10 · Minor
- Hot days now (above 86°F)
- 7 days/yr
- Hot days in 30 yrs
- 14 days/yr
Wind risk 1/10 · Minimal
- Chance of severe wind over 30 yrs
- —
Air-quality risk 6/10 · Moderate
- Unhealthy air days now
- 8 days/yr
- Unhealthy air days in 30 yrs
- 8 days/yr
Risk factors via First Street. Map © Google.
Why this score? — see what drove the B grade
The composite is a weighted blend of 9 inputs, each scored 0–100. Each bar is that input's sub-score; the figure is the points it added to the 100-point composite (weight × sub-score).
- Cash flow +30.0/30.0
- 1% rule +10.0/10.0
- DSCR +10.0/10.0
- ARV discount +7.5/15.0
- Schools +5.2/10.0
- Livability +4.3/5.0
- Rent growth +2.9/5.0
- Condition / age +2.5/5.0
- Appreciation +0.0/10.0
$150,000
🖨 Deal sheet 📄 Offer letter ✓ Due diligence
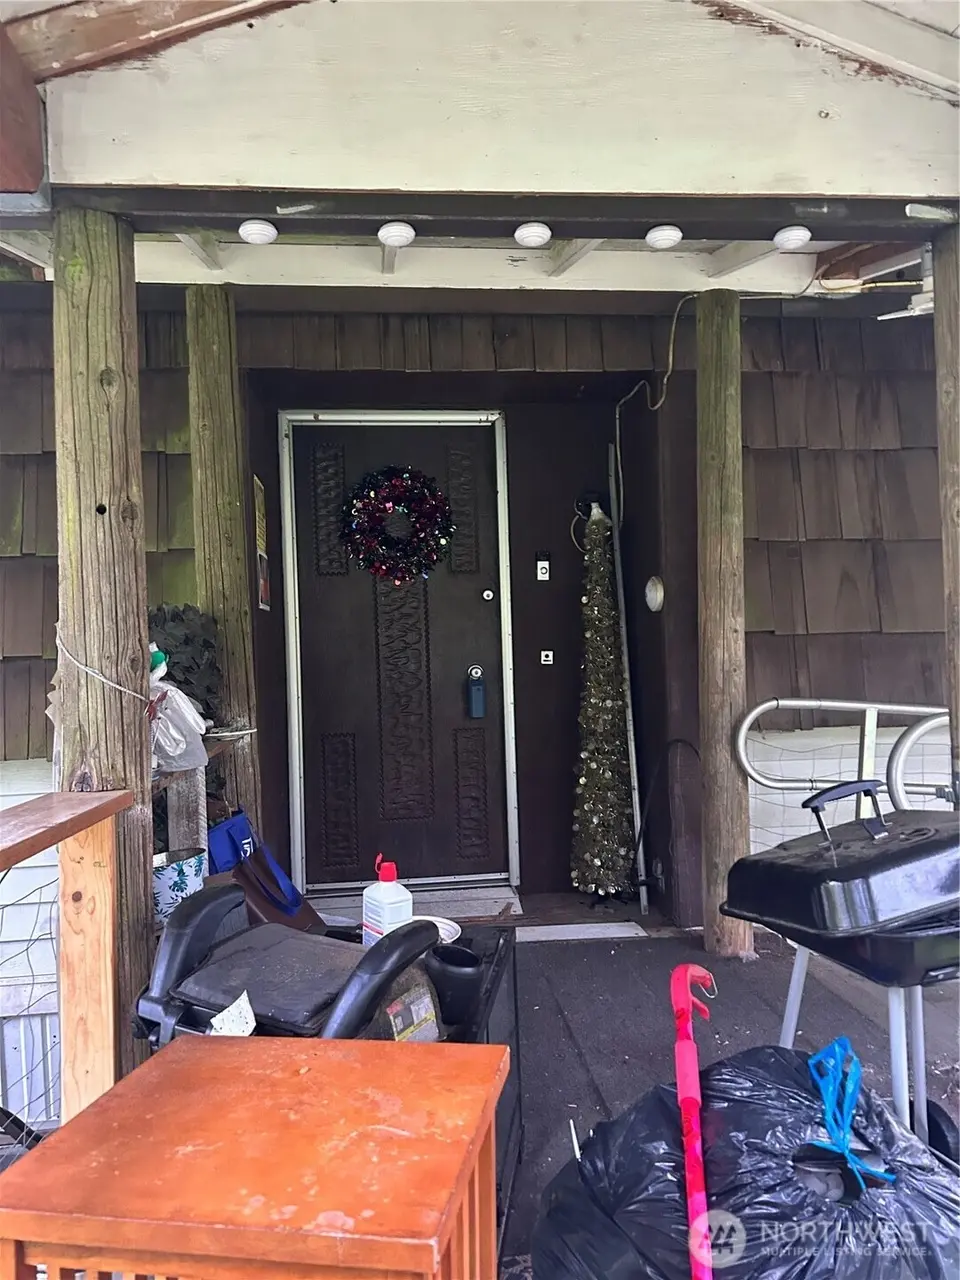
Listing remarks
Big manufactured house on shy acre lot. Staging included in the sale! Large detached garage, trees for privacy and a perfect investor fix up project. Home is sold as is where is. Cash purchase only. Fixed up similar house across the street sold recently for $454,000.
Key facts
- 0.92 acre lot
- Garage
- Built 1971
Property features AI
Finance
- Financial info: Listing is cash only
Exterior
- Parking: Detached garage with two covered spaces
- Utilities: Electric service; Public water; Septic tank sewer
- Home design: Manufactured double-wide home on its land; Single-story
- Construction: Wood construction
- Exterior features: Wood exterior; Green roof
Interior
- Bedrooms: Three bedrooms, all on the main level
- Bathrooms: One full bathroom on the main level; One three-quarter bathroom on the main level
- Heating & cooling: Forced air heating; No cooling
- Interior features: Living room; Dining room
Neighborhood map
What this means for you Summary
Snapshot
- This is a 3-bed/2.0-bath manufactured listed at $150k.
Deal economics
- At list price, monthly cash flow is $1k ($14k/yr) — positive.
- The deal already cash-flows at list — no discount required.
- Meets the 1% rule at list price ($3k rent vs $150k).
- Cap rate 15.5% vs local median 3.5% in Bremerton — top-decile yield for the area; either an underpriced asset or a hidden risk that comps aren't pricing in. Stress-test before assuming the spread holds.
Location & tenants
- Location reads 86/100 on livability (#22 in WA, #431 nationally) — a professional / high-income tenant draw. Strengths: amenities A+, commute A+, housing A+; Watch: crime F.
- South Kitsap School District (suburban): math 52% / reading 64% proficiency, ranked #71 of 291 in WA (top 24%) — acceptable for families but not a draw, mixed tenant base, ~2y average lease.
- Market conditions: Rents rising (+1.6%/yr); 341 active listings in the ZIP; high-income renter base; 1,294 units permitted in Kitsap County in 2024 (302 in 5+ unit buildings).
Forward outlook
- Local home prices are declining (-3.0%/yr); year-one equity from $1k of loan paydown is wiped out by about $4k of value loss. Plan a longer hold.
- Kitsap County population projected at +8% by 2050 — modest demand growth; plan on rents tracking national, not racing it.
- At projected returns (-3.0% appreciation + 1.6% rent growth), your $42k cash investment doubles in ~4 years — after that, you're playing with house money.
Negotiation context
- Only 6 days on market — expect competitive offers; lowballing is unlikely to land.
- Current owner paid $64k; list at $150k implies a 133% gain — meaningful room to come down on a strong offer.
Questions for the listing agent
- Built in 1971 — when were the roof, HVAC, electrical panel, plumbing, and water heater last replaced?
- Is there a deadline driving the sale (1031 exchange, divorce, estate, relocation)? That informs how much negotiation room exists.
- Schools are B-rated — typically a magnet for longer-tenancy family renters. What's the average tenant stay here, and is there a school-zone premium baked into asking?
- Crime grade is F in this area — have there been break-ins, vandalism, or insurance claims at this property in the last 3 years? What carrier currently insures it and at what premium?
- What's the average days-on-market for RENTAL listings here right now (not sales)? A rising rental-DOM trend means longer vacancies and softer asking-rent achievability than the comps imply.
- What's the recent tenant-quality profile in this submarket — average credit score on applications, eviction rate, late-payment / NSF rate, and stable-employment percentage? A property-management company in the area should have these aggregated.
- How much new for-sale + rental construction is in the pipeline within 1–3 miles? Heavy new supply typically softens prices + rents 12–24 months out; constrained supply supports both.
Investment metrics
- 1% rule
- 1.80% ✓
- Cap rate
- 15.45%
- Cash-on-cash
- 32.71%
- DSCR
- 2.46
- GRM
- 4.6
CMA / ARV
- ARV (on-the-fly)
- $449,820
- Comps found
- 4
Show comp detail 4 sales within ~0.75 mi
| Address | Dist | Beds/Ba | Sqft | Sold | Price | $/sf | Match |
|---|---|---|---|---|---|---|---|
| 4002 Sunnyslope Rd SW | 0.00mi | 3/1.5 | 1,836 (0%) | 0mo | $160,000 | $87 | 98 |
| 4290 SW Sunnyslope Rd | 0.20mi | 3/2.0 | 1,782 (-3%) | 11mo | $350,000 | $196 | 77 |
| 5131 Southgate Dr SW | 0.75mi | 2/2.0 (-1) | 1,836 (0%) | 6mo | $450,000 | $245 | 55 |
| 4838 Victory Dr SW | 0.55mi | 3/2.0 | 1,620 (-12%) | 8mo | $425,000 | $262 | 48 |
Match score weights: distance 35% · size 25% · config 20% · recency 20%. Top-matched comps best support the ARV.
Projected returns pro-forma
-3.0% appreciation · 1.6% rent growth · sell at horizon
- IRR
- 26.3%
- Equity multiple
- 2.07×
- Total profit
- $44,868
- Equity at exit
- $22,365
- IRR
- 33.1%
- Equity multiple
- 3.81×
- Total profit
- $118,031
- Equity at exit
- $12,969
Cash invested: $42,000 (down + closing). Projections, not guarantees.
Landlord ↔ Tenant lean methodology
- Overall (STATE)
- 28 Tenant-Leaning
- State Washington
- 28 Tenant-Leaning · D+8
- County
- — inherits STATE
- City
- — inherits STATE
ZIP-level market 98367
- Rents YoY
- 1.6%
- Active inventory
- 341
- Price-to-rent
- 4.6×
Monthly cashflow live
- Estimated rent
- $2,703 medium interval (Pro) →
- Mortgage (P&I)
- −$787
- Tax from tax record
- −$142 /mo · $1,699/yr
- Insurance
- −$62
- HOA
- −$0
- Vacancy / Maint / Mgmt
- −$568
- Net cashflow
- $1,145
Break-even live
UW: 25.0% down · 7.5% · 30yr · 1.5% tax · 5.0% vac · 8.0% maint · 8.0% mgmt
Financing live
Cash to close
- Down payment
- $37,500
- Closing costs
- $4,500
- Reserves months
- —
- Total cash needed
- —
Loan-product check · same deal, 3 products live
Conventional
25% down · 7.5% · 30yr
- Down + closing
- —
- Monthly P&I
- —
- Monthly cashflow
- —
- DSCR
- —
- Eligible?
- —
Personal DTI + credit; lowest rate.
DSCR
20% down · 8.5% · 30yr
- Down + closing
- —
- Monthly P&I
- —
- Monthly cashflow
- —
- DSCR
- —
- Eligible?
- —
No personal income docs; deal must DSCR.
Hard money
10% down · 12.0% · 12mo
- Down + closing
- —
- Monthly P&I
- —
- Monthly cashflow
- —
- DSCR
- —
- Eligible?
- —
Short-term bridge; refi at stabilization.
Listing history 4 events
-
2026-04-30status Pending
-
2026-04-24$150,000 Active
-
1986-05-22soldstatus $64,500
-
1986-05-22soldstatus $64,500
ⓘ Source: listings_history table (triggers on properties + properties_extension) + one-shot
backfill from property_details.listing_events for pre-trigger history.
Tax reassessment forecast WA · Resets to sale price
- Current annual tax
- $1,699 · $142/mo
- Projected year-2 tax
- $1,699 · $142/mo
- Expected delta
- $0/yr ($0/mo · 0.0%)
ⓘ Screening estimate from a state-policy table — verify with the county assessor before closing.
Climate risk First Street
- Flood 1/10 Low FEMA zone X (unshaded) · 0% chance over 30 yrs
- Wildfire 4/10 Moderate
- Heat 3/10 Moderate 7 d/yr ≥86°F today · 14 d/yr by 30 yrs out
- Wind 1/10 Low
- Air quality 6/10 Major 8 unhealthy d/yr today · 8 by 30 yrs out
Nearby sold comps map
Loading sold comps map…
Walkable amenities ~0.75 mi
Loading nearby amenities…
Taxation est. · year 1
- Rental income
- $32,439
- − Mortgage interest
- −$8,402
- − Property taxes
- −$1,699
- − Insurance
- −$750
- − Repairs & maintenance
- −$2,595
- − Management
- −$2,595
- − Depreciation
- −$4,364
- Taxable income
- $12,034
- Est. tax owed @ 24.0%
- −$2,888
- After-tax cash flow
- $10,850/yr
For passive investors: Depreciation is non-cash, so a rental often shows a tax loss while cash-flowing — sheltering income. Rental losses are passive: they offset passive income freely, and up to $25,000/yr can offset ordinary (W-2) income if you actively participate and your MAGI is under $100k (phasing out to $0 by $150k); unused losses carry forward. On sale, claimed depreciation is recaptured at up to 25%, and gains may owe capital-gains tax (a 1031 exchange can defer both). Figures are a year-1 estimate at your 24.0% rate — not tax advice; consult a CPA.
Schools (NCES district)
- District
- South Kitsap School District
- NCES district ID
- 5308160
- Math proficiency
- 52% ▲ 2.00%
- Reading proficiency
- 64% ▲ 3.00%
- Median HH income
- $62,824
- Composite
- 52.31/100
- National rank
- #3445
- State rank
- #71 of 291 in WA
Livability — Bremerton
- Score
- 86/100
- State rank
- #22
- US rank
- #431
Category grades
Schools grade is shown separately in the Schools card above.
Census & demographics
- County
- Kitsap County · 243,099 people
- City population
- 94,488
- Metro
- Bremerton-Silverdale-Port Orchard, WA
- Population (ZIP)
- 31,756
- Household income
- $115,482
- Rent vs Own
- Severe rent burden
- 595.0
Population outlook (Kitsap County) Hauer SSP2
- Today (2025)
- 277,525 people
- By 2030
- 285,040 · +2.7%
- By 2040
- 294,957 · +6.3%
- By 2050
- 300,622 · +8.3%
- By 2075
- 315,580 · +13.7%
- By 2100
- 304,340 · +9.7%
Race, ethnicity, and origin ACS 2023
- Neighborhood character
- Predominantly White (78%)
- Race & ethnicity
- White 78% Two or more races 11% Hispanic / Latino 7% Asian 4% Pacific Islander 1%
- Hispanic origin (detail)
- Mexican 5%
- Common ancestry
- Italian 7% Portuguese 6% Slovak 4%
- Foreign-born
- 6% · Canada, South Korea, Vietnam
- Languages at home
- 91% English-only · Spanish 3% Tagalog/Filipino 2% Other Asian/Pacific 2%
Political lean MEDSL · Kitsap
- 2024 margin
- Strong D (+20.9) · D 58.8% · R 37.9% · Other 3.3%
- 2008→2024 swing
- +8.6pp toward D · 2008: 12.3pp · 2024: 20.9pp
- All cycles
- 2024: D+20.9 2020: D+18.1 2016: D+11.6 2012: D+11.1 2008: D+12.3
Not yet ingested
- Civics
- —
Market trends
- HPI YoY
- ▼ -441.02%
- Current HPI
- 351.671
- Rent YoY
- ▲ 1.60%
- Metro
- Bremerton-Silverdale-Port Orchard, WA
- State GDP YoY
- ▲ 4.65%
- F500 in state
- 22
Industry mix (Fortune 500 HQ in WA)
| Industry | F500 HQs | Revenue |
|---|---|---|
| Retail | 2 | $269B |
|
||
| Technology / Retail | 1 | $638B |
|
||
| Technology | 1 | $245B |
|
||
| Telecommunications | 1 | $38B |
|
||
| Food / Beverage | 1 | $36B |
|
||
| Automotive / Trucks | 1 | $34B |
|
||
Price history
+132.6% since first listed4 events — show timeline
- 2026-04-30 Pending — NWMLS as Distributed by MLS Grid
- 2026-04-24 Listed $150,000 NWMLS as Distributed by MLS Grid
- 1986-05-22 Sold (Public Records) $64,500 Public Records
- 1986-05-22 Sold (Public Records) $64,500 Public Records
Property tax history
+2.2%/yrLatest (2026): $1,699 · +0.5% YoY. Source: county tax records.
Cash-flow waterfall
monthlySold comps — $/sqft
last 12 mo · ≤1 miLoading sold comps…