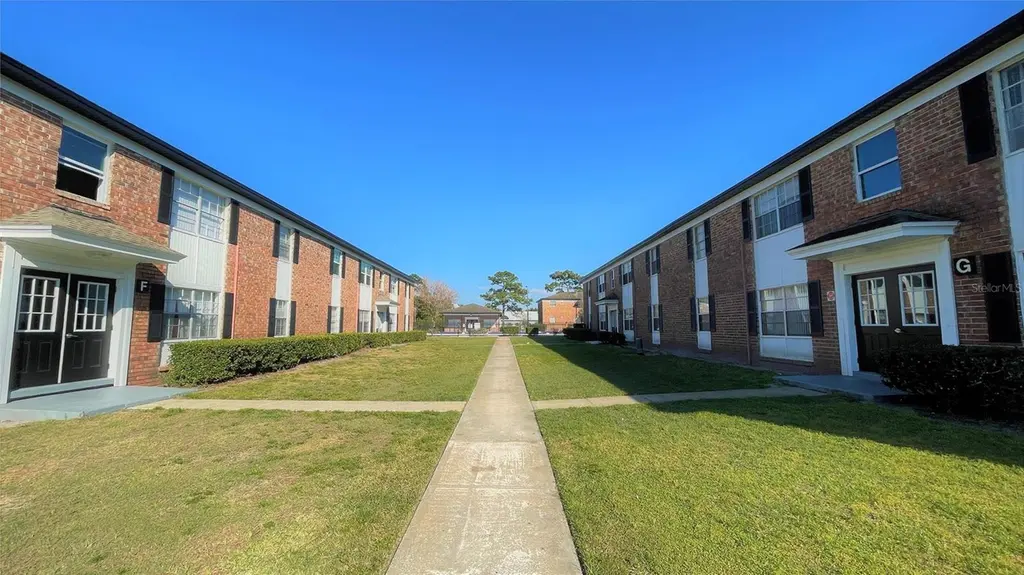
5317 Curry Ford Rd Unit O201 · Orlando, FL
Flood risk No data
- FEMA flood zone
- —
- Chance of flooding over 30 yrs
- —
- Est. flood insurance / yr
- —
Fire risk No data
- Est. fire insurance / yr
- —
Heat risk No data
- Hot days now (above threshold)
- —
- Hot days in 30 yrs
- —
Wind risk No data
- Chance of severe wind over 30 yrs
- —
Air-quality risk No data
- Unhealthy air days now
- —
- Unhealthy air days in 30 yrs
- —
Risk factors via First Street. Map © Google.
Why this score? — see what drove the D grade
The composite is a weighted blend of 9 inputs, each scored 0–100. Each bar is that input's sub-score; the figure is the points it added to the 100-point composite (weight × sub-score).
- Cash flow +13.3/30.0
- ARV discount +7.5/15.0
- 1% rule +6.0/10.0
- Livability +4.3/5.0
- Schools +4.1/10.0
- DSCR +4.0/10.0
- Condition / age +2.5/5.0
- Rent growth +2.0/5.0
- Appreciation +0.0/10.0
$120,000
🖨 Deal sheet (PDF) 📄 Offer letter ✓ Due diligence
Listing remarks
Attention Investors! Don’t miss out on this immaculate, move-in ready 1-bedroom, 1-bathroom condo, located in a beautifully maintained building with a brand-new roof (2024). Situated on the second floor, this stunning unit is in excellent condition, making it a perfect opportunity for both personal living or rental income. The location is unbeatable—just 15 minutes from Orlando International Airport, 5 minutes to Highway 408, and only 1 minute from shopping, dining, and supermarkets. Whether you're looking for a cozy home or a hassle-free investment, this condo offers comfort, convenience, and prime Orlando access!
Key facts
- Second floor
- Brand-new roof
- 5,471 sq ft lot
Tags
Property features AI
Finance
- Other: Zoned O-1/AN; Lot around 0.13 acres (approx. 0 to less than 1/4 acre)
- HOA & community: Monthly HOA fee of $215.67 (association approval required); Pets allowed: cats and dogs (size limits apply)
Exterior
- Parking: Open parking
- Utilities: Public water; Public sewer; Other utilities
- Home design: Single family residence; Residential property; 2 total stories; Faces north; Located on second floor (Unit O201)
- Construction: Other construction materials; Other roof type; Basement foundation
- Exterior features: Other exterior features
Interior
- Kitchen: Microwave; Refrigerator; Other appliances
- Bedrooms: 1 bedroom
- Flooring: Laminate flooring
- Bathrooms: 1 full bathroom
- Heating & cooling: Central heating; Central air conditioning
- Interior features: Other interior features
- Laundry & utility: Other laundry features; Basement utility/foundation
Neighborhood map
What this means for you Summary
Snapshot
- This is a 1-bed/1.0-bath condo listed at $120k.
Deal economics
- At list price, monthly cash flow is $0 ($3/yr) — positive.
- The deal already cash-flows at list — no discount required.
- Meets the 1% rule at list price ($1k rent vs $120k).
- Recommended offer: $118k (1.5% below list) — sets the bar for market timing.
- Cap rate 6.3% vs local median 3.0% in Orlando — top-decile yield for the area; either an underpriced asset or a hidden risk that comps aren't pricing in. Stress-test before assuming the spread holds.
Location & tenants
- Location reads 86/100 on livability (#12 in FL, #360 nationally) — a professional / high-income tenant draw. Strengths: amenities A+, commute A+, housing A+.
- Orange (suburban): math 46% / reading 51% proficiency, ranked #43 of 73 in FL (top 59%) — families likely to look elsewhere, expect single-tenant / working-renter base with shorter leases.
- Zoned schools: Dover Shores Elementary (math 47% / reading 47%, grade D-, #1,191 of 2,144 statewide, top 57%, 394 students, 61% FRL); Roberto Clemente Middle (math 31% / reading 36%, grade F, #428 of 571 statewide, top 76%, 951 students, 63% FRL); William R Boone High (math 36% / reading 58%, grade D-, #207 of 667 statewide, top 32%, 2,780 students, 44% FRL) — zoned schools at 56% FRL track the district average.
- Market conditions: Rents soft (-2.0%/yr); 217 active listings in the ZIP; 40 comparable units currently listed for rent nearby; rentals leasing fast (median 10d on market — plan ~1-2 weeks tenant-placement turnaround); 8,053 units permitted in Orange County in 2024 (3,133 in 5+ unit buildings).
Forward outlook
- Local home prices are declining (-3.0%/yr); year-one equity from $830 of loan paydown is wiped out by about $4k of value loss. Plan a longer hold.
- Orange County population projected at +52% by 2050 — long-run rental-demand tailwind backs the buy-and-hold thesis.
Negotiation context
- It's been on market 30 days — a 2% lower offer ($118k) is reasonable based on typical stale-listing flexibility.
- 2 sale attempts with the ask held roughly flat each time — persistent listings suggest the price (not the market) is what's stuck; bring a comps-based counter.
Questions for the listing agent
- Built in 1968 — when were the roof, HVAC, electrical panel, plumbing, and water heater last replaced?
- What does the HOA fee cover, when was the last increase, and are there any pending special assessments or reserve-fund shortfalls?
- Any open or pending special assessments — roof, HVAC, plumbing, elevator, façade? What's the per-unit balance and payoff schedule, and is the seller paying it off at close or rolling it to the buyer?
- Is there a deadline driving the sale (1031 exchange, divorce, estate, relocation)? That informs how much negotiation room exists.
- Schools are B-rated — typically a magnet for longer-tenancy family renters. What's the average tenant stay here, and is there a school-zone premium baked into asking?
- The area grade is low — what's the realistic commute time and amenity access for the typical tenant pool here? Any planned neighborhood developments (good or bad) we should know about?
- What's the average days-on-market for RENTAL listings here right now (not sales)? A rising rental-DOM trend means longer vacancies and softer asking-rent achievability than the comps imply.
- What's the recent tenant-quality profile in this submarket — average credit score on applications, eviction rate, late-payment / NSF rate, and stable-employment percentage? A property-management company in the area should have these aggregated.
- How much new apartment / multifamily construction is in the pipeline within 1–3 miles? Heavy new supply (>2% of stock underway) typically softens rents 12–24 months out; light construction supports rent growth.
Investment metrics
- 1% rule
- 1.10% ✓
- Cap rate
- 6.30%
- Cash-on-cash
- 0.01%
- DSCR
- 1.00
- GRM
- 7.6
CMA / ARV
No comps found within radius.
Projected returns pro-forma
-3.0% appreciation · 0.0% rent growth · sell at horizon
- IRR
- -20.5%
- Equity multiple
- 0.31×
- Total profit
- $-23,141
- Equity at exit
- $17,892
- IRR
- -25.5%
- Equity multiple
- -0.03×
- Total profit
- $-34,447
- Equity at exit
- $10,375
Cash invested: $33,600 (down + closing). Projections, not guarantees.
Landlord ↔ Tenant lean methodology
- Overall (STATE)
- 87 Strongly Landlord-Friendly
- State Florida
- 87 Strongly Landlord-Friendly · R+3
- County
- — inherits STATE
- City
- — inherits STATE
ZIP-level market 32812
- Rents YoY
- -2.0%
- Active inventory
- 217
- Price-to-rent
- 7.6×
Monthly cashflow live
- Estimated rent
- $1,318 high interval (Pro) →
- Mortgage (P&I)
- −$629
- Tax from tax record
- −$147 /mo · $1,761/yr
- Insurance
- −$50
- HOA
- −$215
- Vacancy / Maint / Mgmt
- −$277
- Net cashflow
- $0
Break-even live
Sensitivity live
| Price | -10% $68 | -5% $34 | +0% $0 | +5% $-34 | +10% $-68 |
|---|---|---|---|---|---|
| Rent | -10% $-104 | -5% $-52 | +0% $0 | +5% $52 | +10% $104 |
| Rate | -1.0pp $61 | -0.5pp $31 | base $0 | +0.5pp $-31 | +1.0pp $-62 |
UW: 25.0% down · 7.5% · 30yr · 1.5% tax · 5.0% vac · 8.0% maint · 8.0% mgmt
Financing live
Cash to close
- Down payment
- $30,000
- Closing costs
- $3,600
- Reserves months
- —
- Total cash needed
- —
Loan-product check · same deal, 3 products live
Conventional
25% down · 7.5% · 30yr
- Down + closing
- —
- Monthly P&I
- —
- Monthly cashflow
- —
- DSCR
- —
- Eligible?
- —
Personal DTI + credit; lowest rate.
DSCR
20% down · 8.5% · 30yr
- Down + closing
- —
- Monthly P&I
- —
- Monthly cashflow
- —
- DSCR
- —
- Eligible?
- —
No personal income docs; deal must DSCR.
Hard money
10% down · 12.0% · 12mo
- Down + closing
- —
- Monthly P&I
- —
- Monthly cashflow
- —
- DSCR
- —
- Eligible?
- —
Short-term bridge; refi at stabilization.
Rent comps 40 comps
| Address | Beds | Baths | Sqft | Rent | $/sqft | DOM | Units | Dist |
|---|---|---|---|---|---|---|---|---|
| 5113 Curry Ford Rd Unit 3 Orlando, FL | 1.0 | 1.0 | 588 | $1,195 | $2.03 | 25d | 1 | 0.29mi |
| 5101 Curry Ford Rd Unit 4 Orlando, FL | 1.0 | 1.0 | 588 | $1,045 | $1.78 | 0d | 1 | 0.32mi |
| 5101 Curry Ford Rd Unit 4 Orlando, FL | 1.0 | 1.0 | 588 | $1,045 | $1.78 | 6d | 1 | 0.32mi |
| 5560 Curry Ford Rd Orlando, FL | — | 1.0 | 475 | $1,150 | $2.42 | 23d | 1 | 0.33mi |
| 1448 Adriel Ln Orlando, FL | 1.0–2.0 | 1.0–2.0 | 712 | $1,275 | $1.79 | 23d | 1 | 0.36mi |
| 5317 Curry Ford Rd Orlando, FL | 1.0–2.0 | 1.0 | 661 | $1,199 | $1.81 | 4d | 3 | 0.36mi |
| 5801 Shenandoah Way Orlando, FL | 1.0–3.0 | 1.0–2.0 | 999 | $995 | $1.00 | 0d | 3 | 0.75mi |
| 4401 Lenmore St #3 Orlando, FL | 2.0 | 1.0 | 620 | $2,100 | $3.39 | 25d | 1 | 0.81mi |
| 4401 Lenmore St Unit 2 Orlando, FL | — | 1.0 | 736 | $1,800 | $2.45 | 25d | 1 | 0.81mi |
| 4900 Dover Cir Unit 4906 Orlando, FL | 1.0 | 1.0 | 583 | $1,250 | $2.14 | 9d | 1 | 0.81mi |
| 1626 Conway Rd Unit 2 Orlando, FL | — | 1.0 | 422 | $750 | $1.78 | 25d | 1 | 0.82mi |
| 1935 Conway Rd Unit O5 Orlando, FL | 1.0 | 1.0 | 695 | $1,250 | $1.80 | 22d | 1 | 0.89mi |
| 5707 Beau Barton Pl Orlando, FL | 1.0 | 1.0 | 525 | $1,314 | $2.50 | 5d | 6 | 0.89mi |
| 5914 Mausser Dr Orlando, FL | 1.0–4.0 | 1.0–2.5 | 1052 | $1,534 | $1.46 | 0d | 14 | 0.93mi |
| 5870 Sundown Cir Orlando, FL | 1.0–2.0 | 1.0–2.0 | 840 | $1,299 | $1.55 | 0d | 23 | 0.97mi |
| 2320 S Conway Rd Orlando, FL | 3.0 | 1.0–2.0 | 760 | $1,406 | $1.85 | 0d | 22 | 1.00mi |
| 720 Conway Rd Orlando, FL | 2.0 | 1.0–2.0 | 995 | $1,595 | $1.60 | 0d | 15 | 1.03mi |
| 2100 Conway Rd Orlando, FL | 1.0–3.0 | 1.0–2.0 | 1022 | $1,792 | $1.75 | 0d | 19 | 1.06mi |
| 525 Conway Rd Orlando, FL | 1.0–2.0 | 1.0–1.5 | 748 | $1,350 | $1.80 | 0d | 4 | 1.08mi |
| 2143 Raper Dairy Rd Orlando, FL | 1.0 | 1.0 | 432 | $1,319 | $3.05 | 0d | 9 | 1.12mi |
| 3282 S Semoran Blvd #24 Orlando, FL | 1.0 | 1.0 | 629 | $1,295 | $2.06 | 5d | 1 | 1.12mi |
| 2490 Conway Rd Orlando, FL | 1.0–2.0 | 1.0–2.0 | 984 | $1,326 | $1.35 | 0d | 14 | 1.14mi |
| 3211 S Semoran Blvd Orlando, FL | 1.0–3.0 | 1.0–2.0 | 880 | $1,099 | $1.25 | 3d | 12 | 1.16mi |
| 6110 Curry Ford Rd #117 Orlando, FL | 1.0 | 1.0 | 742 | $1,175 | $1.58 | 25d | 1 | 1.16mi |
| 4004 Lake Underhill Rd Orlando, FL | 1.0–3.0 | 1.0–2.0 | 891 | $1,542 | $1.73 | 0d | 14 | 1.16mi |
| 1245 Catalpa Ln Unit 2 Orlando, FL | — | 1.0 | 505 | $2,000 | $3.96 | 25d | 1 | 1.19mi |
| 1245 Catalpa Ln Unit 4 Orlando, FL | 1.0 | 1.0 | 600 | $2,100 | $3.50 | 22d | 1 | 1.19mi |
| 1245 Catalpa Ln #3 Orlando, FL | 1.0 | 1.0 | 505 | $2,000 | $3.96 | 25d | 1 | 1.19mi |
| 6118 Curry Ford Rd Orlando, FL | 1.0 | 1.0 | 742 | $1,175 | $1.58 | 25d | 1 | 1.19mi |
| 3700 Curry Ford Rd Orlando, FL | 3.0 | 1.0–2.0 | 830 | $1,480 | $1.78 | 3d | 29 | 1.19mi |
| 2520 Conway Rd Orlando, FL | 1.0–2.0 | 1.0–2.0 | 967 | $1,149 | $1.19 | 13d | 15 | 1.20mi |
| 6122 Curry Ford Rd #241 Orlando, FL | 1.0 | 1.0 | 742 | $1,325 | $1.79 | 25d | 1 | 1.21mi |
| 6203 Curry Ford Rd Orlando, FL | 1.0–3.0 | 1.0–2.0 | 1011 | $1,320 | $1.30 | 15d | 1 | 1.22mi |
| 3312 S Semoran Blvd Orlando, FL | 3.0 | 1.0–2.0 | 820 | $1,419 | $1.73 | 4d | 15 | 1.22mi |
| 502 Engel Dr Unit 3 Orlando, FL | 1.0 | 1.0 | 500 | $1,750 | $3.50 | 25d | 1 | 1.23mi |
| 502 Engel Dr Unit 2 Orlando, FL | 1.0 | 1.0 | 400 | $1,550 | $3.88 | 25d | 1 | 1.23mi |
| 2859 Conway Rd Orlando, FL | 1.0–3.0 | 1.0–2.0 | 917 | $1,299 | $1.42 | 9d | 17 | 1.27mi |
| 2516 Woodgate Blvd #203 Orlando, FL | 1.0 | 1.0 | 680 | $1,245 | $1.83 | 9d | 1 | 1.29mi |
| 2556 Woodgate Blvd #203 Orlando, FL | 1.0 | 1.0 | 680 | $1,350 | $1.99 | 16d | 1 | 1.30mi |
| 625 Tam O Shanter Dr Orlando, FL | 1.0 | 1.0 | 500 | $1,500 | $3.00 | 25d | 1 | 1.31mi |
HOA detail condo
- Monthly dues
- $215 · $2,580/yr
- Assessments
- None detected in remarks — confirm with the listing agent.
Listing history 23 events
-
2026-06-21days on market $120,000 Active 30 DOM
-
2026-06-18days on market $120,000 Active 27 DOM
-
2026-06-17days on market $120,000 Active 26 DOM
-
2026-06-16days on market $120,000 Active 25 DOM
-
2026-06-15days on market $120,000 Active 24 DOM
-
2026-06-13days on market $120,000 Active 22 DOM
-
2026-06-13days on market $120,000 Active 21 DOM
-
2026-06-09days on market $120,000 Active 18 DOM
-
2026-06-08days on market $120,000 Active 17 DOM
-
2026-06-07days on market $120,000 Active 16 DOM
-
2026-06-04days on market $120,000 Active 13 DOM
-
2026-06-03days on market $120,000 Active 12 DOM
-
2026-06-02days on market $120,000 Active 11 DOM
-
2026-06-01days on market $120,000 Active 10 DOM
-
2026-05-31days on market $120,000 Active 9 DOM
-
2026-05-22$120,000 Active
-
2026-04-03historical
-
2025-12-22$127,000 Active
-
2023-05-24soldstatus $125,000
-
2022-01-11soldstatus $100,000
-
2020-02-25soldstatus $79,900
-
2020-01-31soldstatus $55,500
-
2012-02-20soldstatus $870,000
ⓘ Source: listings_history table (triggers on properties + properties_extension) + one-shot
backfill from property_details.listing_events for pre-trigger history.
Tax reassessment forecast FL · Resets to sale price
- Current annual tax
- $1,761 · $147/mo
- Projected year-2 tax
- $1,761 · $147/mo
- Expected delta
- $0/yr ($0/mo · 0.0%)
ⓘ Screening estimate from a state-policy table — verify with the county assessor before closing.
Nearby sold comps map
Loading sold comps map…
Walkable amenities ~0.75 mi
Loading nearby amenities…
Taxation est. · year 1
- Rental income
- $15,817
- − Mortgage interest
- −$6,722
- − Property taxes
- −$1,761
- − Insurance
- −$600
- − Repairs & maintenance
- −$1,265
- − Management
- −$1,265
- − HOA
- −$2,580
- − Depreciation
- −$3,491
- Taxable loss
- −$1,867
- Est. tax savings @ 24.0%
- +$448
- After-tax cash flow
- $451/yr
For passive investors: Depreciation is non-cash, so a rental often shows a tax loss while cash-flowing — sheltering income. Rental losses are passive: they offset passive income freely, and up to $25,000/yr can offset ordinary (W-2) income if you actively participate and your MAGI is under $100k (phasing out to $0 by $150k); unused losses carry forward. On sale, claimed depreciation is recaptured at up to 25%, and gains may owe capital-gains tax (a 1031 exchange can defer both). Figures are a year-1 estimate at your 24.0% rate — not tax advice; consult a CPA.
Schools (NCES district)
- District
- Orange
- NCES district ID
- 1201440
- Math proficiency
- 46% ▼ -9.00%
- Reading proficiency
- 51% ▼ -2.00%
- Median HH income
- $49,350
- Composite
- 41.47/100
- National rank
- #3461
- State rank
- #43 of 73 in FL
Livability — Orlando
- Score
- 86/100
- State rank
- #12
- US rank
- #360
Category grades
Schools grade is shown separately in the Schools card above.
Census & demographics
- Census place
- Orlando, FL
- County
- Orange County · 1,471,359 people
- City population
- 964,969
- Metro
- Orlando-Kissimmee-Sanford, FL
- Population (ZIP)
- 34,686
- Household income
- $73,149
- Rent vs Own
- Severe rent burden
- 1653.0
Population outlook (Orange County) Hauer SSP2
- Today (2025)
- 1,618,226 people
- By 2030
- 1,787,404 · +10.5%
- By 2040
- 2,125,621 · +31.4%
- By 2050
- 2,454,016 · +51.6%
- By 2075
- 3,173,711 · +96.1%
- By 2100
- 3,607,781 · +122.9%
Race, ethnicity, and origin ACS 2023
- Neighborhood character
- Diverse neighborhood (Simpson 0.63)
- Race & ethnicity
- White 49% Hispanic / Latino 34% Two or more races 18% Black 8% Asian 4%
- Hispanic origin (detail)
- Mexican 3% Puerto Rican 18% Cuban 3% Dominican 2%
- Common ancestry
- Romanian 3% Slovak 2% Iranian 2%
- Foreign-born
- 13% · Canada, Jamaica, Vietnam
- Languages at home
- 66% English-only · Spanish 28% Chinese 2% Other Indo-European 1%
Political lean MEDSL · Orange
- 2024 margin
- D (+13.6) · D 56.1% · R 42.5% · Other 1.3%
- 2008→2024 swing
- -5.0pp toward R · 2008: 18.6pp · 2024: 13.6pp
- All cycles
- 2024: D+13.6 2020: D+23.1 2016: D+24.6 2012: D+18.2 2008: D+18.6
Not yet ingested
- Civics
- —
Market trends
- HPI YoY
- ▼ -202.16%
- Current HPI
- 352.6841
- Rent YoY
- ▼ -2.00%
- Metro
- Orlando-Kissimmee-Sanford, FL
- State GDP YoY
- ▲ 3.28%
- F500 in state
- 36
Industry mix (Fortune 500 HQ in FL)
| Industry | F500 HQs | Revenue |
|---|---|---|
| Industrial Technology | 2 | $29B |
|
||
| Insurance | 2 | $17B |
|
||
| Retail | 1 | $60B |
|
||
| Technology Distribution | 1 | $58B |
|
||
| Homebuilding | 1 | $35B |
|
||
| Technology Manufacturing | 1 | $35B |
|
||
Price history
-86.2% since first listed8 events — show timeline
- 2026-05-22 Listed $120,000 Stellar MLS as Distributed by MLS Grid
- 2026-04-03 Listing Removed — Stellar MLS as Distributed by MLS Grid
- 2025-12-22 Listed $127,000 Stellar MLS as Distributed by MLS Grid
- 2023-05-24 Sold (Public Records) $125,000 Public Records
- 2022-01-11 Sold (Public Records) $100,000 Public Records
- 2020-02-25 Sold (Public Records) $79,900 Public Records
- 2020-01-31 Sold (Public Records) $55,500 Public Records
- 2012-02-20 Sold (Public Records) $870,000 Public Records
Property tax history
+14.2%/yrLatest (2025): $1,761 · +14.5% YoY. Source: county tax records.
Cash-flow waterfall
monthlySold comps — $/sqft
last 12 mo · ≤1 miLoading sold comps…